2212
High resolution MRI for functional and structural depiction of subthalamic nuclei in DBS pre-surgical mapping: a comparison between QSM and T2w1Radiology, Weill Cornell Medical College, New York, NY, United States, 2Meinig School of Biomedical Engineering, Cornell University, Ithaca, NY, United States, 3Neurosurgery, Mount Sinai Health System, New York, NY, United States
Synopsis
In this work, we investigate the use of a sub-millimeter quantitative susceptibility mapping (QSM) protocol for preoperative imaging of the suthalamic nucleui (STN) for planning of deep brain stimulation (DBS). Image scoring revealed superior performance of QSM compared to the conventional T2 weighted (T2W) protocol. In contrast to T2W, image scores further increased for QSM when resolution was increased.
Target audience
researchers and clinicians interested in deep gray matter structures imaging and deep brain stimulation (DBS).Purpose
Accurate depiction of the subthalamic nucleus (STN) is crucial for DBS surgery planning used in treatment of patients with Parkinson’s disease (PD) [1-3]. Quantitative susceptibility mapping (QSM) has been shown to be superior to traditional T2 weighted spin echo imaging (T2w) [4,5]. The aim of the study was to describe a sub-millimeter QSM protocol for preoperative imaging of the STN in planning of DBS.Methods
7 healthy volunteers were included in this study. T2w and QSM were obtained for all healthy volunteers, and images of different resolutions were reconstructed. Image quality and visibility of STN anatomical features were analyzed by a radiologist using a 5 point scale. To characterize visibility of each STN quadrant on QSM and T2w images, their CNRs with respect to immediately adjacent white matter (WM) were calculated for each slice resolution according to the following definition: $$$CNR_{WM} = \frac{|I_j-I_{wm}|}{\sigma_{wm}}$$$. Here $$$I_j$$$ is the average intensity of one of the four STN quadrants, $$$I_{wm}$$$ is average WM intensity and $$$\sigma_{wm}$$$ is the standard deviation of intensity within the closest white matter sector. To assess the sensitivity of each sequence to the heterogeneous distribution of iron within the STN, contrast ratios between adjacent quadrants were estimated. The contrast ratio between regions i and j was defined as $$$CR_{ij} = \frac{I_i-I_j}{I_j}$$$. Statistical analysis was performed using MATLAB routines. Comparisons of CNR values for each resolution were performed using the Wilcoxon signed rank test. For visualization scores, the Wilcoxon rank sum test was employed to test the image score differences between imaging methods for both resolutions. Additionally, data from 10 retrospectively and randomly selected PD patients who underwent 3T MRI for DBS were analyzed for STN size and susceptibility gradient measurements.Results
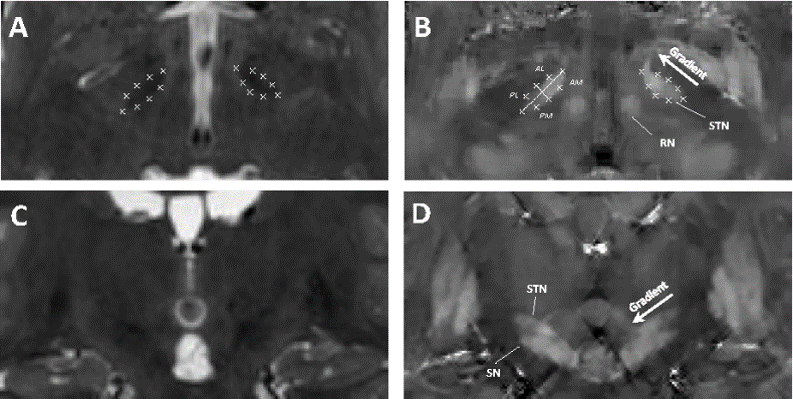
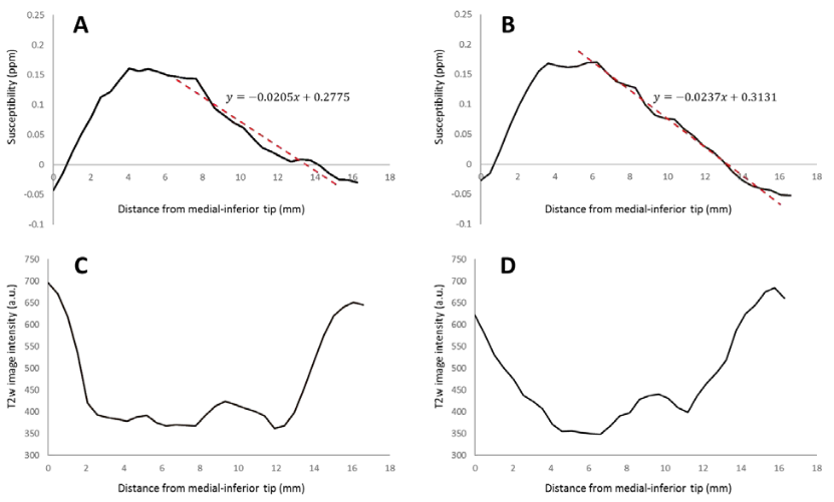
The average visualization scores for QSM and T2w images in high/low resolutions were, 3.86/2.0 and 1.886/1.0, respectively. The difference between scores for high resolution QSM and T2w images was significant (p<0.005), while no statistically significant difference was observed in the low resolution image sets. Switching to high resolution led to a statically significant increase in the radiologist’s assessment of the QSM images (p<0.005), but not of the T2w images. Higher contrast-to-noise (CNR) values were observed in both high and low resolution QSM images. Inter-resolution comparison demonstrated improvement in CNR for QSM (p<0.05, Table 2), but not for T2w images. QSM provided higher inter-quadrant contrast ratios (CR) within the STN, and depicted a gradient in the distribution of susceptibility sources not visible in T2w images.
STN sizes along its three main axes (mediodorsal-lateroventral, dorsolateral-ventromedial and rostro-caudal) were $$$(3.2±0.3)\times(5.3±0.3)\times(11.8±0.9)$$$ mm3 for the left and $$$(3.1±0.2)\times(5.3±0.4)\times(11.0±0.9)$$$ mm3 for the right STN. The STN susceptibility gradient over all healthy subjects was $$$-0.022±0.004$$$ ppm/mm.
Patients study
QSM was successfully reconstructed in all 10 patient cases. Figure 4 shows QSM of the STN in the axial and coronal planes. In all cases, high contrast between STN and white matter, and the ability to distinguish it from the SN were achieved. The measured dimensions were $$$(3.2±0.2)\times(5.6±0.6)\times(12.5±1.7)$$$ mm3 for the left and $$$(3.1±0.2)\times(5.5±0.5)\times(11.8±1.8)$$$ mm3 for the right nucleus. The average QSM STN gradients were $$$-0.026±0.009$$$ ppm/mm and $$$-0.029±0.008$$$ ppm/mm for the left and right nuclei, respectively.
Discussion
QSM can be used to overcome inadequacies of relaxation-based contrasts in T2w MRI. The comparative analyses of QSM and T2w presented here suggest that susceptibility mapping is better suited for high resolution preoperative STN imaging. QSM can offer better visualization of the iron distribution within the STN, providing identification of optimal DBS targeting sites. The qualitative and quantitative results suggest that QSM – unlike T2w – benefits from high resolution acquisition, which makes it valuable for accurate segmentation of the target areas without the need for image interpolation.Conclusion
For 3T MRI, sub-millimeter QSM provides accurate delineation of the anatomical STN features for DBS targeting.Acknowledgements
This investigation was supported in part by grants R01CA178007-05, R01CA178007-04, R21EB024366-01, R01NS090464-02, R01NS095562-02, R01NS095562-01A1, S10OD021782-01 from National Institutes of Health.References
[1] Wodarg F. et al, Stimulation site within the MRI-defined STN predicts postoperative motor outcome. Movement Disorders 27:874-879, 2012
[2] Akram H. et al, Subthalamic deep brain stimulation sweet spots and hyperdirect cortical connectivity in Parkinson's disease. Neuroimage 158:332-345, 2017
[3] Bronstein JM. et al, Deep brain stimulation for Parkinson disease: an expert consensus and review of key issues. Arch Neurol 68:165, 2011
[4] Liu T. et al, Improved Subthalamic Nucleus Depiction with Quantitative Susceptibility Mapping. Radiology 269:216-223, 2013
[5] Schafer A. et al, Direct visualization of the subthalamic nucleus and its iron distribution using high-resolution susceptibility mapping. Human Brain Mapping 33:2831-2842, 2012
Figures