2211
Improved depiction of subthalamic nucleus and globus pallidus internus with optimized high-resolution quantitative susceptibility mapping at 7 Tesla1State Key Laboratory of Brain and Cognitive Science, Beijing MR Center for Brain Research, Institute of Biophysics, Chinese Academy of Sciences, Beijing, China, 2University of Chinese Academy of Sciences, Beijing, China, 3Laboratory of Functional MRI Technology (LOFT), Stevens Neuroimaging and Informatics Institute, Keck School of Medicine, University of Southern California, Los Angeles, CA, United States, 4Shandong Medical Imaging Research Institute, School of Medicine, Shandong University, Jinan, China, 5Siemens Shenzhen Magnetic Resonance Ltd., Shenzhen, China
Synopsis
Quantitative susceptibility mapping (QSM) shows a potential to image subthalamic nucleus (STN) and globus pallidus internus (GPi). However, the image quality of QSM is dependent on the selection of regularization parameter during reconstruction. Here we proposed an approach to determine the optimal regularization parameter for imaging the sub-cortical nuclei at different spatial resolution and field strengths. Optimized QSM images were further compared with the other susceptibility weighted images for visualization of STN and GPi at 3T and 7T. Our results suggest that optimized 7T QSM with spatial resolution of 0.35x0.35x1.0mm3 provides better delineation of STN and GPi.
Introduction
Deep brain stimulation (DBS) is commonly performed surgical treatment of Parkinson’s disease 1. The successful DBS procedure is critically dependent on the accurate targeting of subthalamic nucleus (STN) and globus pallidus internus (GPi). Quantitative susceptibility mapping (QSM) shows potential to image STN and GPi. However, the image quality of QSM lies on the selection of regularization parameter during reconstruction. In this study, we aim to determine the optimal regularization parameter in QSM reconstruction at different spatial resolutions and magnetic field strengths for visualization of GPi and STN. We further compare the performance of QSM with the other susceptibility-weighted imaging methods (R2* mapping, T2* weighed, susceptibility weighted mapping (SWI), and phase imaging) at both 3T and 7T.Method
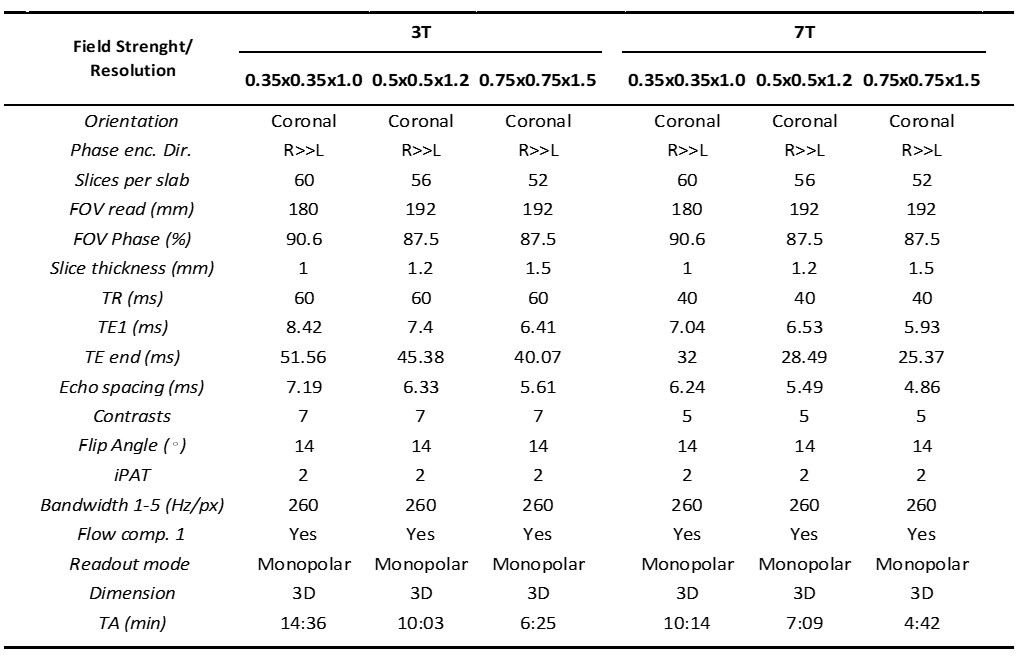
Three-dimensional multi-echo GRE images at three high-spatial resolutions were acquired on 8 healthy volunteers on both Siemens 3T and 7T scanners. Imaging parameters are listed in Table 1. QSM was reconstructed with the solution (Equation 1) proposed by Liu et al, 2013 using MEDI 2:
$$ \chi^*=argmin _\chi\lambda\parallel W\left[\exp(iD\chi)-\exp(i\mathbf {B}_L)\right]\parallel_2^2+\parallel MG\chi\parallel_1 \ \ \ \ \ (1)$$
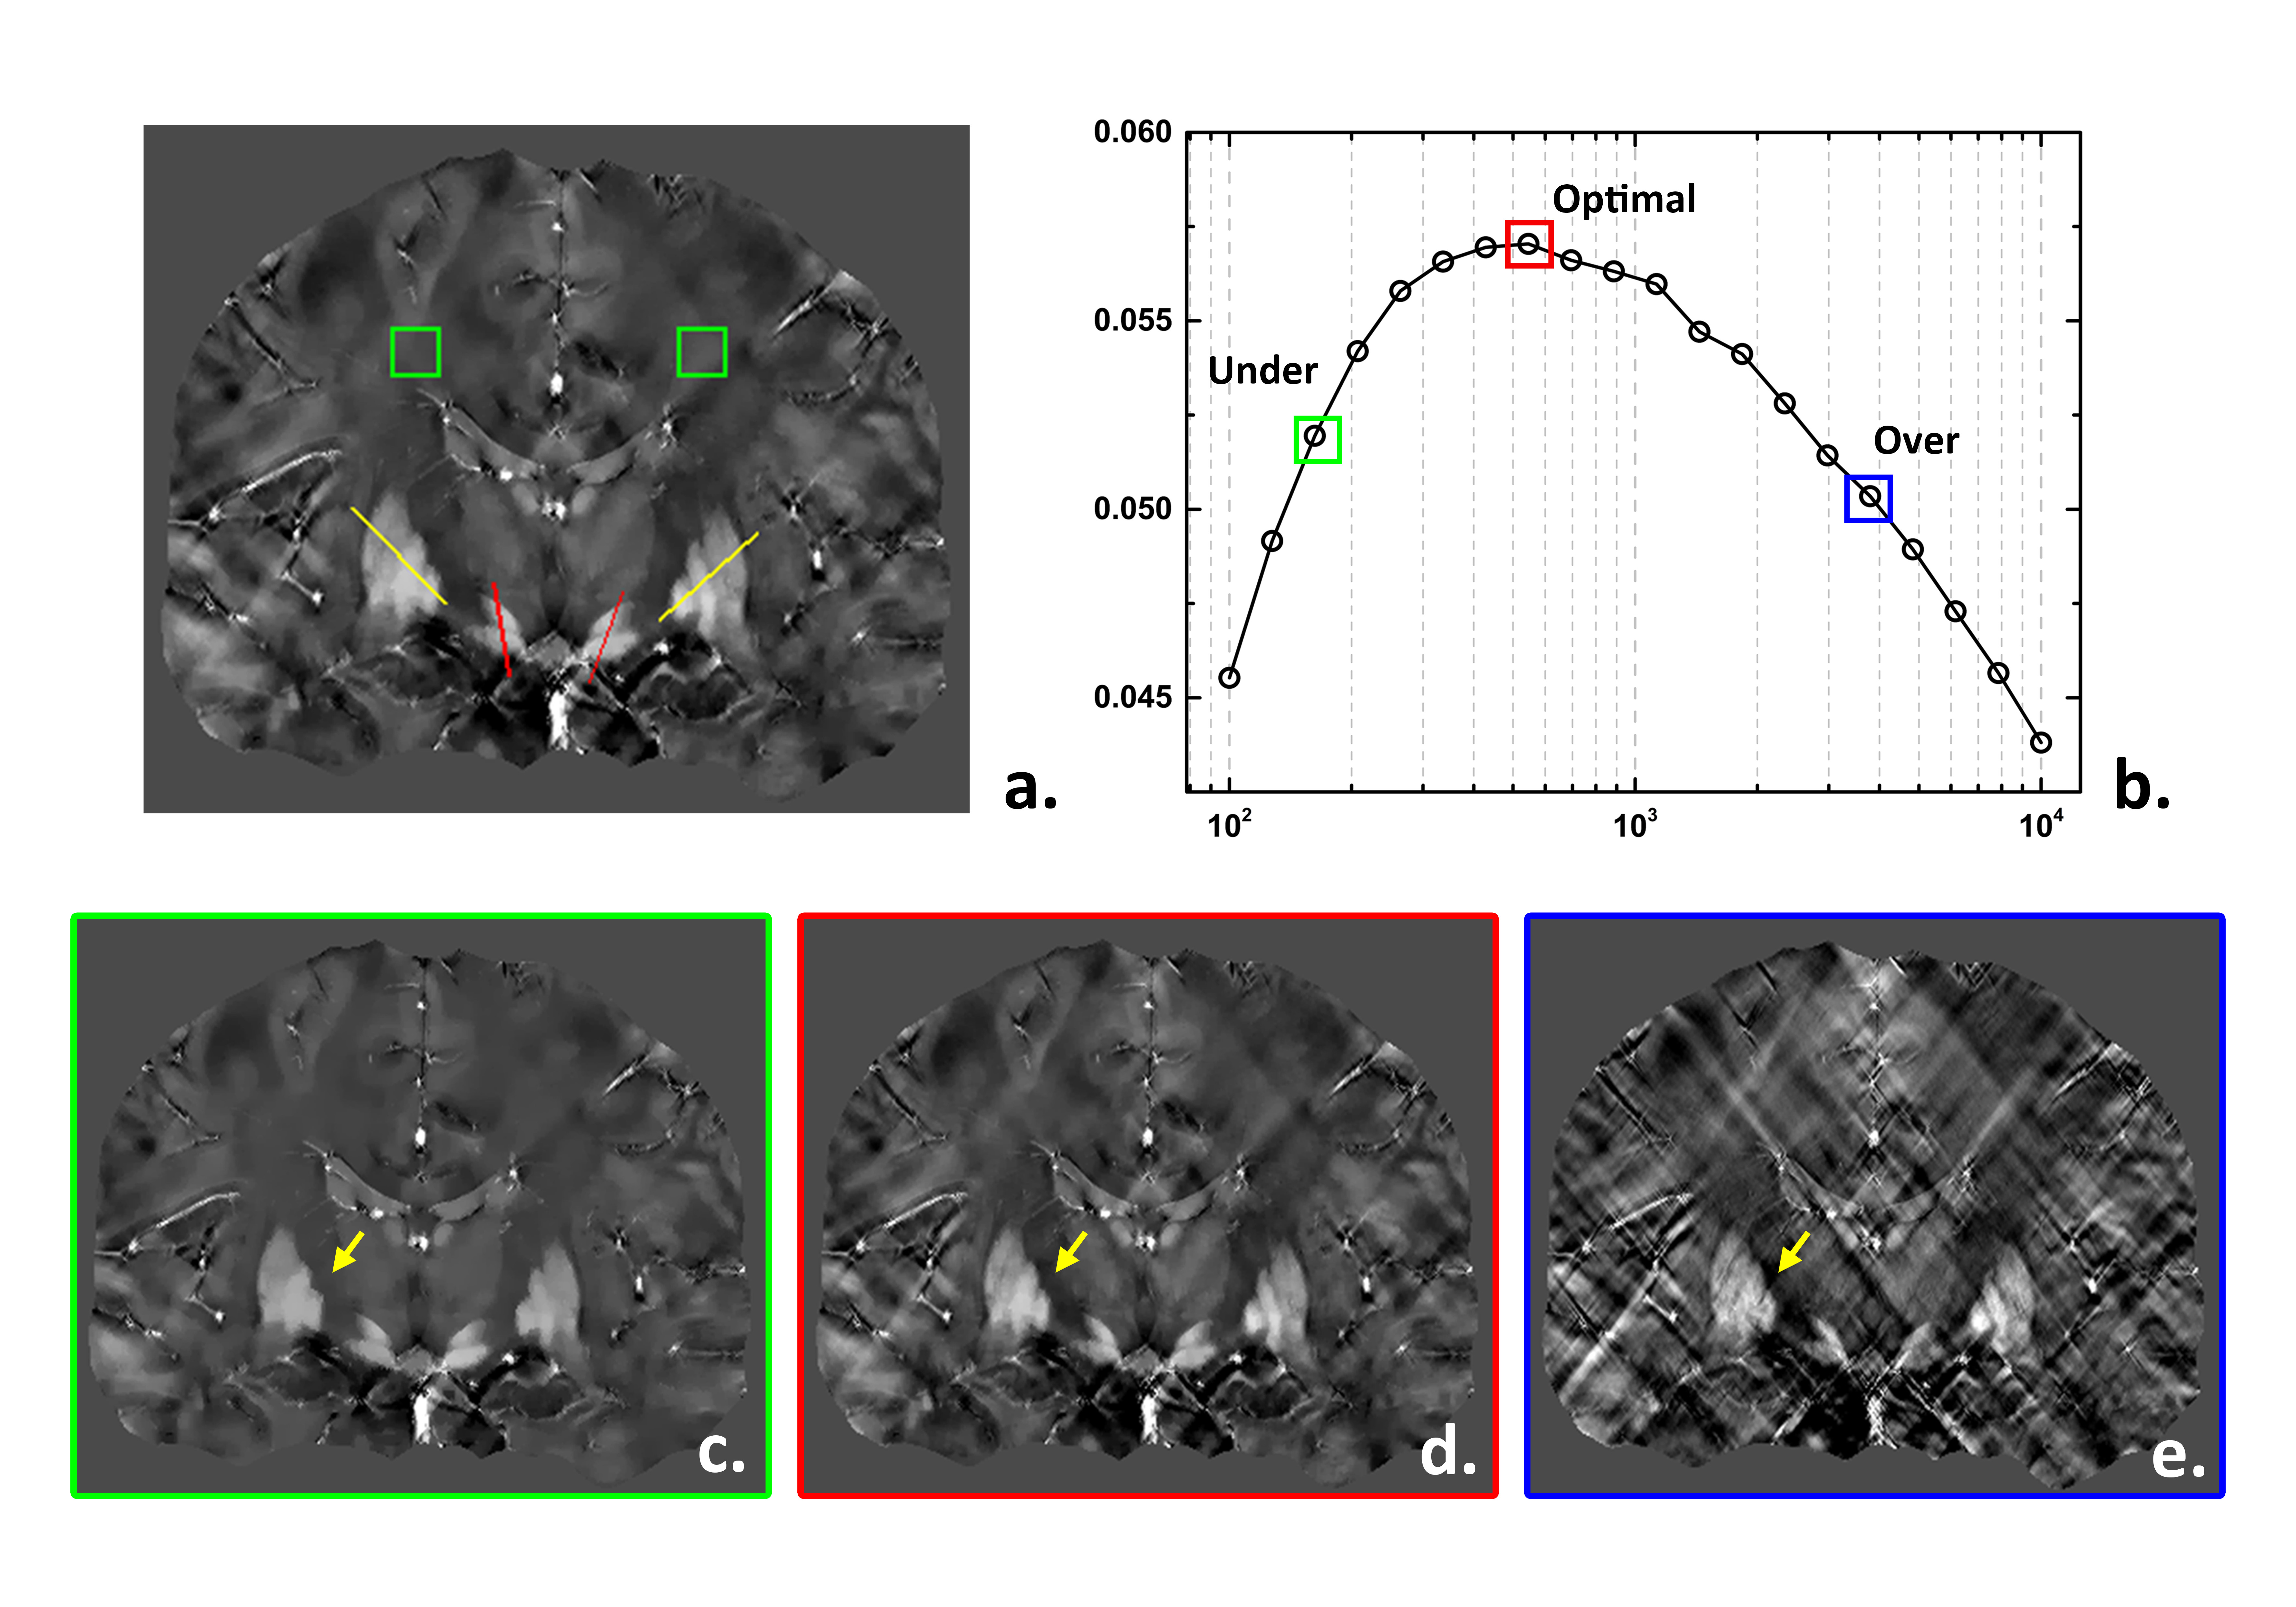
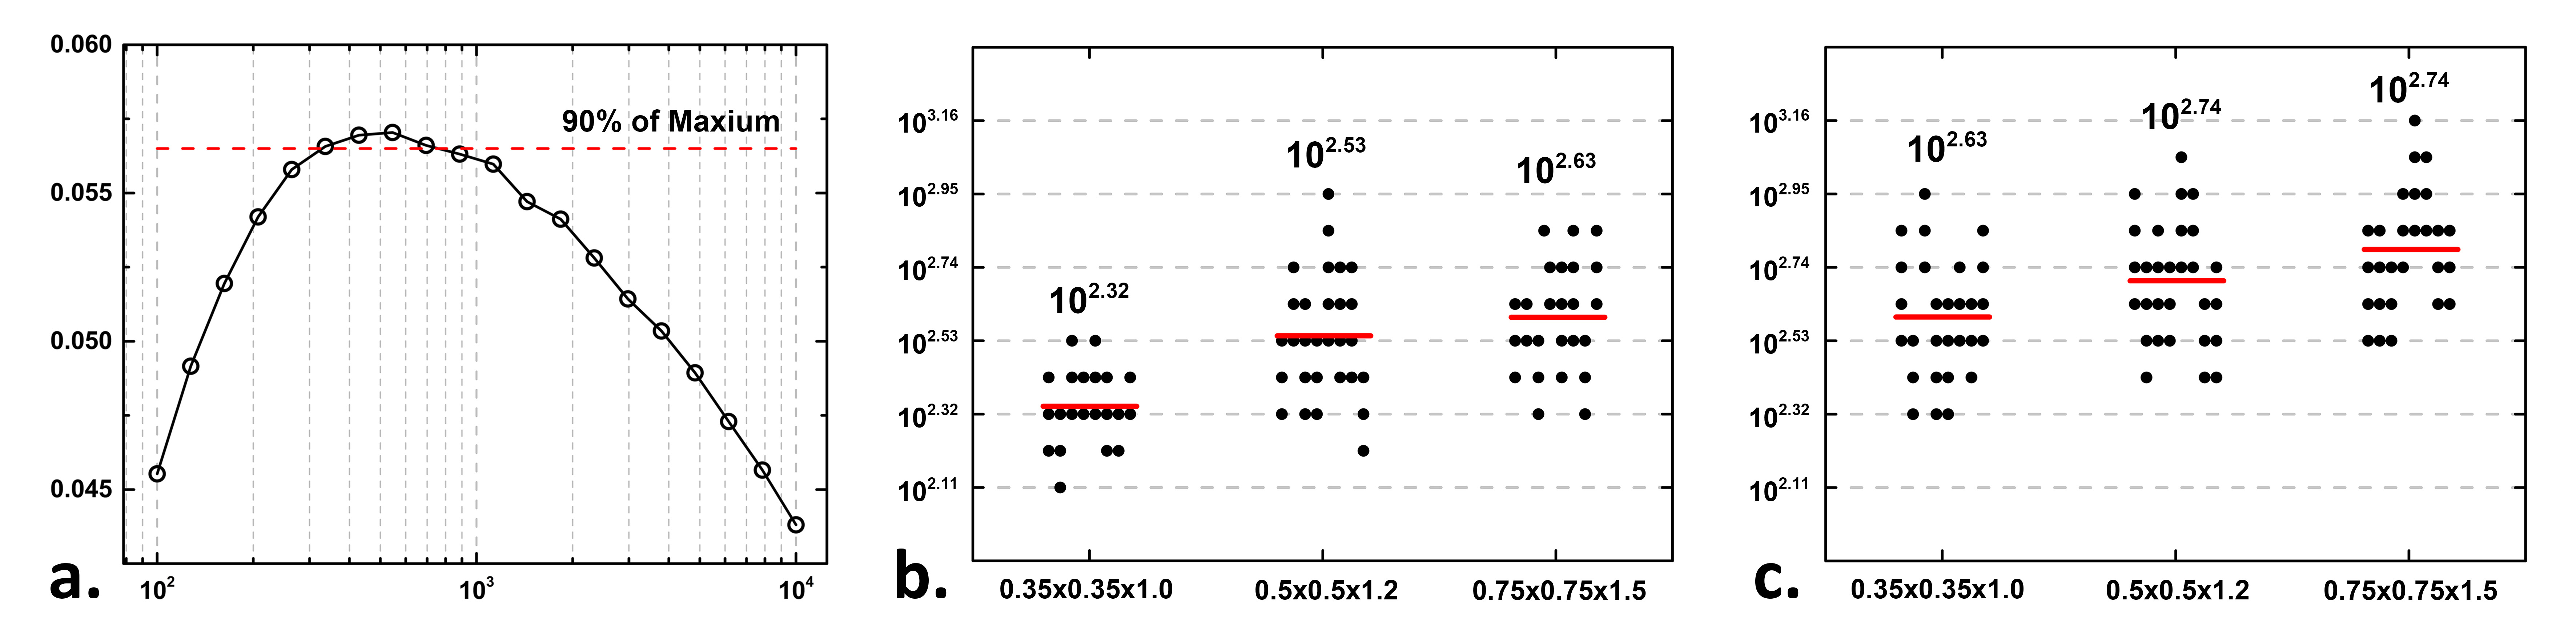
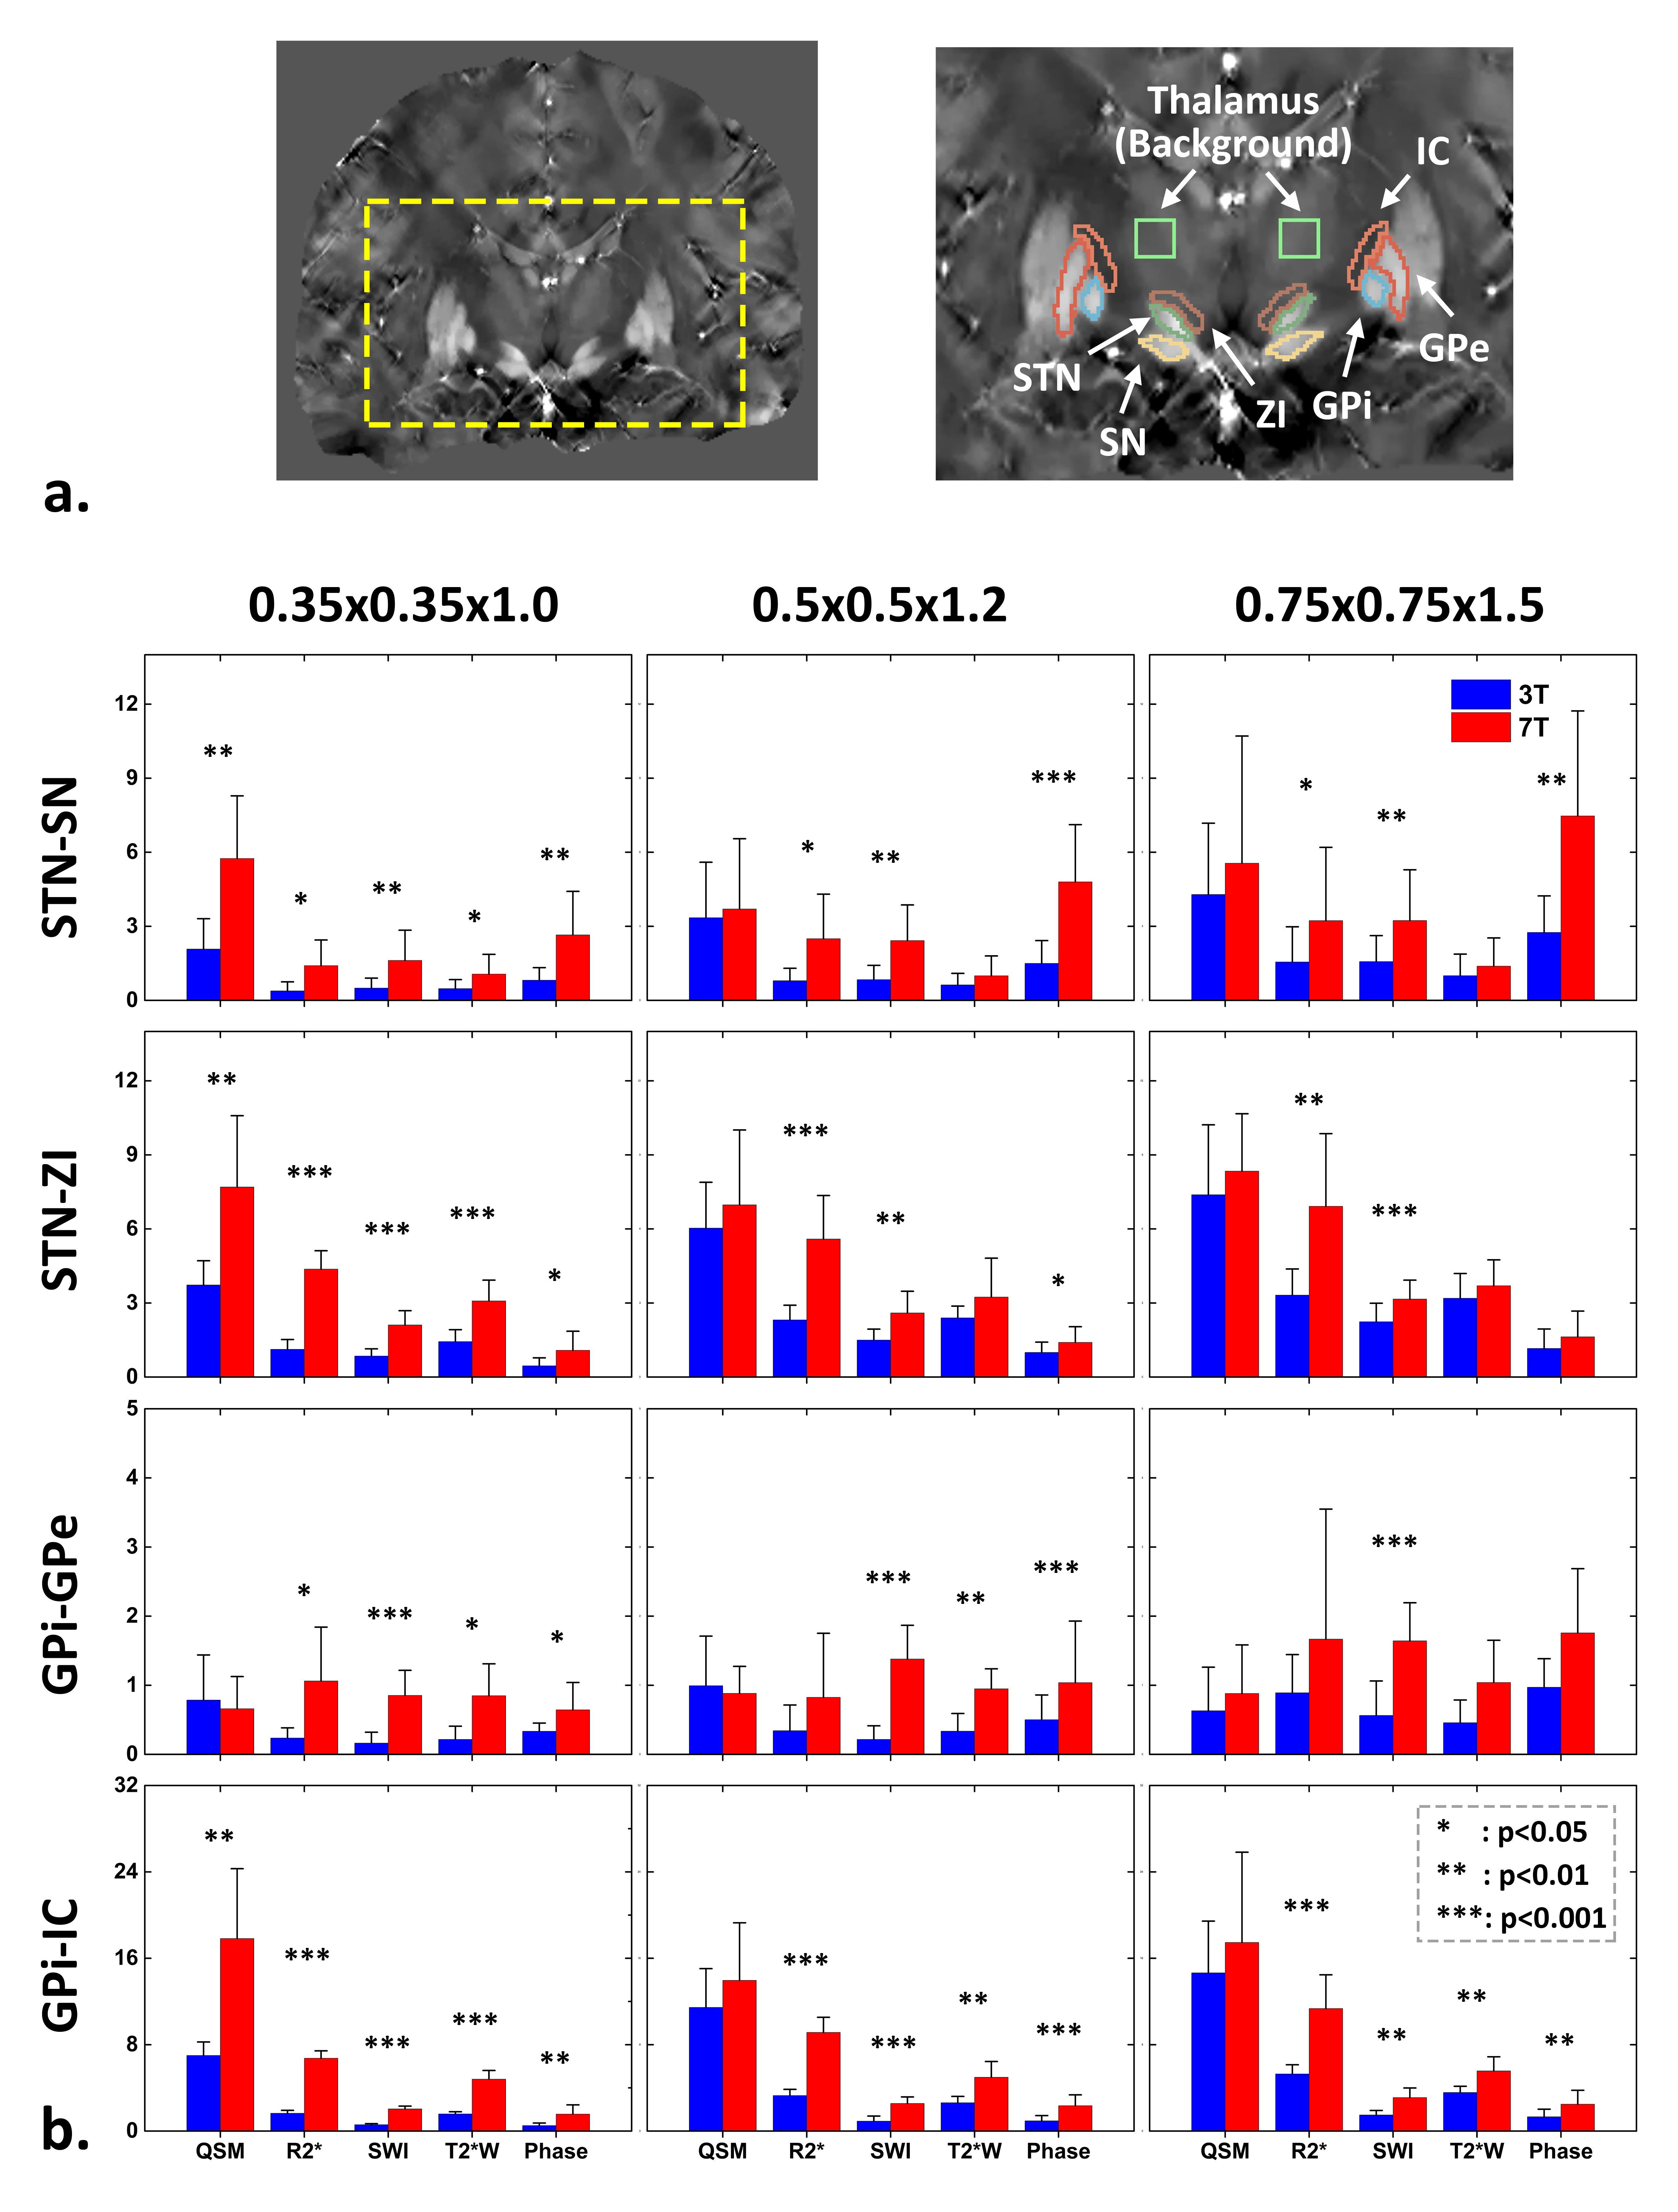
where λ is the Lagrange parameter that determines the data fidelity term (first term) and smoothness term (second term). In each data set, QSM was reconstructed with different values of λ which varied exponentially from 102 to 104 with 20 steps in total. Four lines were drawn across GPi and STN in the reconstructed QSM images, as shown in Figure 1a. The difference between the geometric mean of signal intensity along the four lines and the standard deviation of the background region was defined as DQSM, which was used to calculate the optimal λ. DQSM as a function of λ was obtained. Optimal λ values were given as the values at which DQSM is more than 90% of its maximum (Figure 2a). A group of optimal λ values was obtained cross subjects at each spatial resolution and field strength. A single λ was picked as optimal value when its logarithm was most closed to the logarithmic mean of the group of λ values in each data set. QSM images with optimal λ were chosen for following analysis. R2*, SWI 3, T2*-weighted, and phase images were generated from the same data set. Quantitative comparison among these methods was implemented by calculating the contrast to noise ratios (CNR) of STN-SN, STN-zona incerta (ZI), GPi-external globus pallidus (GPe) and GPi-internal capsule (IC).
Results
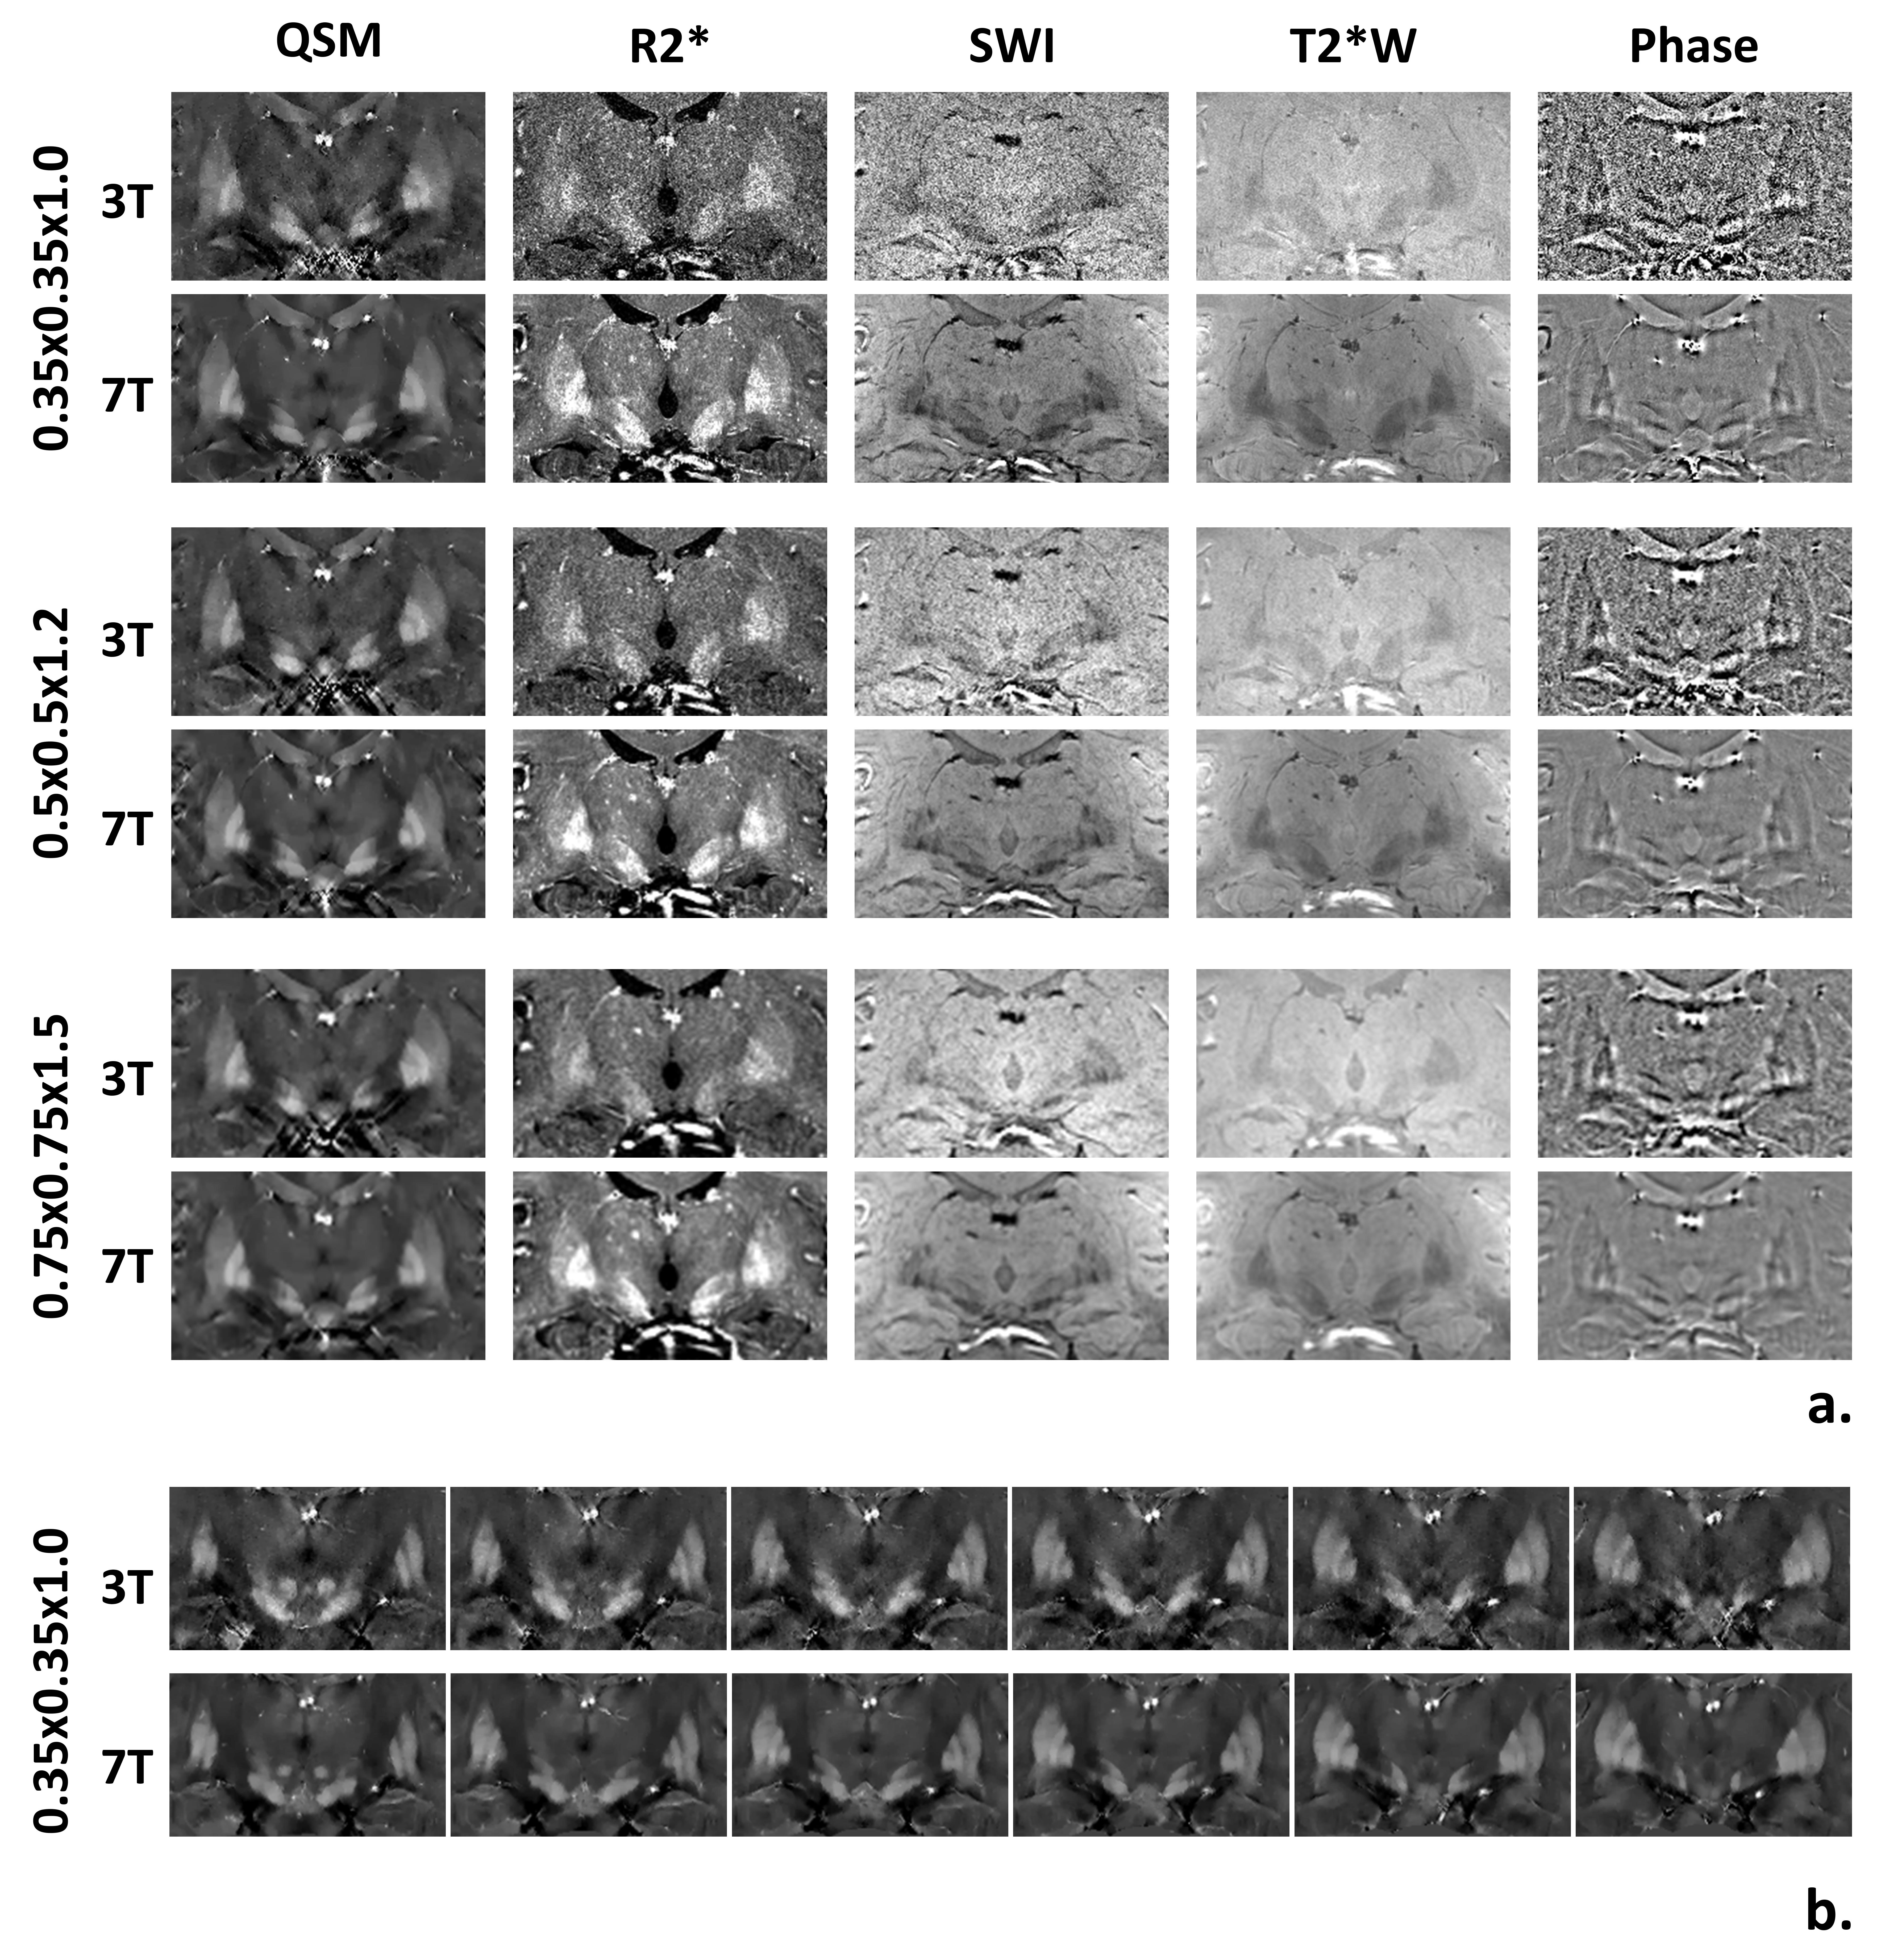
QSM images were successfully reconstructed with different values of λ at each resolution and field strength. Figure 1b shows an example of the plot of DQSM as a function of λ. In this curve, λ at the ascending portion yields smoother image results (Figure 1c), whereas λ at descending portion yields severe dipole artifacts. The optimal λ is obtained at the peak, which produces the satisfactory image quality with clear boundary between nuclear layers (Figure 1b). Figure 2 shows the distribution of optimal λ values calculated from all the subjects. Single optimal λ was determined as labeled in red in Figure 2b&c. Note that the optimal value of λ decreases with spatial resolution at both 3T and 7T. Figure 3 show comparison of optimized QSM with the other image methods by visual inspection. Overall, QSM shows good image quality and better delineation of nuclei compared to the other imaging methods at both 3T and 7T. Furthermore, 7T QSM maintains good image quality across spatial resolutions, whereas increase of noise level presents in 3T QSM with spatial resolution of 0.35x0.35x1mm3. One can appreciate the better depiction of STN and GPi across slices at 7T (Figure 3c). The comparison of CNR is shown in Figure 4. 7T offers overall higher CNR than 3T across imaging methods. Compared to the other methods, QSM shows higher CNR in all ROIs except GPi-GPe. Significantly higher CNR was obtained at 7T than that at 3T at super-high spatial resolution (0.35x0.35x1mm3), which is constant with the visual inspection (Figure 3).Discussion and Conclusion
Our works demonstrated a new strategy to optimize regularization parameter in QSM reconstruction for better depiction of sub-cortical nuclei. Optimal regularization parameter varies with spatial resolution and field strength. Improved delineation with sharper boundary between layers in STN and GPi was obtained with optimized QSM compared to the other susceptibility-weighted imaging methods at both 3T and 7T. Good mage quality is preserved with increase of spatial resolution in 7T QSM, due to the increase of inherent SNR. Therefore, optimized QSM at 7T allows good delineation of DBS nuclei even at super-high spatial resolution, which may become promising tool for DBS nucleus preoperative localization.Acknowledgements
This work was supported in part by Chinese MOST (Ministry of Science and Technology of China) “973” grant (2015CB351701), NSFC (National Natural Science Foundation of China) grants (91132302).References
1. Perlmutter JS, Mink JW. DEEP BRAIN STIMULATION. Annual Review of Neuroscience 2006;29(1):229-257.
2. Liu T, Wisnieff C, Lou M, Chen W, Spincemaille P, Wang Y. Nonlinear formulation of the magnetic field to source relationship for robust quantitative susceptibility mapping. Magnetic Resonance in Medicine 2013;69(2):467-476.
3. Haacke EM, Xu Y, Cheng YC, Reichenbach JR. Susceptibility weighted imaging (SWI). Magnetic resonance in medicine : official journal of the Society of Magnetic Resonance in Medicine / Society of Magnetic Resonance in Medicine 2004;52(3):612-618.
Figures