2210
Measurement of Iron Concentration in Deep Gray Matter Nuclei over the Lifespan Using Quantitative Susceptibility Mapping1Shanghai Key Laboratory of Magnetic Resonance and Department of Physics, East China Normal University, Shangha, China, 2Department of Radiology, Weill Medical College of Cornell University, New York, New York, NY, United States, 3Shanghai Mental Health Center, Shanghai Jiao Tong University School of Medicine, Shanghai, China, 4MR Collaboration NE Asia, Siemens Healthcare, Shanghai, China
Synopsis
Histological in vitro analysis has demonstrated that iron accumulation rates in various gray matter nuclei are different throughout an individual’s lifetime. QSM provides excellent contrast of iron-rich deep nuclei to quantify iron in the brains. In this study, we investigated the linear and nonlinear correlation of magnetic susceptibility in the deep gray matter nuclei as a function of ageing using QSM. Compared with the published studies, the nonlinear analysis results showed the differential developmental trajectories of magnetic susceptibility in the deep gray matter nuclei over the lifespan.
Purpose
Over the lifespan, progressive accumulation of iron has been well documented in many brain regions1. The objective of this study was to assess the changes of regional susceptibility in the deep gray nuclei by examining the ageing process from 14 to 70 years old and to produce a quantitative magnetic susceptibility reference for each deep gray matter nucleus in difference age range to study the presence of abnormally high iron content.Materials and Methods
A total of 240 normal subjects ranging from 14 to 70 years old (109 males and 131 females, 43.7±15.6 years old) were measured on a clinical 3T MR imaging scanner (Magnetom Trio Tim, Siemens Healthcare, Erlangen, Germany) with a 12 channel matrix coil. The QSM images were obtained from a three dimensional (3D) spoiled multi-echo gradient-echo (GRE) sequence with the following parameters: TR = 60ms, TE1 = 6.8ms, ΔTE = 6.8ms, echoes number = 8, flip angle = 15˚, FOV = 240*180 mm2, in-plane resolution=0.625*0.625mm2, slice thickness= 2mm, number of slices = 96. Conventional MR images, including T1-weighted, T2-weighted and T2-weighted fluid-attenuated inversion recovery (FLAIR) were also acquired. QSM maps were reconstructed from the phase data using the Morphology Enabled Dipole Inversion (MEDI) algorithm2. Region of interest (ROIs) of the deep gray matter (GM) nuclei were drawn manually. The ROIs included the bilateral head of caudate nucleus (CN), putamen (PUT), globus pallidus (GP), substantia nigra (SN), red nucleus (RN) and the dentate nucleus (DN). The ROIs were drawn on all sections where the deep nucleus was visible. The mean susceptibility values in the ROIs were obtained to evaluate group differences between males and females using a two-tailed t-test, and to perform linear and nonlinear regression analysis. Microsoft Excel 2016 and SPSS statistical software were used to conduct all statistical analyses.Results
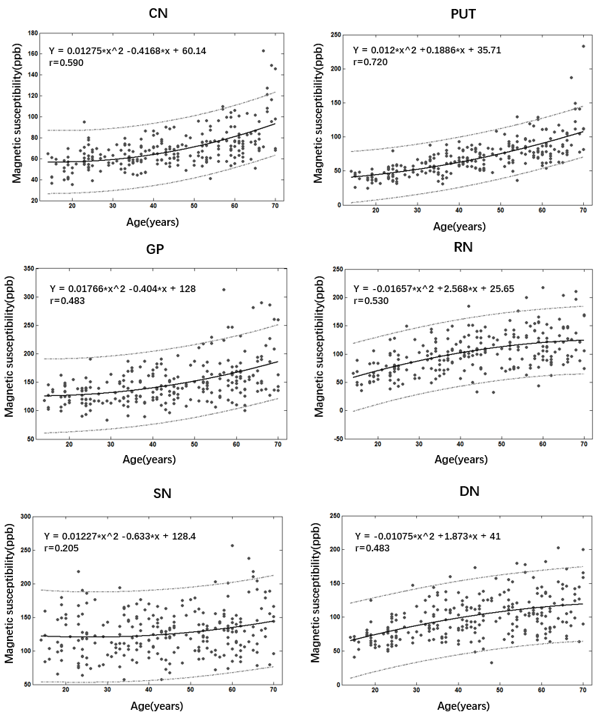
The mean susceptibility value showed a significant difference between males and females (p = 0.015) only in the RN, where females had lower susceptibility values compared to males. The other ROIs showed no significant sex variations in susceptibility. Figure 1 presents QSM images of five subjects at different ages. The magnetic susceptibility in the deep gray nuclei showed increase with age. Figure 2 shows the susceptibility changes in the GM nuclei as a linear function of age. In the CN, PUT and RN, the magnetic susceptibility appeared to be strong linearly correlated with age (r >0.5, P < 0.05). The susceptibility distributions across ages were quite scattered in the SN with limited age dependency (r < 0.25). According to the slopes of linear analysis, the susceptibility in the PUT showed the most rapid increase as a function of age, and then followed by the RN, GP, DN, CN and SN. Figure 4 plots the results of the curvilinear fits of magnetic susceptibility in the different ROIs versus age. Magnetic susceptibility of these GM regions demonstrated a monotonic increase with variable rate constants. As the age increased, both RN and DN showed a linear rise of mean susceptibility roughly until the 5th decade followed a slight leveling off. In the CN, PUT, GP and SN, however, susceptibility increases continuously well and the growth rate gets greater gradually over the lifespan. Table 1 summarizes the detailed statistics of mean magnetic susceptibility at difference age range and 95% confidence intervals in each deep GM nuclei.Discussion and conclusions
In this study, we assessed magnetic susceptibility values in various deep gray nucleus as linear and nonlinear function of age ranging 14 to 70 years old with large size of sampling. Compared with the published studies3-5, the nonlinear analysis results showed the different developmental trajectories of magnetic susceptibility in the deep gray matter nuclei over the lifespan, which may be due to different QSM reconstruction method and criteria for defining the ROIs in this study. In summary, the results of linear and nonlinear regression analysis shown a positive correlation between the magnetic susceptibility and age. The statistical analysis produced a quantitative magnetic susceptibility reference for each deep gray matter nucleus in difference age range to study the presence of abnormally high iron content.Acknowledgements
No acknowledgement found.References
1. Hallgren B, Sourander P. The effect of age on the non-haem in iron in the human brain. Journal of Neurochemistry,1958; 3:41–51.
2. Liu T, Surapaneni K, Lou M, et al. Cerebral microbleeds: burden assessment by using quantitative susceptibility mapping. Radiology, 2012; 262: 269-278.
3. Persson N, Wu J, Zhang Q, et al. Age and sex related differences in subcortical brain iron concentrations among healthy adults. Neuroimage, 2015;122: 385-398.
4. Li W, Wu B, Batrachenko A, et al. Differential developmental trajectories of magnetic susceptibility in human brain gray and white matter over the lifespan. Human Brain Mapping, 2014; 35:2698-2713.
5. Liu M, Liu S, Ghassaban K, et al. Assessing global and regional iron content in deep gray matter as a function of age using susceptibility mapping. Journal of Magnetic Resonance Imaging, 2015; 44:59-71.
Figures