2207
Applications of magnetic susceptibility source separation: multiple sclerosis lesions and line of Gennari1Department of Electrical and Computer Engineering, Seoul National University, Seoul, Republic of Korea, 2Department of Radiology, Seoul St. Mary’s Hospital, College of Medicine, The Catholic University of Korea, Seoul, Republic of Korea, 3Department of Neurology, Seoul St. Mary’s Hospital, College of Medicine, The Catholic University of Korea, Seoul, Republic of Korea, 4Division of Biomedical Engineering, Hankuk University of Foreign Studies, Yongin, Republic of Korea, 5Division of Cerebral Integration, National Institute for Physiological Sciences, Okazaki, Japan
Synopsis
Magnetic susceptibility source separation is a recently proposed technique that generates positive and negative susceptibility maps corresponding to iron and myelin distributions in the brain. In this study, iron accumulation and myelin degradation in a few typical types of multiple sclerosis lesions were visualized using the magnetic susceptibility source separation method. Additionally, the well-known co-localization of iron and myelin in the Gennari line was demonstrated in an ex-vivo brain sample.
Purpose
In this study, clinical and neuroscientific applications of magnetic susceptibility source separation are explored. Conventional quantitative susceptibility mapping (QSM) gives a voxel-averaged susceptibility and, therefore, it is difficult to interpret source composition when a few susceptibility sources co-exist in the voxel. Recently, a susceptibility mapping technique utilizing signal relaxation information was proposed to separate positive and negative susceptibility sources. This method generates spatial distributions of iron and myelin in the brain. In this work, we apply the method to visualize a few typical types of multiple sclerosis (MS) lesions. Additionally, well-known iron and myelin co-localization at the line of Gennari is delineated.Methods
[MS patient scan] Three MS patients were scanned at 3T. For lesion assessment, FLAIR, T2-weighted, and T1-weighted images before and after gadolinium injection (T1WI+Gd) were obtained. For frequency and R2* estimation, 3D multi-echo gradient-echo data were acquired with the following parameters: FOV = 216×216×144 mm3, voxel size = 0.5×0.5×2 mm3, TR = 42 ms, TE = 5.8 to 36.7 ms with echo spacing of 6.2 ms, and flip angle = 17°. For the frequency estimation, iHARPERELLA3 was used. For R2* mapping, the multi-echo magnitude data were fitted to a mono-exponential decay function.
For R2 estimation, 2D multi-echo spin-echo data were acquired with the following parameters: FOV = 216×216 mm2, voxel size = 0.5×0.5 mm2, slice thickness = 2 mm, number of slices = 14, TR = 1800 ms, and TE = 10 to 90 ms with echo spacing of 10 ms. R2 values were estimated from the multi-echo spin-echo data using stimulated echo and slice profile correction4.
R2’ was calculated by a simple subtraction of R2 from R2*.
[Ex-vivo scan] A section of a fixed ex-vivo human brain sample including primary visual cortex was scanned at 7T.
3D multi-echo gradient-echo data were acquired with the following parameters: FOV = 77×77×64 mm3, voxel size = 0.3×0.3×1 mm3, TR = 400 ms, TE = 4.4 to 36.9 ms with echo spacing of 6.5 ms, and flip angle = 70°. 3D multi-echo spin-echo data were acquired with the following parameters: the same FOV and resolution with gradient-echo acquisition, TR = 400 ms, and TE = 11 to 44 ms with echo spacing of 11 ms. The spin-echo scan was repeated four times and the data were averaged to increase the signal-to-noise ratio.
Frequency shift and R2’ estimation steps were the same as those in MS patient data processing.
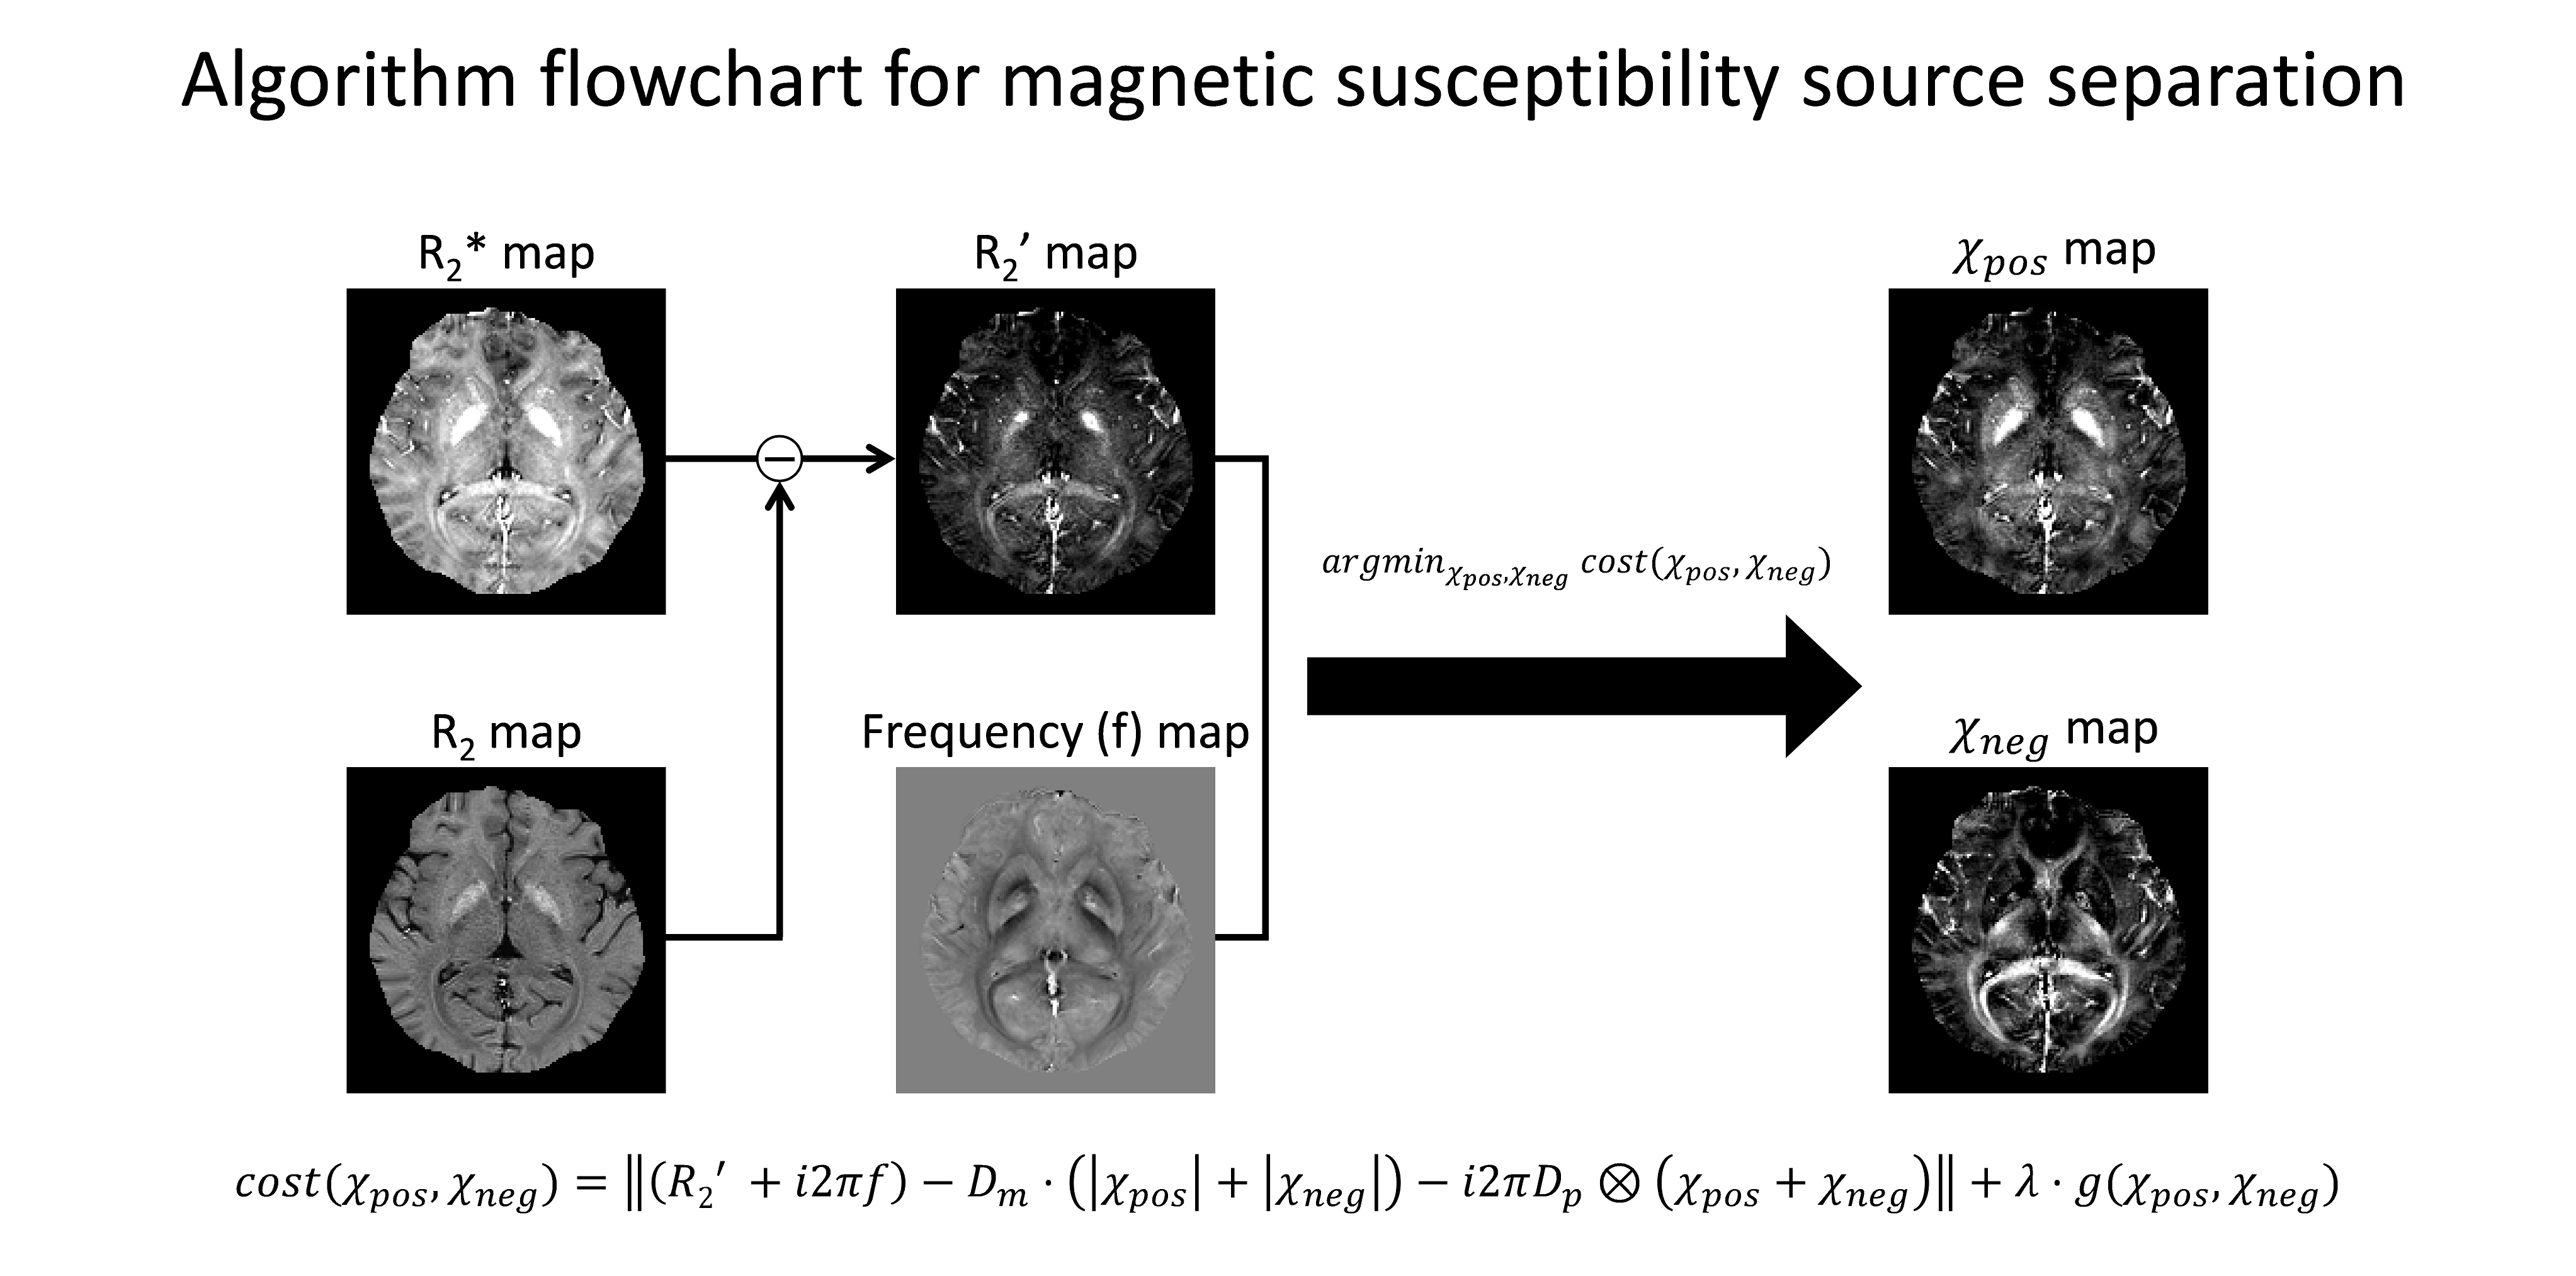
[Magnetic susceptibility source separation] The magnetic susceptibility source separation algorithm utilizes R2’ information with frequency shift data for estimating positive and negative susceptibilities (Fig. 1). The algorithm is summarized as follows1: $$argmin_{\chi_{pos},\:\chi_{neg}}\:|(R_{2}^{\:*}+i2{\pi}f)-D_{m}*(|\chi_{pos}|+|\chi_{neg}|)-i2\pi{D_{p}}*(\chi_{pos}+\chi_{neg})|+{\lambda}{\cdot}g(\chi_{pos},\:\chi_{neg}){\qquad}[Eq.\:1]$$
where f is frequency shift from magnetic field perturbation, Dm is a magnitude decay kernel, χpos and χneg are positive and negative susceptibility respectively, and Dp is a dipole kernel, g(χ) is a regularization term. This method was applied for MS patient and ex-vivo sample data.
Results
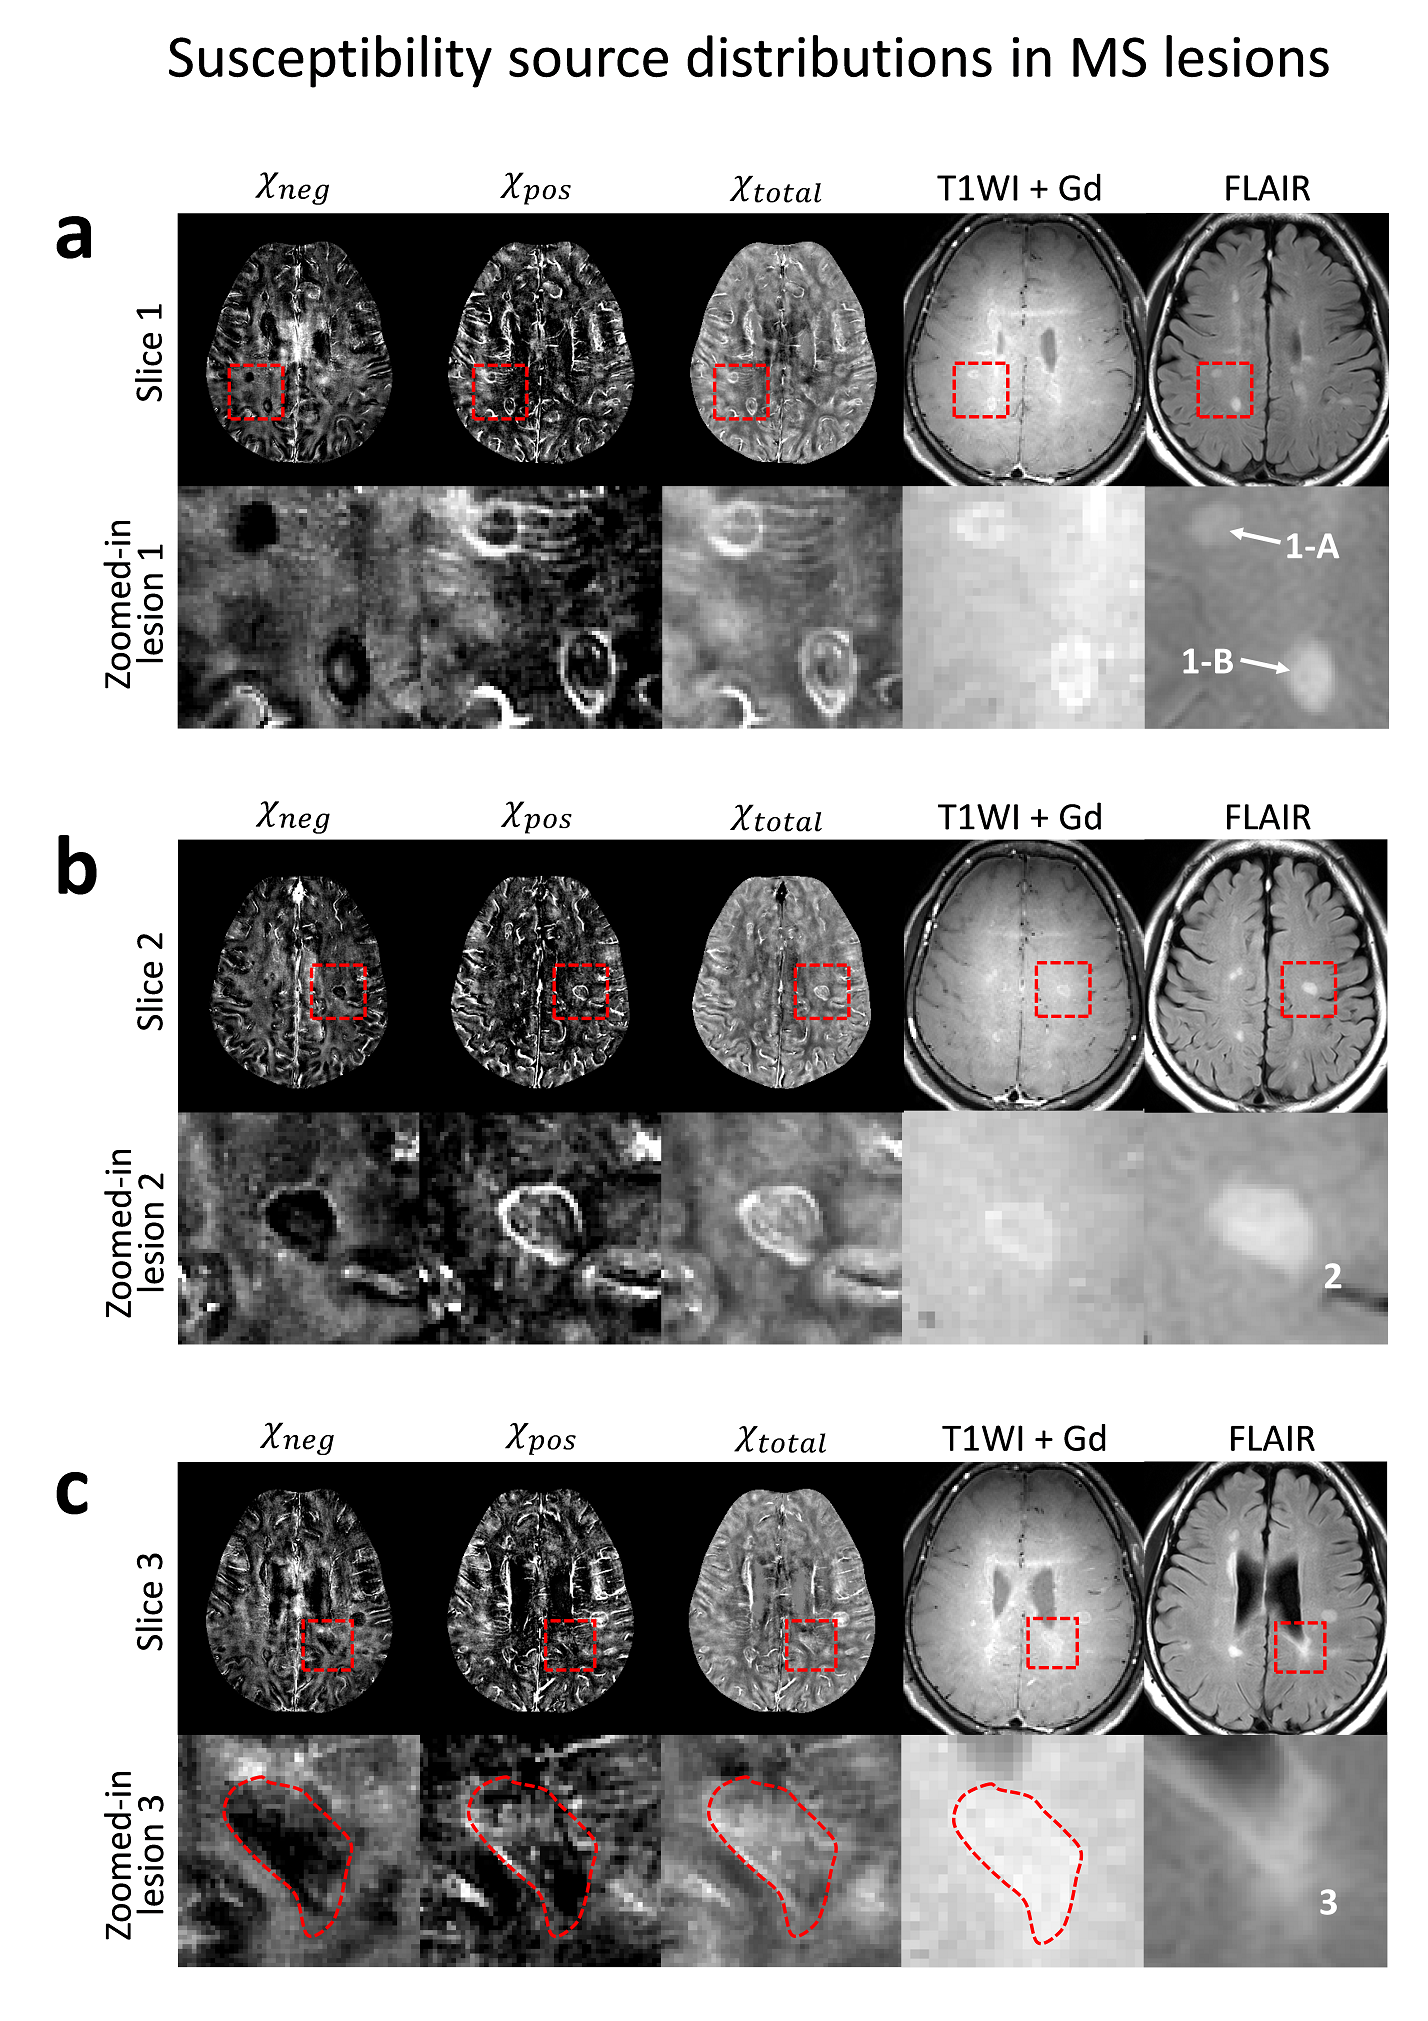
Three different slices containing typical MS lesions are displayed in Fig. 2. In Fig. 2a, there are two interesting lesions (1-A and 1-B in zoomed-in FLAIR image) that show rim-shape source accumulation in the positive susceptibility map. This observation corresponds to a well-known iron accumulation pattern in MS lesions5. In the negative susceptibility map, lesion 1-A shows dark void contrast representing myelin degradation. Slightly brighter contrast at the center of lesion 1-B in the negative susceptibility map may indicate re-myelination. Feeding veins near the lesion 1-A are observed in the positive susceptibility map. Lesion 2 shown in Fig. 2b also reveals iron-rim and myelin-void patterns observed in lesion 1-A. Lesion 3, which is located in the vicinity of the cerebral spinal fluid boundary, also shows myelin degradation (Fig. 2c). This lesion, however, does not reveal the iron-rim sign in the positive susceptibility map, suggesting a different lesion type.
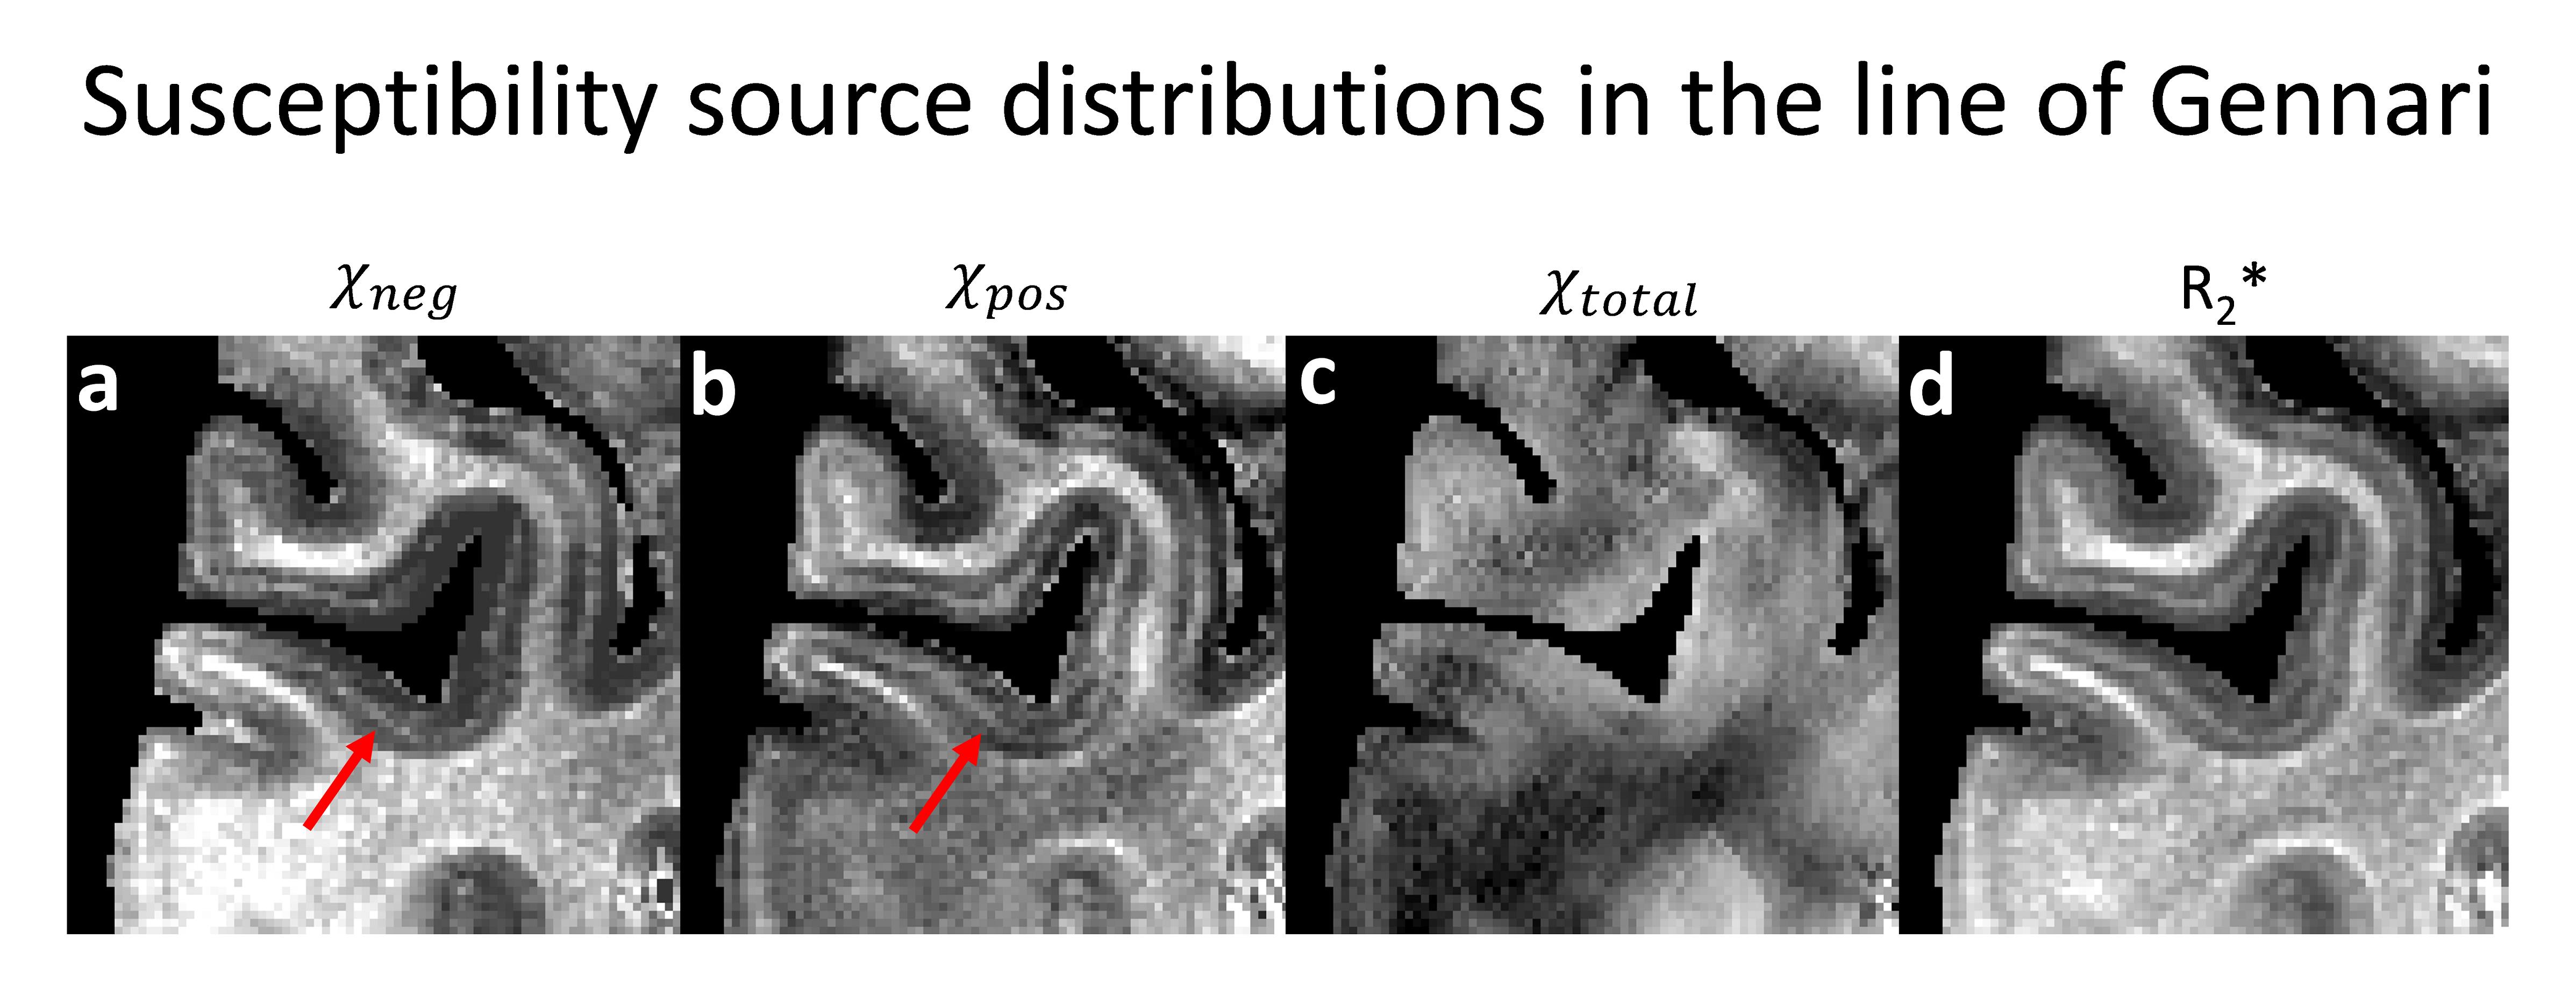
Figure 3 shows the positive and negative susceptibility maps of the primary visual cortex that contains the line of Gennari. The structure is known to have co-accumulation of iron and myelin (see Fig. 2 in Fukunaga et. al.6). The positive and negative susceptibility maps show increased susceptibility lines in the middle of cortex, indicating the Gennari line. This appearence is in agreement with the histology results in the previous study6.
Conclusion
The positive and negative susceptibility maps from magnetic susceptibility source separation illustrate iron accumulation and myelin degradation patterns in MS lesions. The co-accumulation of iron and myelin in the line of Gennari is successfully visualized in the two susceptibility maps. This source separation technique may have important clinical and scientific applications.Acknowledgements
This work was supported by Creative-Pioneering Researchers Program through Seoul National University (SNU) and by the Brain Research Program through the National Research Foundation of Korea (NRF) funded by the Ministry of Science, ICT & Future Planning (NRF-2015M3C7A1031969).References
[1] Lee, J., Nam, YH., Choi, JY., Shin, H., Hwang, T., and Lee, J. (2017), Separating positive and negative susceptibility sources in QSM, Proc. Intl. Soc. Mag. Reson. Med., 25, 0751.
[2] Liu, T., Liu, J., De Rochefort, L., Spincemaille, P., Khalidov, I., Ledoux, J. R., & Wang, Y. (2011). Morphology enabled dipole inversion (MEDI) from a single‐angle acquisition: comparison with COSMOS in human brain imaging. Magnetic resonance in medicine, 66(3), 777-783.
[3] Li, W., Avram, A. V., Wu, B., Xiao, X., & Liu, C. (2014). Integrated Laplacian‐based phase unwrapping and background phase removal for quantitative susceptibility mapping. NMR in Biomedicine, 27(2), 219-227.
[4] McPhee, K. C., & Wilman, A. H. (2017). Transverse relaxation and flip angle mapping: evaluation of simultaneous and independent methods using multiple spin echoes. Magnetic resonance in medicine, 77(5), 2057-2065.
[5] Zhang, Y., Gauthier, S. A., Gupta, A., Comunale, J., Chia‐Yi Chiang, G., Zhou, D., ... & Wang, Y. (2016). Longitudinal change in magnetic susceptibility of new enhanced multiple sclerosis (MS) lesions measured on serial quantitative susceptibility mapping (QSM). Journal of Magnetic Resonance Imaging, 44(2), 426-432.
[6] Fukunaga, M., Li, T. Q., van Gelderen, P., de Zwart, J. A., Shmueli, K., Yao, B., ... & Leapman, R. D. (2010). Layer-specific variation of iron content in cerebral cortex as a source of MRI contrast. Proceedings of the National Academy of Sciences, 107(8), 3834-3839.
Figures