2196
Quantitative Susceptibility Mapping with Silent 3D Radial T2* Acquisition1Imago 7 Research Center, IRCCS Stella Maris, Pisa, Italy, 2ASL Europe, GE Healthcare, Munich, Germany
Synopsis
Recent implementations of radial Zero Echo Time (ZTE) techniques are capable of providing T2*-weighted signal. Quantitative Susceptibility Mapping (QSM) using such techniques might have several potential advantages, such as (i) robustness to head motion, flow artifacts and geometrical distortions, (ii) improved sampling efficiency, (iii) reduced acoustic noise, (iv) simultaneous acquisition of proton-density data. We assessed the QSMs obtained with two different silent radial techniques, and their accuracy was similar to that of QSM obtained with conventional scanning schemes, which encourages the development of ZTE-based techniques specifically tailored for efficient and silent QSM, to achieve important advantages in clinical applications.
Introduction
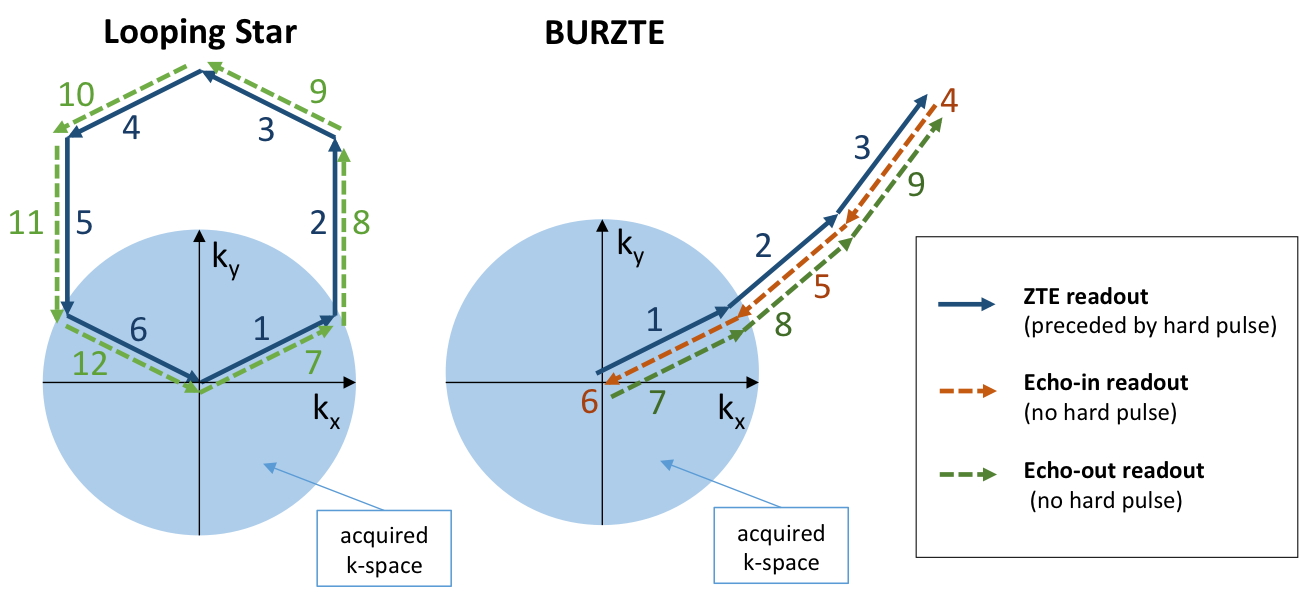
The magnetic susceptibility (χ) of tissues can be the hallmark of a host of different pathologies1,2. In Magnetic Resonance Imaging, Quantitative Susceptibility Mapping (QSM) typically relies on the T2*-weighted signal phase of conventional gradient-recalled echo (GRE) acquisitions3,4. Recent implementations of radial Zero Echo Time (ZTE) techniques, such as Looping Star5,6 and BURZTE (Figure 1), are also capable of providing T2*-weighted signal, besides the proton-density image based on the normal ZTE free-induction-decay signal: QSM using such radial techniques might have several potential advantages, such as (i) robustness to head motion, flow artifacts and geometrical distortions, (ii) improved sampling efficiency, (iii) reduced acoustic noise, and (iv) simultaneous acquisition of proton-density data.Methods
Two silent 3D radial T2* techniques were used: Looping Star5,6 and BURZTE, whose mechanisms of echo formation and k-space trajectories are illustrated in Figure 1. In brief, Looping Star consists of a block of standard ZTE encoding with multiple 3D radial spokes that describe a closed loop in k-space (depicted in blue). After the first loop, the same trajectory is followed again without excitation, so that such later loop forms gradient-echoes of the FID excited in the first loop (green). BURZTE scanning consists of a block of standard ZTE encoding with multiple 3D radial k-space spokes (blue), followed by blocks with no excitation and reversed direction (red). The first gradient trajectories are then repeated to collect echo-out signal (blue). To evaluate the signal phase information in T2*-weighted “silent” acquisitions, we compared the QSMs obtained with conventional 3D GRE multi-echo “SWAN” (TR=40ms; TE=13.00ms, 17.45ms, 21.90ms, 26.36ms, 30.81ms, 35.26ms; FA=15°; acquisition time=8’35’’), Looping Star (TR=2.634ms, TE=21.07ms, FA=3°; acquisition time=8’24’’ ) and BURZTE (TR=2ms, TE=12.15ms, 24.3ms, FA=3°; acquisition time=11’24’’), acquired in two healthy volunteers on a GE MR750w 3T scanner, with cubic FOV=(192mm)3 and isotropic spatial resolution=(1mm)3. SWAN data were acquired twice, first with frequency encoding direction=A/P, then L/R. Receiver bandwidth was ±31.2kHz for all acquisitions. QSMs were obtained from the 1st echo of Looping Star (TE=21.07ms), 2nd echo of BURZTE (TE=24.3ms) and 3rd echo of the SWAN sequences (TE=21.9ms) by using a conventional processing pipeline including phase unwrapping7,8, V-SHARP background field removal9,10 and iLSQR-based dipole inversion7. All χ maps obtained from Looping Star, BURZTE and the 2nd SWAN were co-registered to the χ map obtained from the 1st SWAN by using FSL-FLIRT11 with nearest neighbor interpolation. Regions of interest (ROIs) were manually drawn onto the 1st SWAN QSM to delineate the globus pallidus, head of caudate nucleus, red nucleus, dentate nucleus and substantia nigra in each hemisphere. Pearson’s coefficient rho was calculated to assess the voxel-based linear correlation between the “gold standard” QSM obtained from the 1st SWAN and the QSMs obtained with ZTE acquisitions.Results
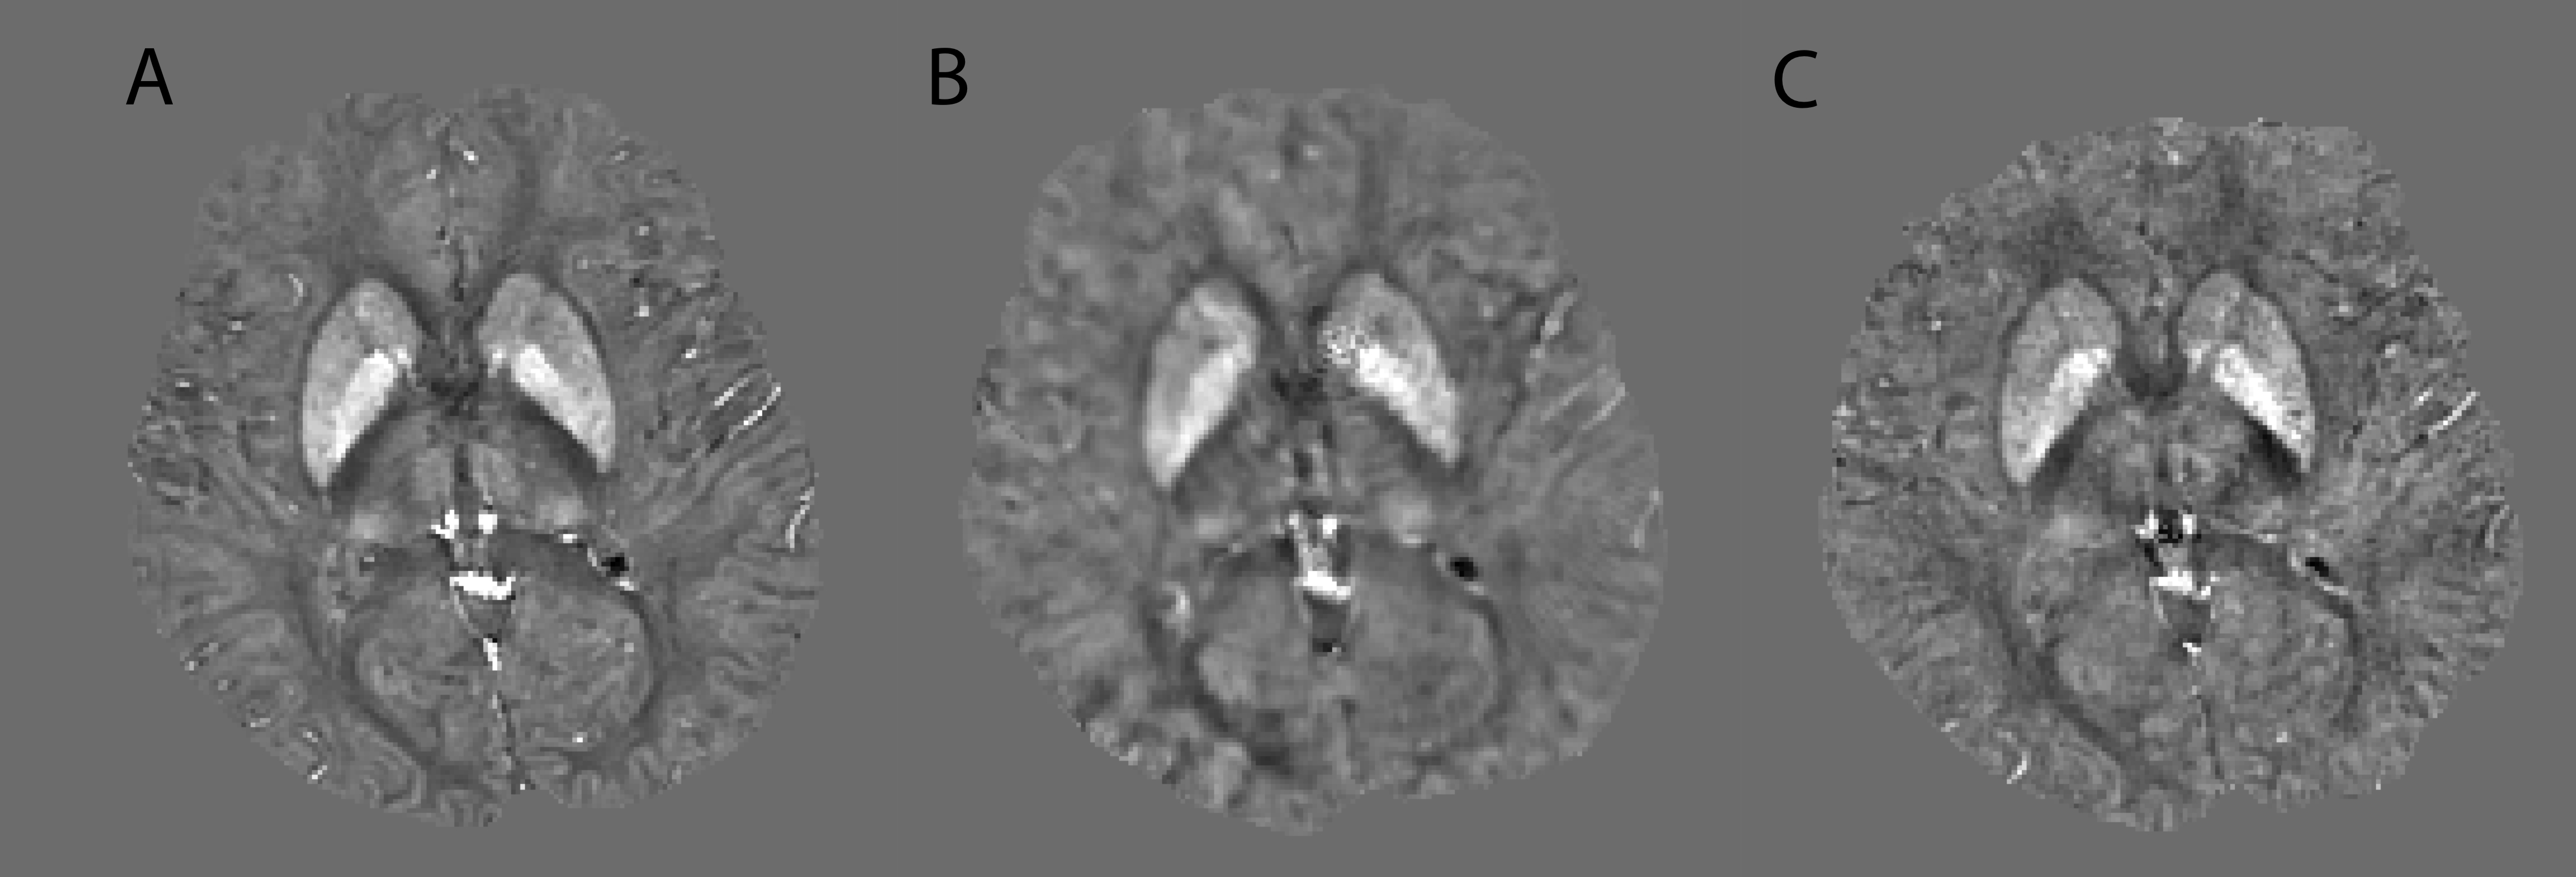
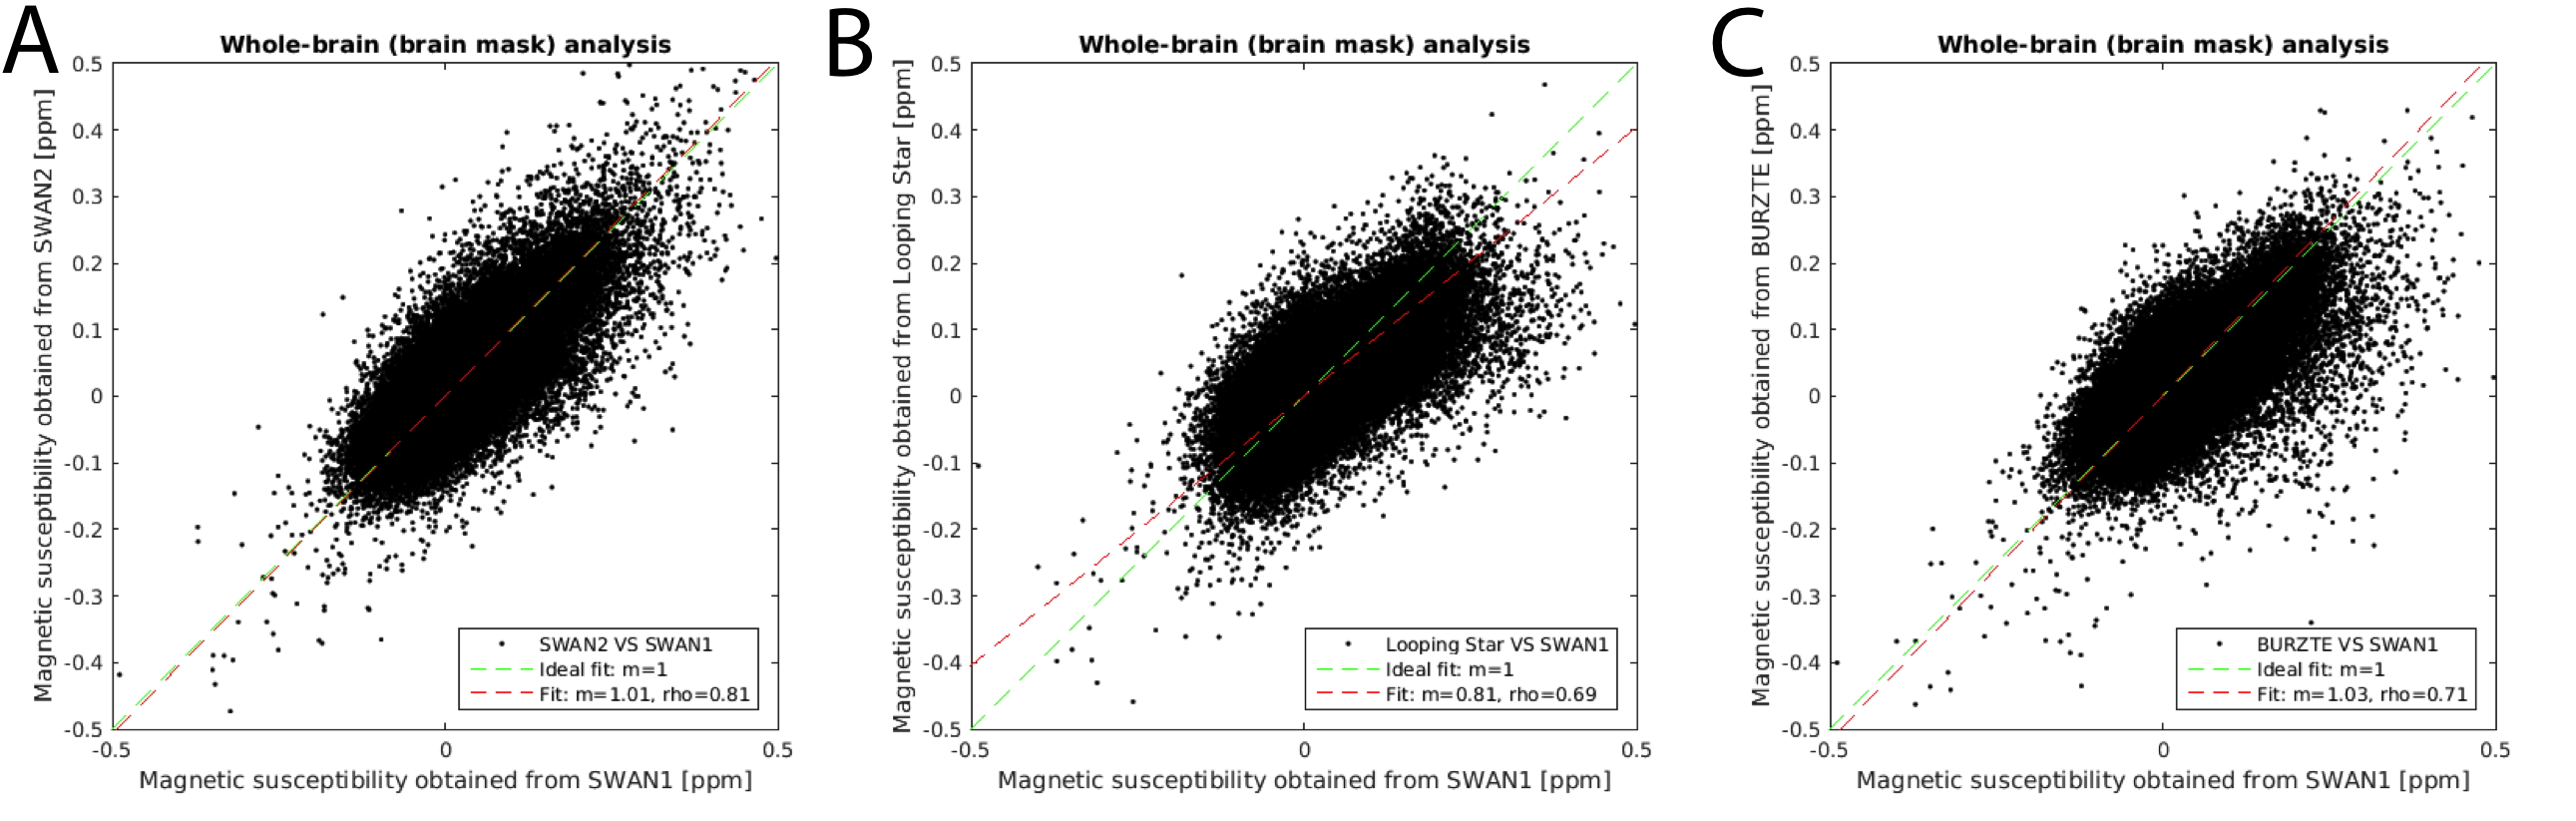
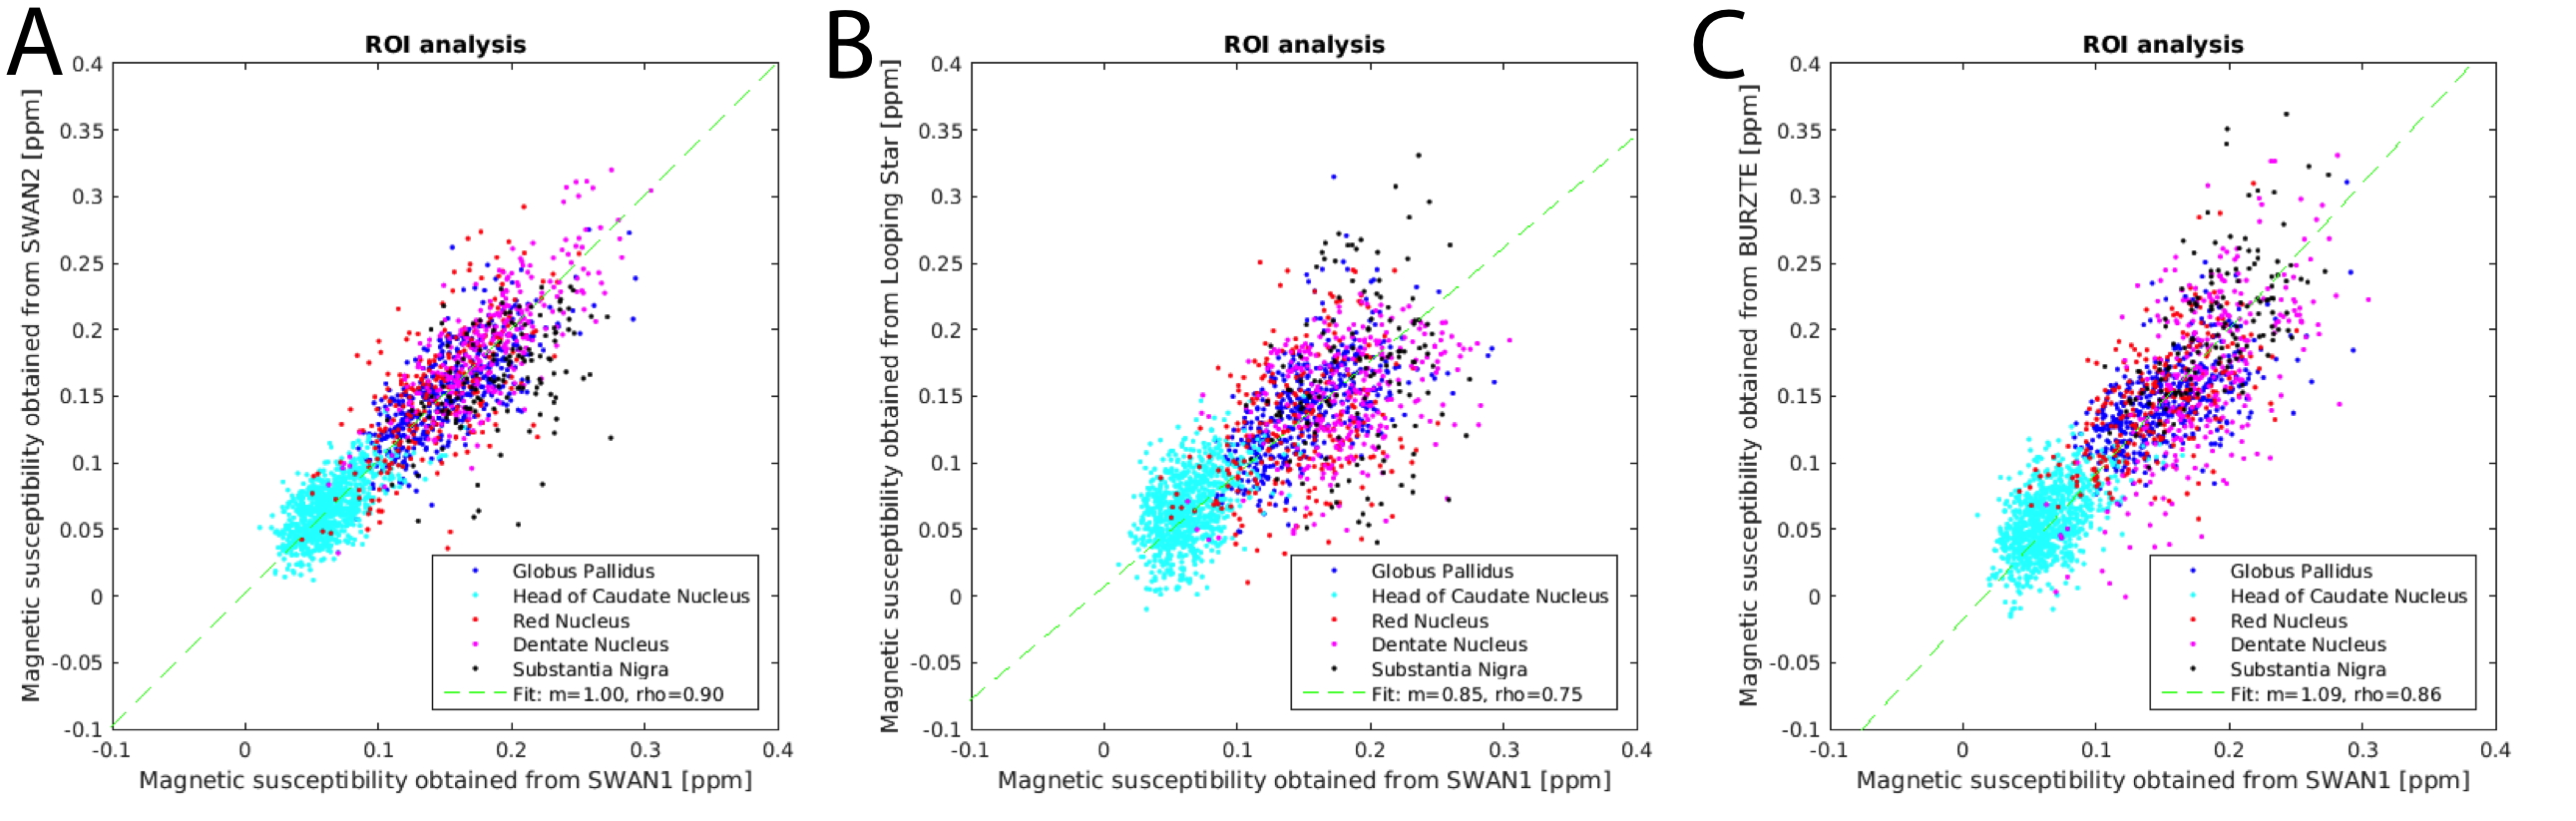
Quantitative χ maps obtained from Looping Star and BURZTE provided values that were similar to those obtained with conventional gradient-echo acquisitions (Figure 2), as demonstrated by average Pearson’s correlation coefficients in the two subjects of 0.67 and 0.65 for Looping Star and BURZTE, respectively, when considering all voxels inside a whole-brain mask (Figure 3). Average Pearson’s correlation coefficients increased to 0.79 and 0.75 for Looping Star and BURZTE, respectively, when only the voxels inside the ROIs were considered (Figure 4). Pearson’s correlation coefficients between the QSMs obtained from the two conventional SWAN acquisitions were 0.81 (whole-brain analysis) and 0.89 (analysis restricted to the ROIs).Discussion and Conclusion
This study demonstrates that recently developed Silent 3D radial T2* techniques such as Looping Star and BURZTE are able to provide T2*-weighted signal, whose phase information is suitable for QSM, with accuracy similar to that of conventional approaches. Future studies should aim to tailor such ZTE-based techniques specifically for efficient and silent QSM to achieve important advantages in clinical applications, such as the robustness to head motion, flow artifacts and geometrical distortions, and the simultaneous acquisition of the FID-based proton-density images.Acknowledgements
No acknowledgement found.References
1. Haacke EM, Liu S, Buch S, Zheng W, Wu D, Ye Y. Quantitative susceptibility mapping: current status and future directions. Magn Reson Imaging. 2015;33(1):1-25.
2. Deistung A, Schweser F, Reichenbach JR. Overview of quantitative susceptibility mapping. NMR Biomed. 2016.
3. Wang Y, Liu T. Quantitative susceptibility mapping (QSM): Decoding MRI data for a tissue magnetic biomarker. Magn Reson Med. 2015;73(1):82-101.
4. Liu C, Li W, Tong KA, Yeom KW, Kuzminski S. Susceptibility-weighted imaging and quantitative susceptibility mapping in the brain. J Magn Reson Imaging. 2015;42(1):23-41.
5. Solana AB, Menini A, Wiesinger F. Looping Star: A Novel, Self-Refocusing Zero TE Imaging Strategy. Proc. ISMRM (2016);1043.
6. Wiesinger F, Menini A, Solana AB. Looping Star. Proc. ISMRM (2017);0104.
7. Li,W, Wu B, Liu C, 2011. Quantitative susceptibility mapping of human brain reflects spatial variation in tissue composition. NeuroImage 55, 1645–1656.
8. Schofield MA, Zhu Y, 2003. Fast phase unwrapping algorithm for interferometric applications. Opt. Lett. 28, 1194–1196.
9. Schweser F, Deistung A, Lehr BW, Reichenbach JR, 2011. Quantitative imaging of intrinsic magnetic tissue properties using MRI signal phase: an approach to in vivo brain iron metabolism? NeuroImage 54, 2789–2807.
10. Wu B, Li W, Avram AV, Gho SM, Liu C, 2012. Fast and tissue-optimized mapping of magnetic susceptibility and T2* with multi-echo and multi-shot spirals. NeuroImage 59, 297–305.
11. Jenkinson M, Bannister P, Brady M, Smith S. Improved optimisation for the robust and accurate linear registration and motion correction of brain images. Neuroimage. 2002;17(2):825–841.
Figures