2195
Simultaneous quantification of fat fraction, susceptibility and R2* from a single GRE acquisition: flip-angle effects1Imaging Research Laboratories, Robarts Research Institute, Schulich School of Medicine & Dentistry, University of Western Ontario, London, ON, Canada, 2Medical Biophysics, Schulich School of Medicine & Dentistry, University of Western Ontario, London, ON, Canada
Synopsis
We report on a systematic investigation of the flip-angle (FA) effects on the quantification of fat fraction (FF), susceptibility, and R2* simultaneously from a single multi-echo GRE (mGRE) acquisition. Using a phantom with a range of oil-water emulsions and aqueous Gadolinium solutions we tested five different FAs (1°, 3°, 5°, 8° and 15°) with a bipolar mGRE protocol and were able to successfully generate the FF, susceptibility and R2* maps for all cases. Our results demonstrate that a single mGRE scan with optimized TEs has the potential to accurately measure quantitative FF, susceptibility, and R2* with a FA of 8°.
TARGET AUDIENCE: Researchers and clinicians interested in quantitative susceptibility-based MRI and separating fat/water.
INTRODUCTION: Simultaneously quantification of fat (e.g., proton density fat-fraction (FF)) and iron levels (e.g., R2* and the QSM-derived tissue susceptibility (χ)) in the human body from a single multi-echo GRE (mGRE) scan has potential to become highly valuable in the clinic. A few mGRE-based Dixon-QSM techniques1-4 have been developed to jointly estimate B0 inhomogeneity, FF, R2* and χ, however effect of flip angle (FA) has only been evaluated with respect to the accuracy of the FF5 and not χ. To mitigate the T1 effect on FF accuracy, the typical FA prescribed in most multi-echo Dixon protocols ranges from 3º to 5º 1,6. Meanwhile, the accuracy of χ estimation, has only been evaluated at larger FAs, i.e. ranging from 15° 2,7 to 30° 8,9. In this work, we performed a systematic phantom study to investigate the flip-angle effects in the quantification of FF, susceptibility and R2* from a single mGRE acquisition with echo times (TEs) optimized to quantify both chemical shift and susceptibility.
METHODS:
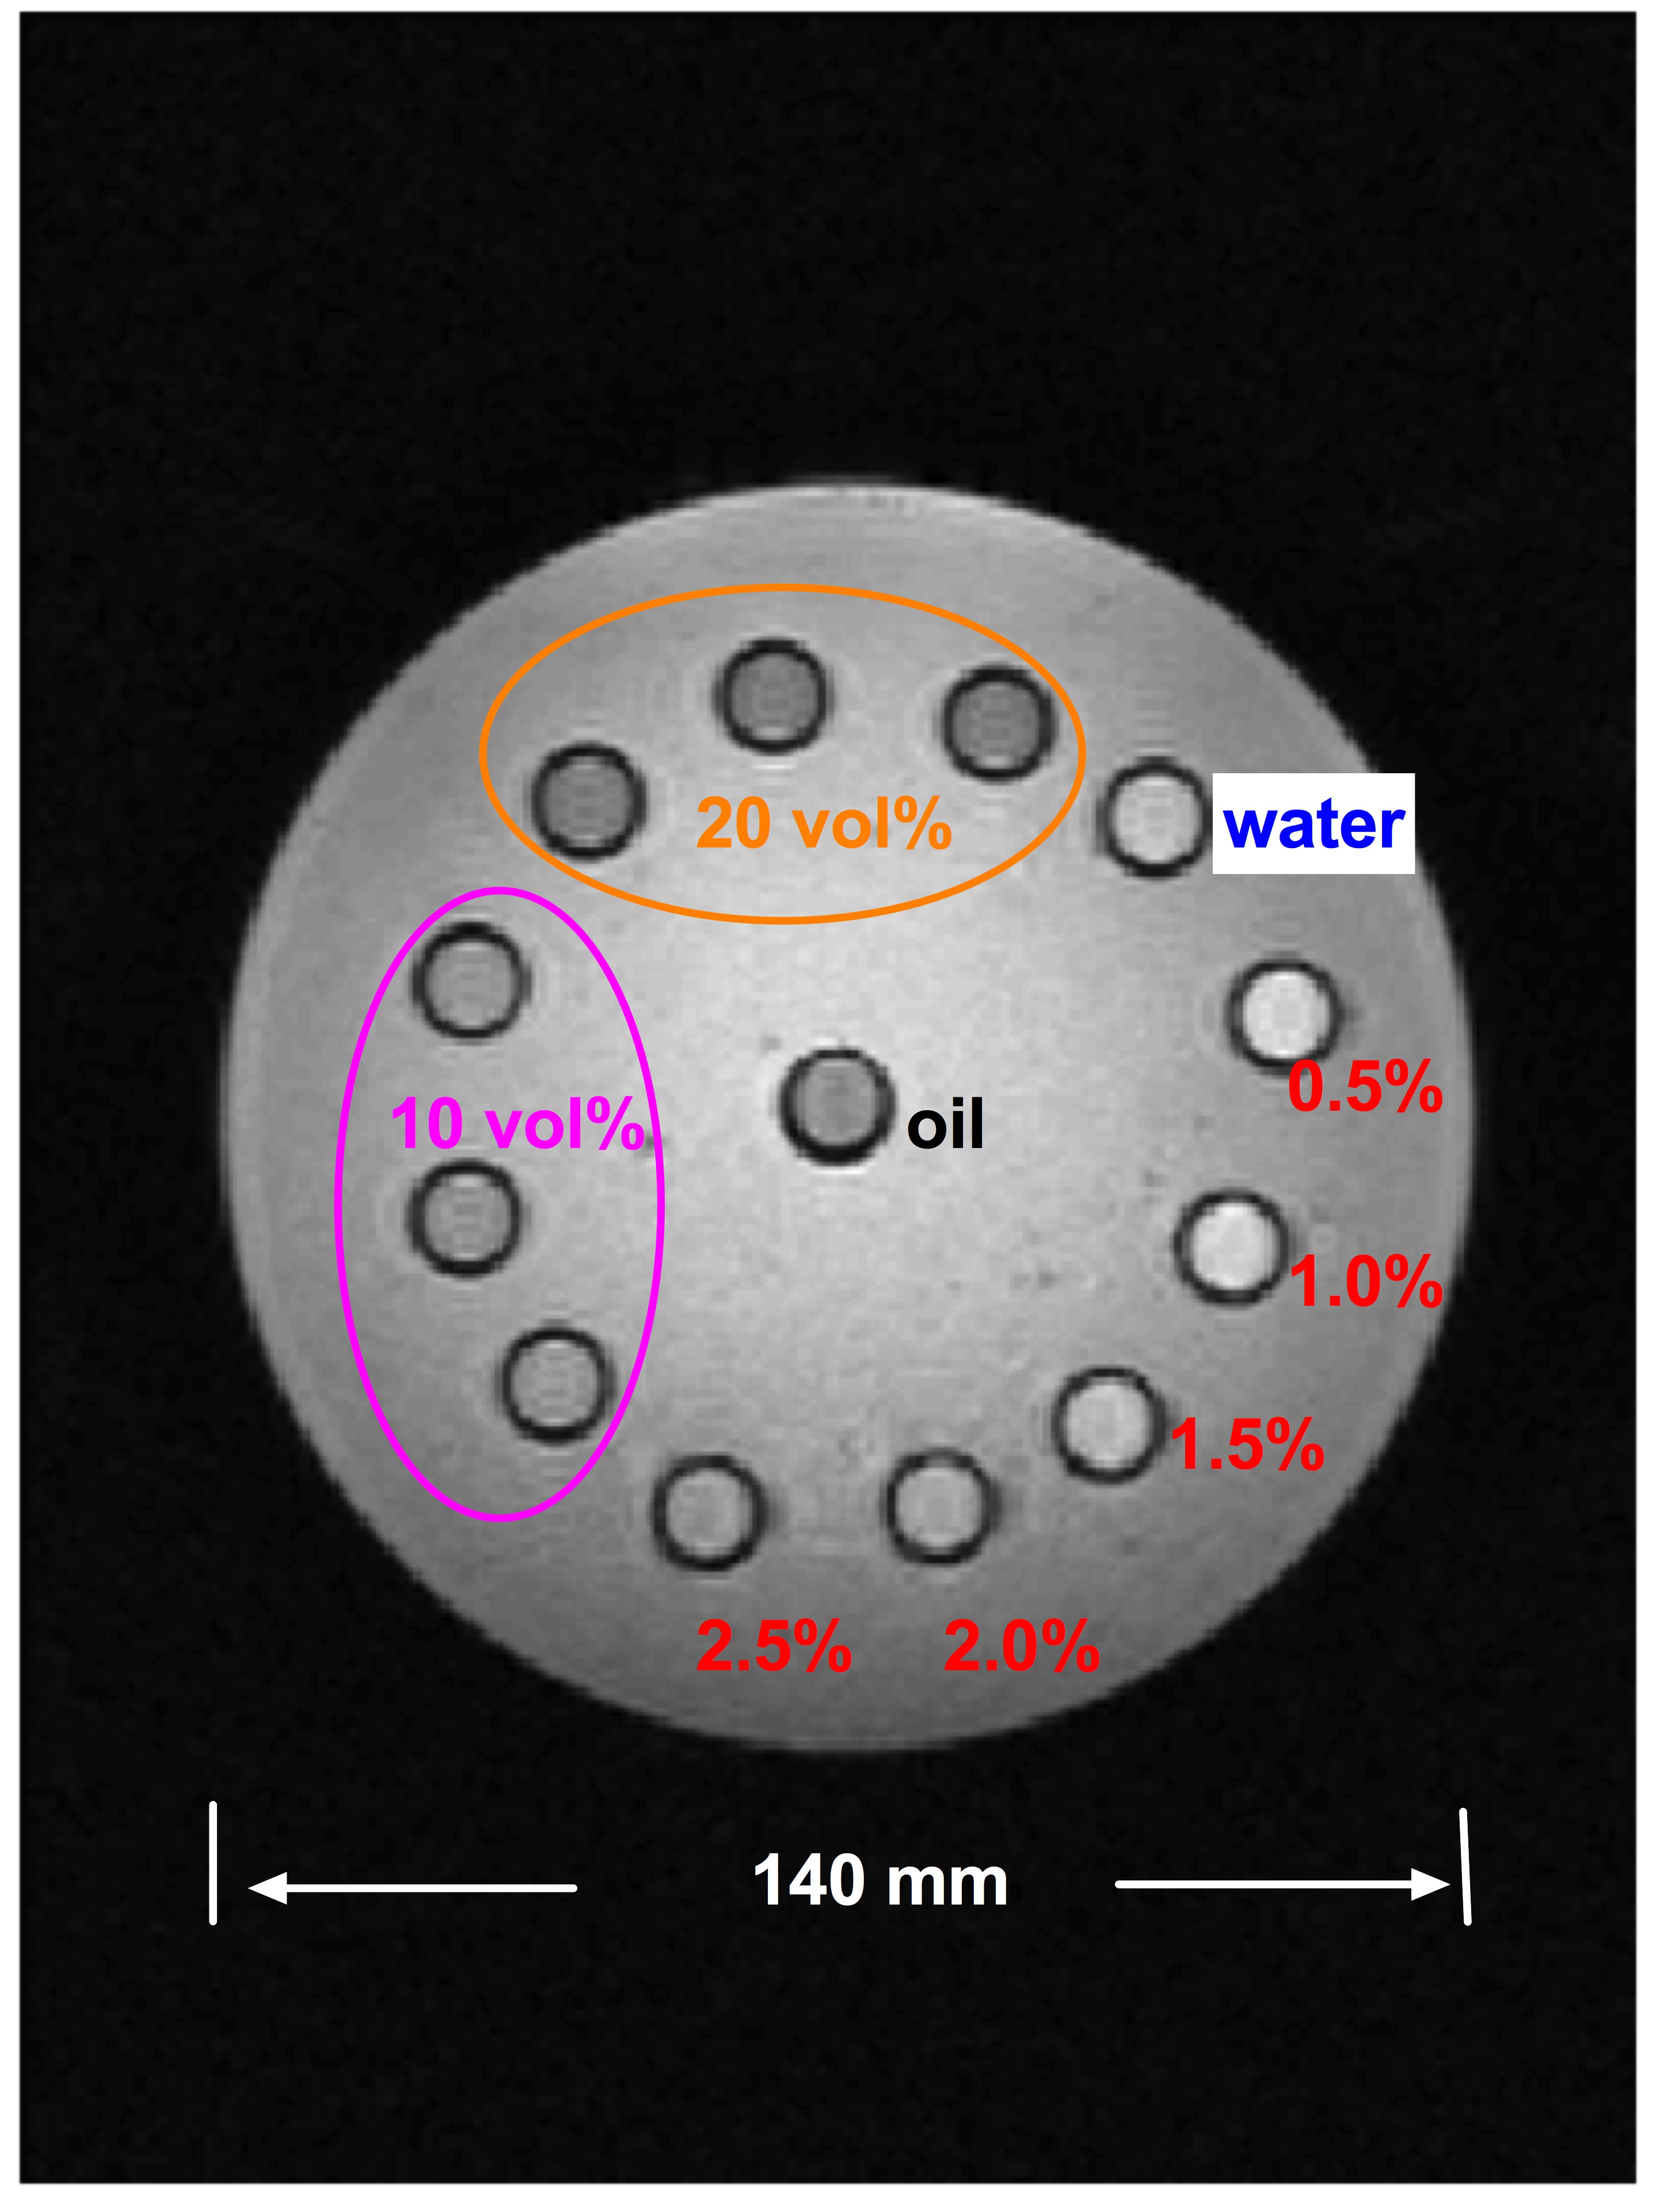
Phantom construction: A 14 cm diameter cylindrical phantom (Fig. 1) was constructed with 13 vials (polystyrene; 1 cm diameter, 5 mL volume): one was filled with water, one with peanut oil, six with oil-water emulsions of varying true fat volume percentages (three each of 10 and 20 vol%) stabilized with agar 10,11 and five with aqueous Gadolinium (Gd) solutions (Magnevist; Berlex Laboratories; Wayne, NJ) of 0.5, 1, 1.5, 2 and 2.5% of the raw solution (0.5 mmol Gd), yielding susceptibility shifts of 0.81, 1.63, 2.45, 3.26 and 4.08 ppm at room temperature8. All vials were embedded in agar gel prior to scanning.
Protocol and data acquisition: A dual-echo-train bipolar mGRE protocol was developed on a 3 T scanner (Siemens Prisma) to cover the whole head in approximately 5 minutes. The first echo train (five echoes) was optimized for fat/water separation (TE = 3.3, 4.7, 6.2, 7.7 and 9.5 ms) 12,13, while the second echo train was designed with TEs optimized for susceptibility mapping14 with fat and water in-phase (16.8, 23.9, 31.1, 38.2, and 45.4 ms).
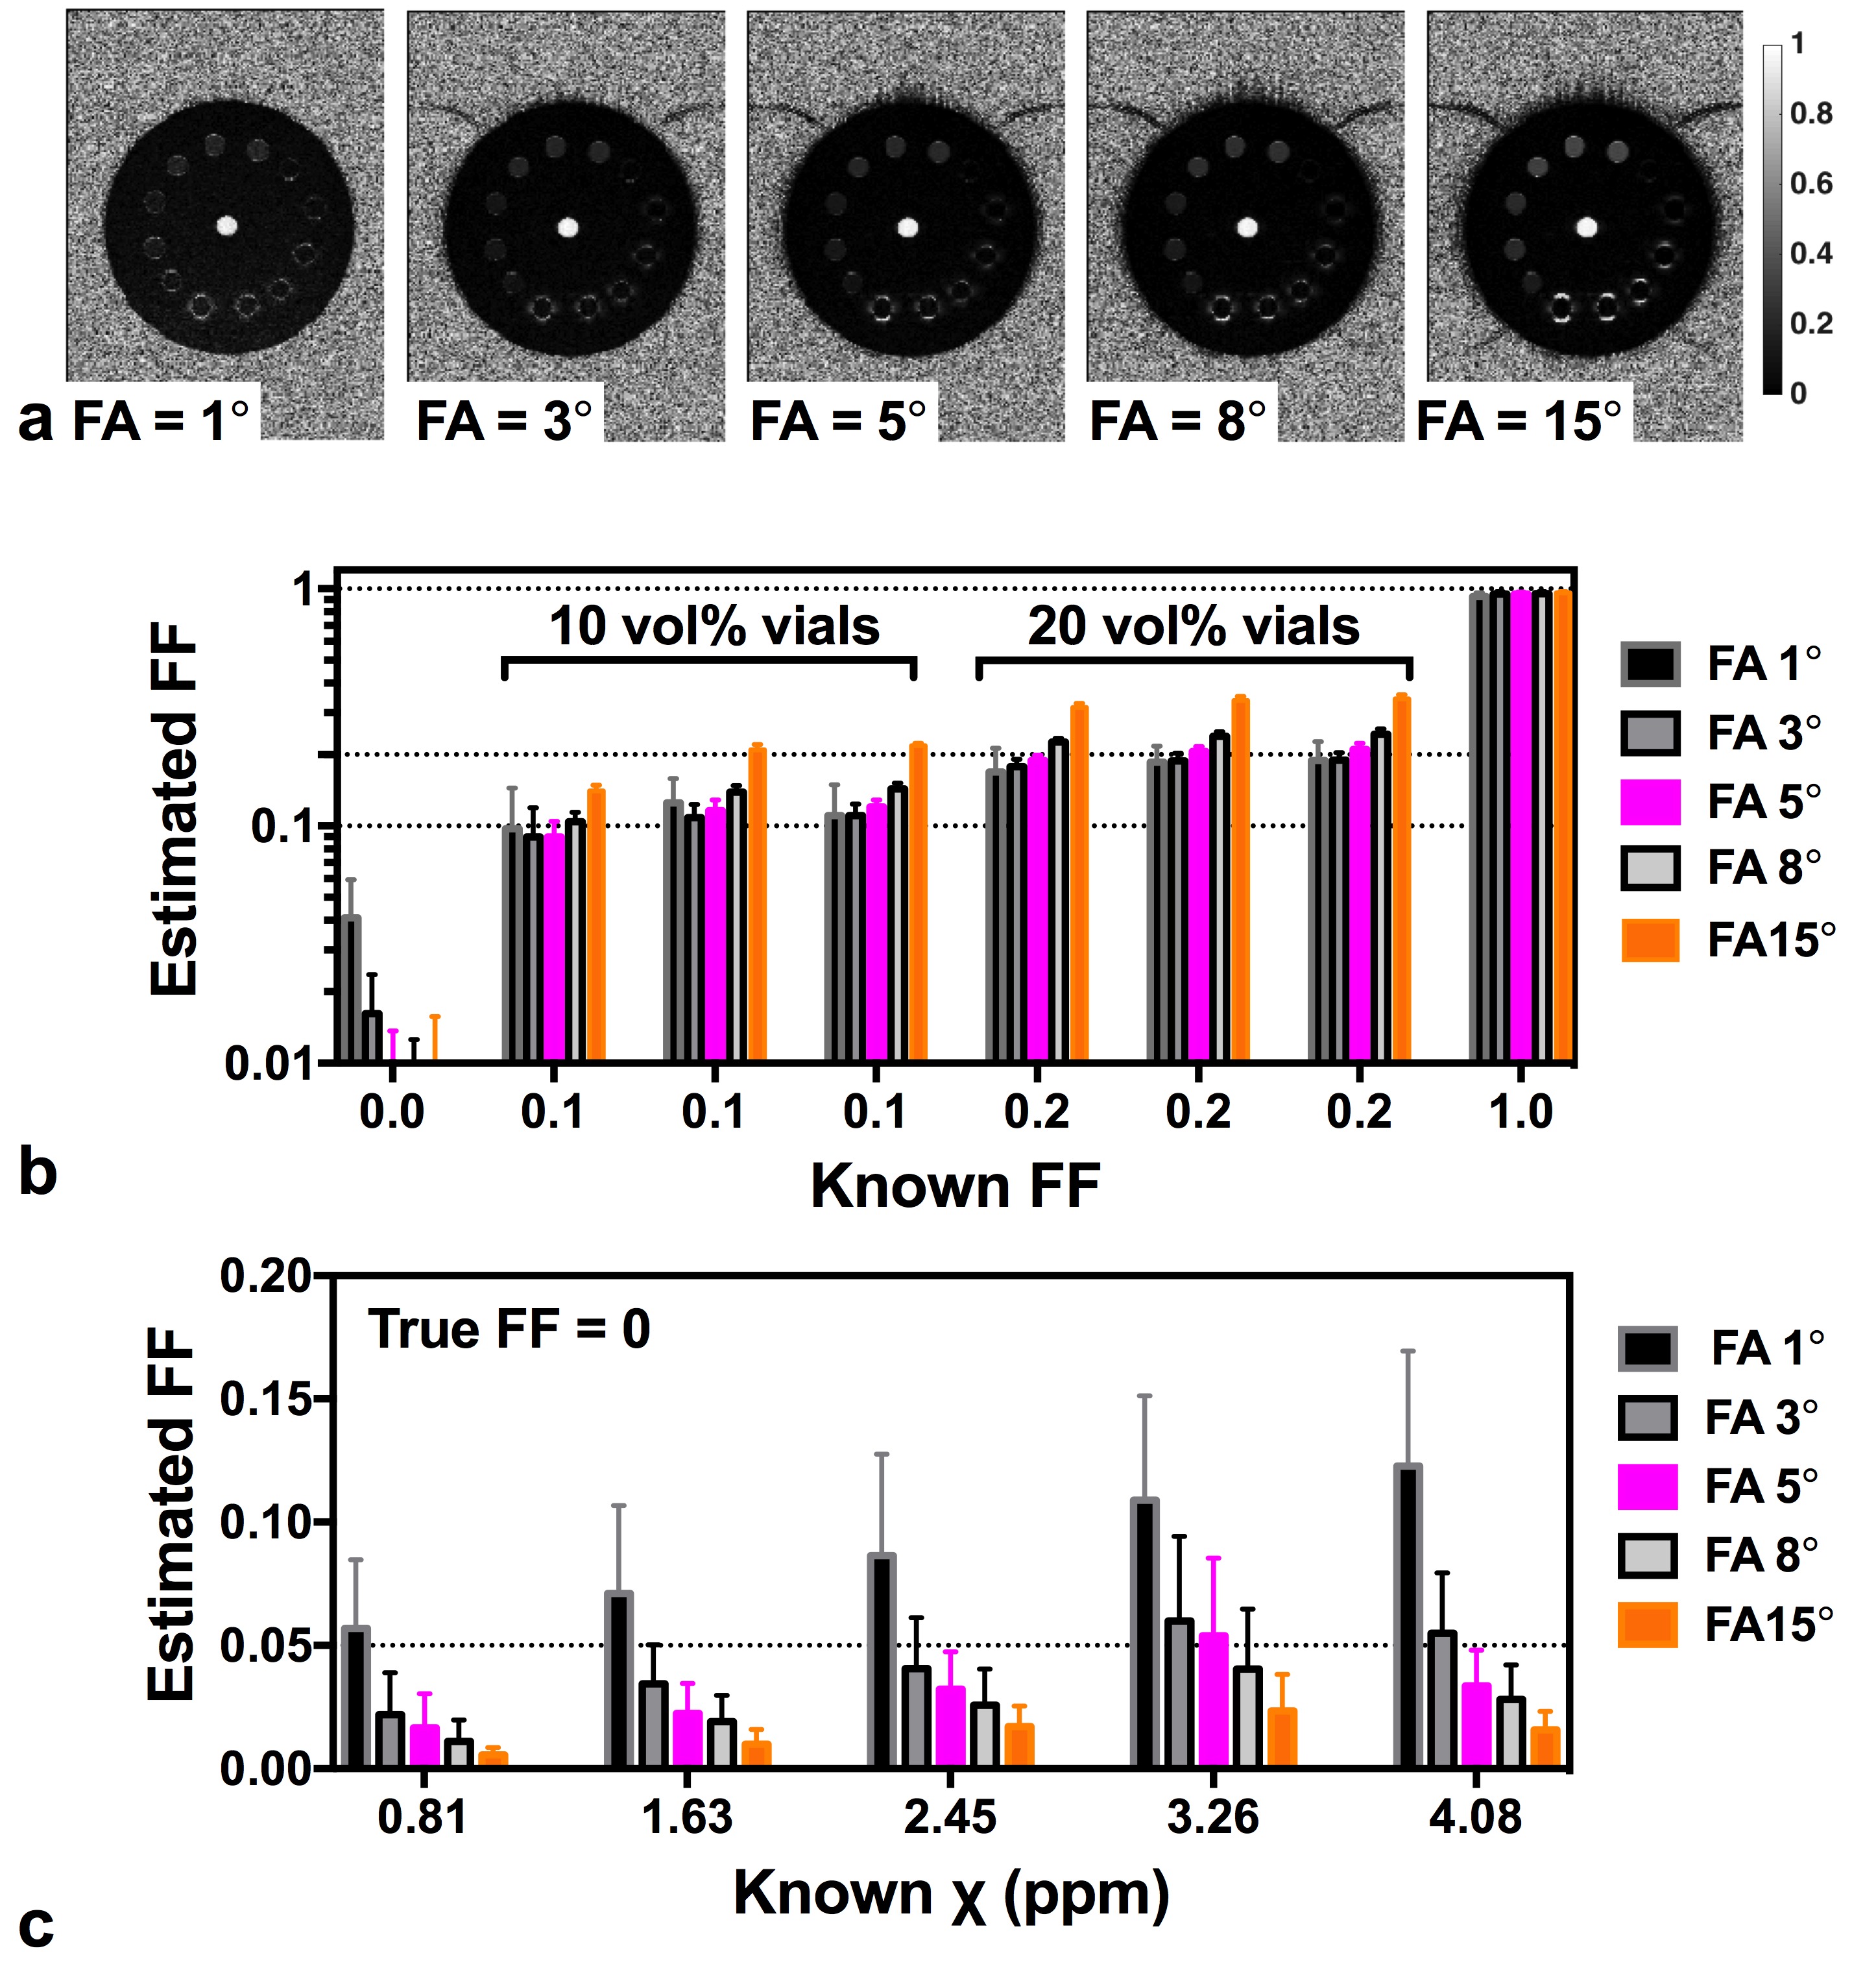
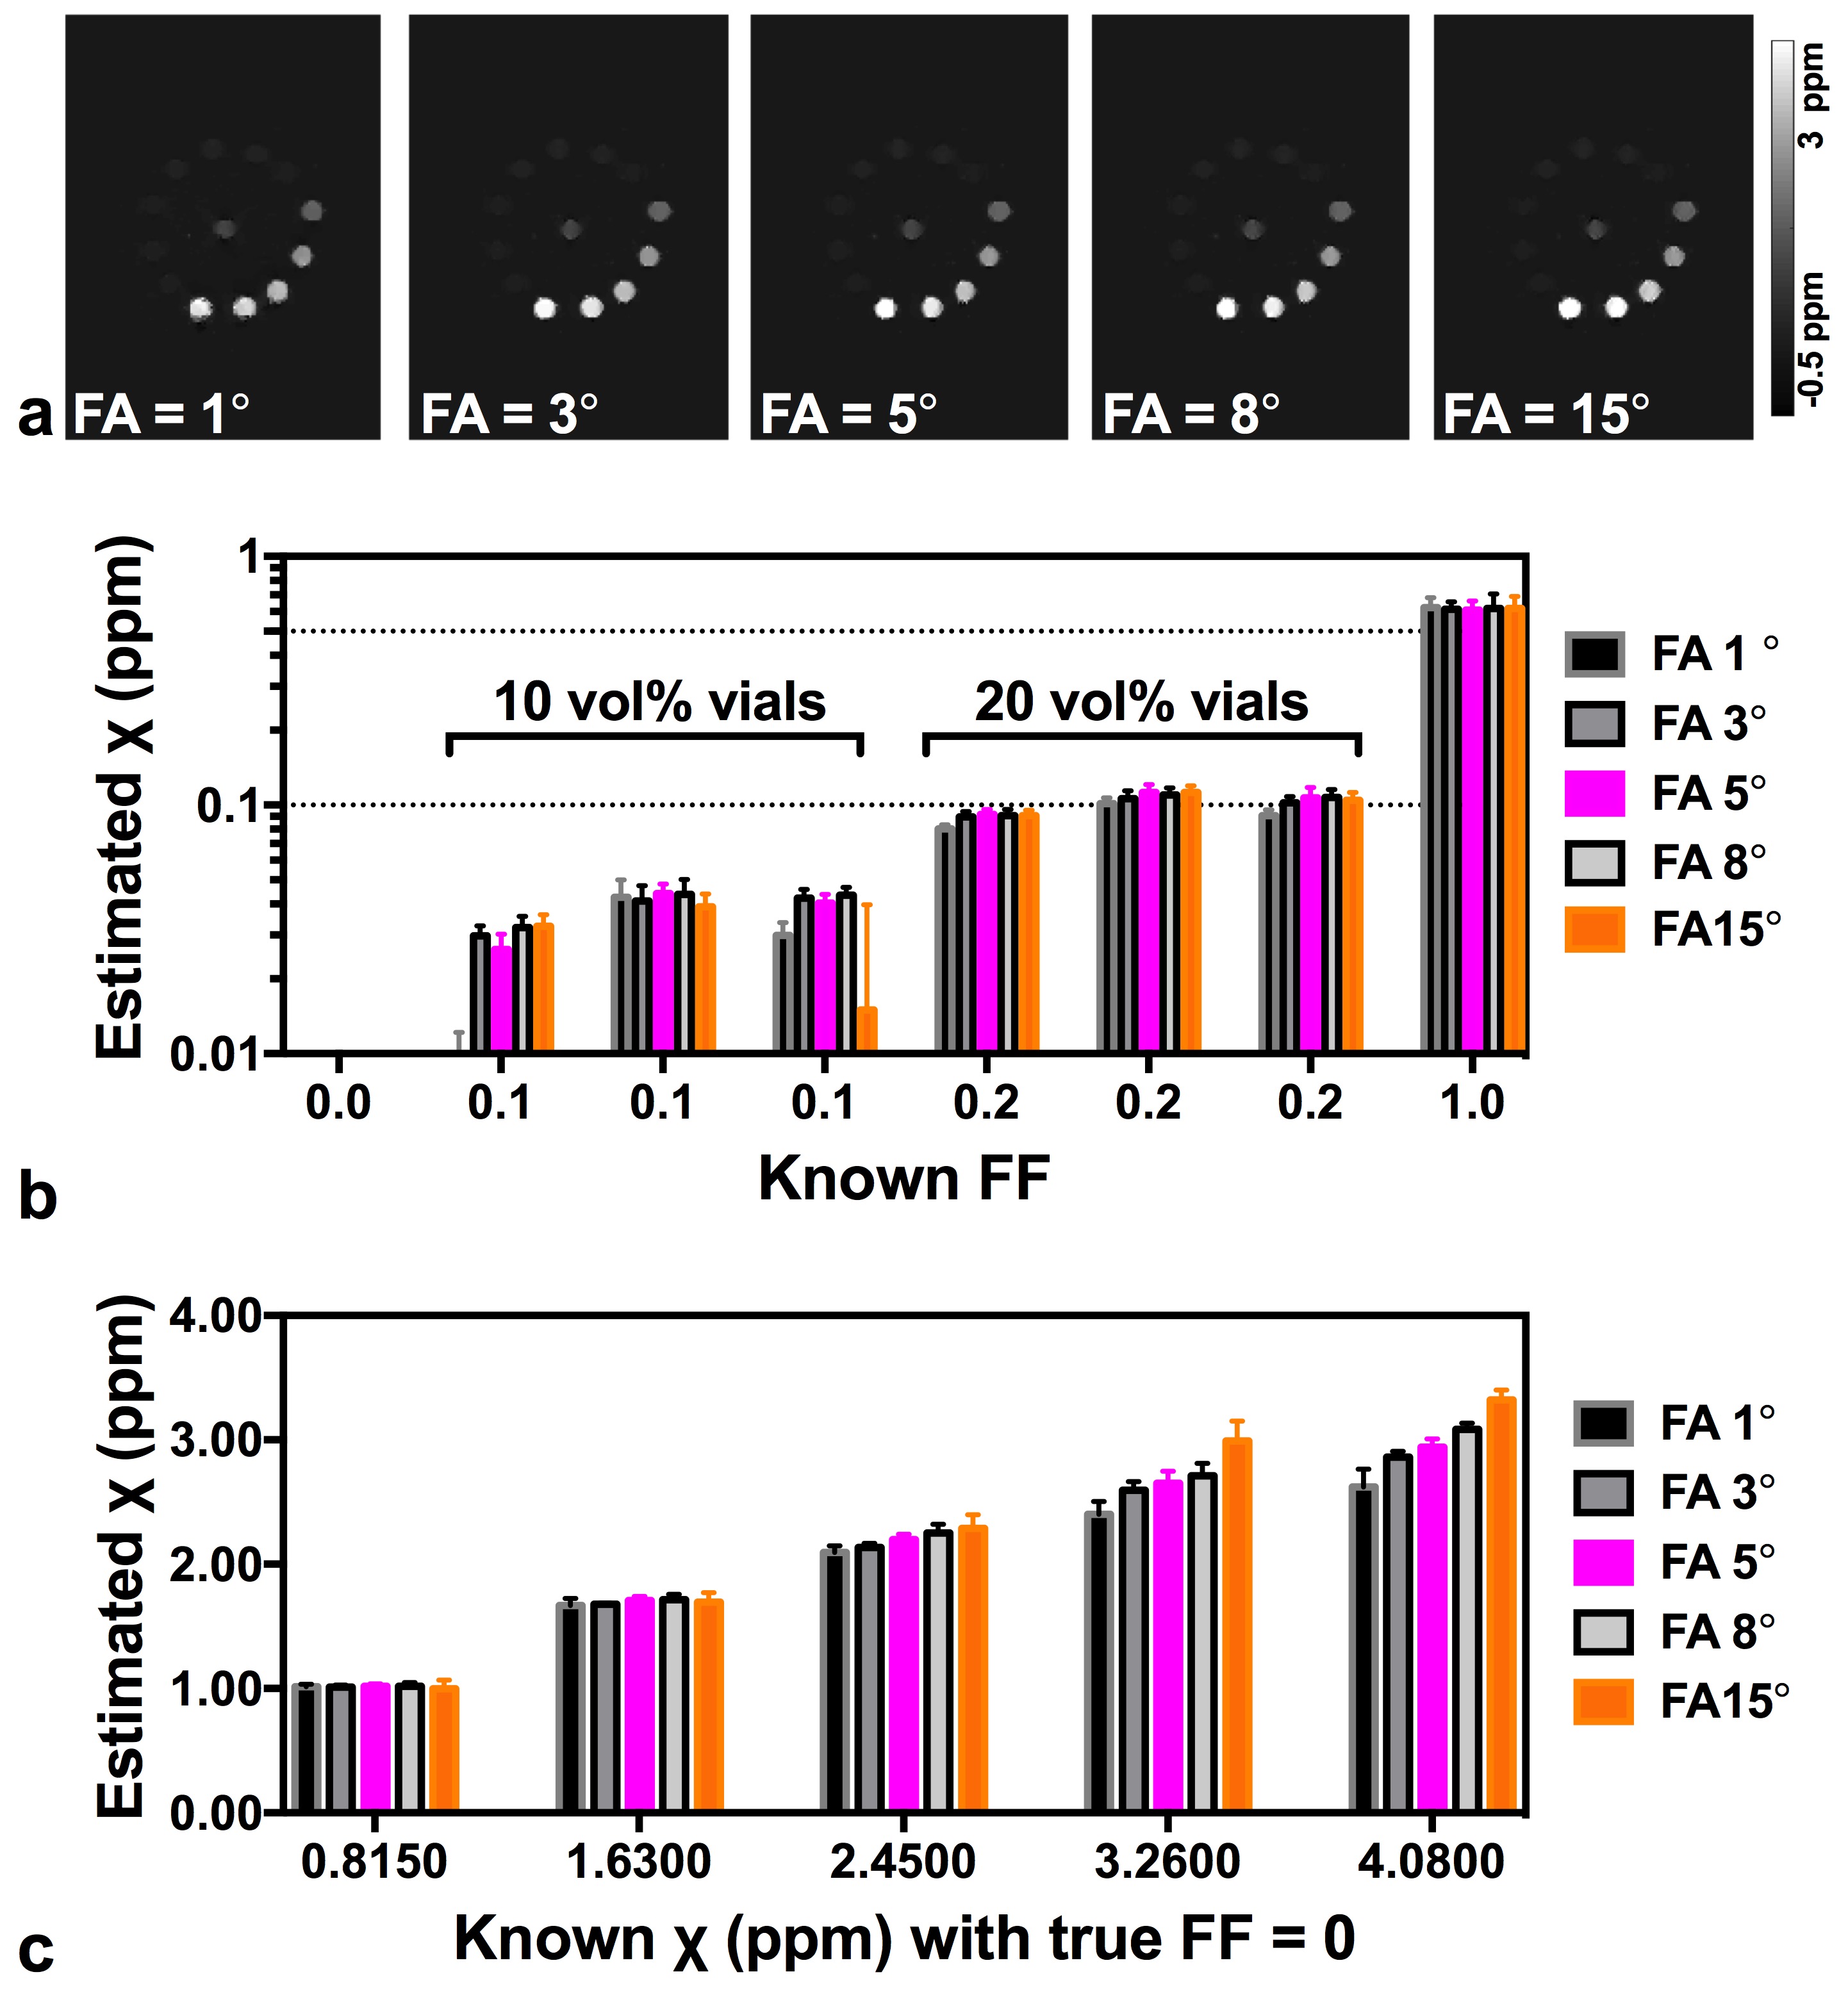
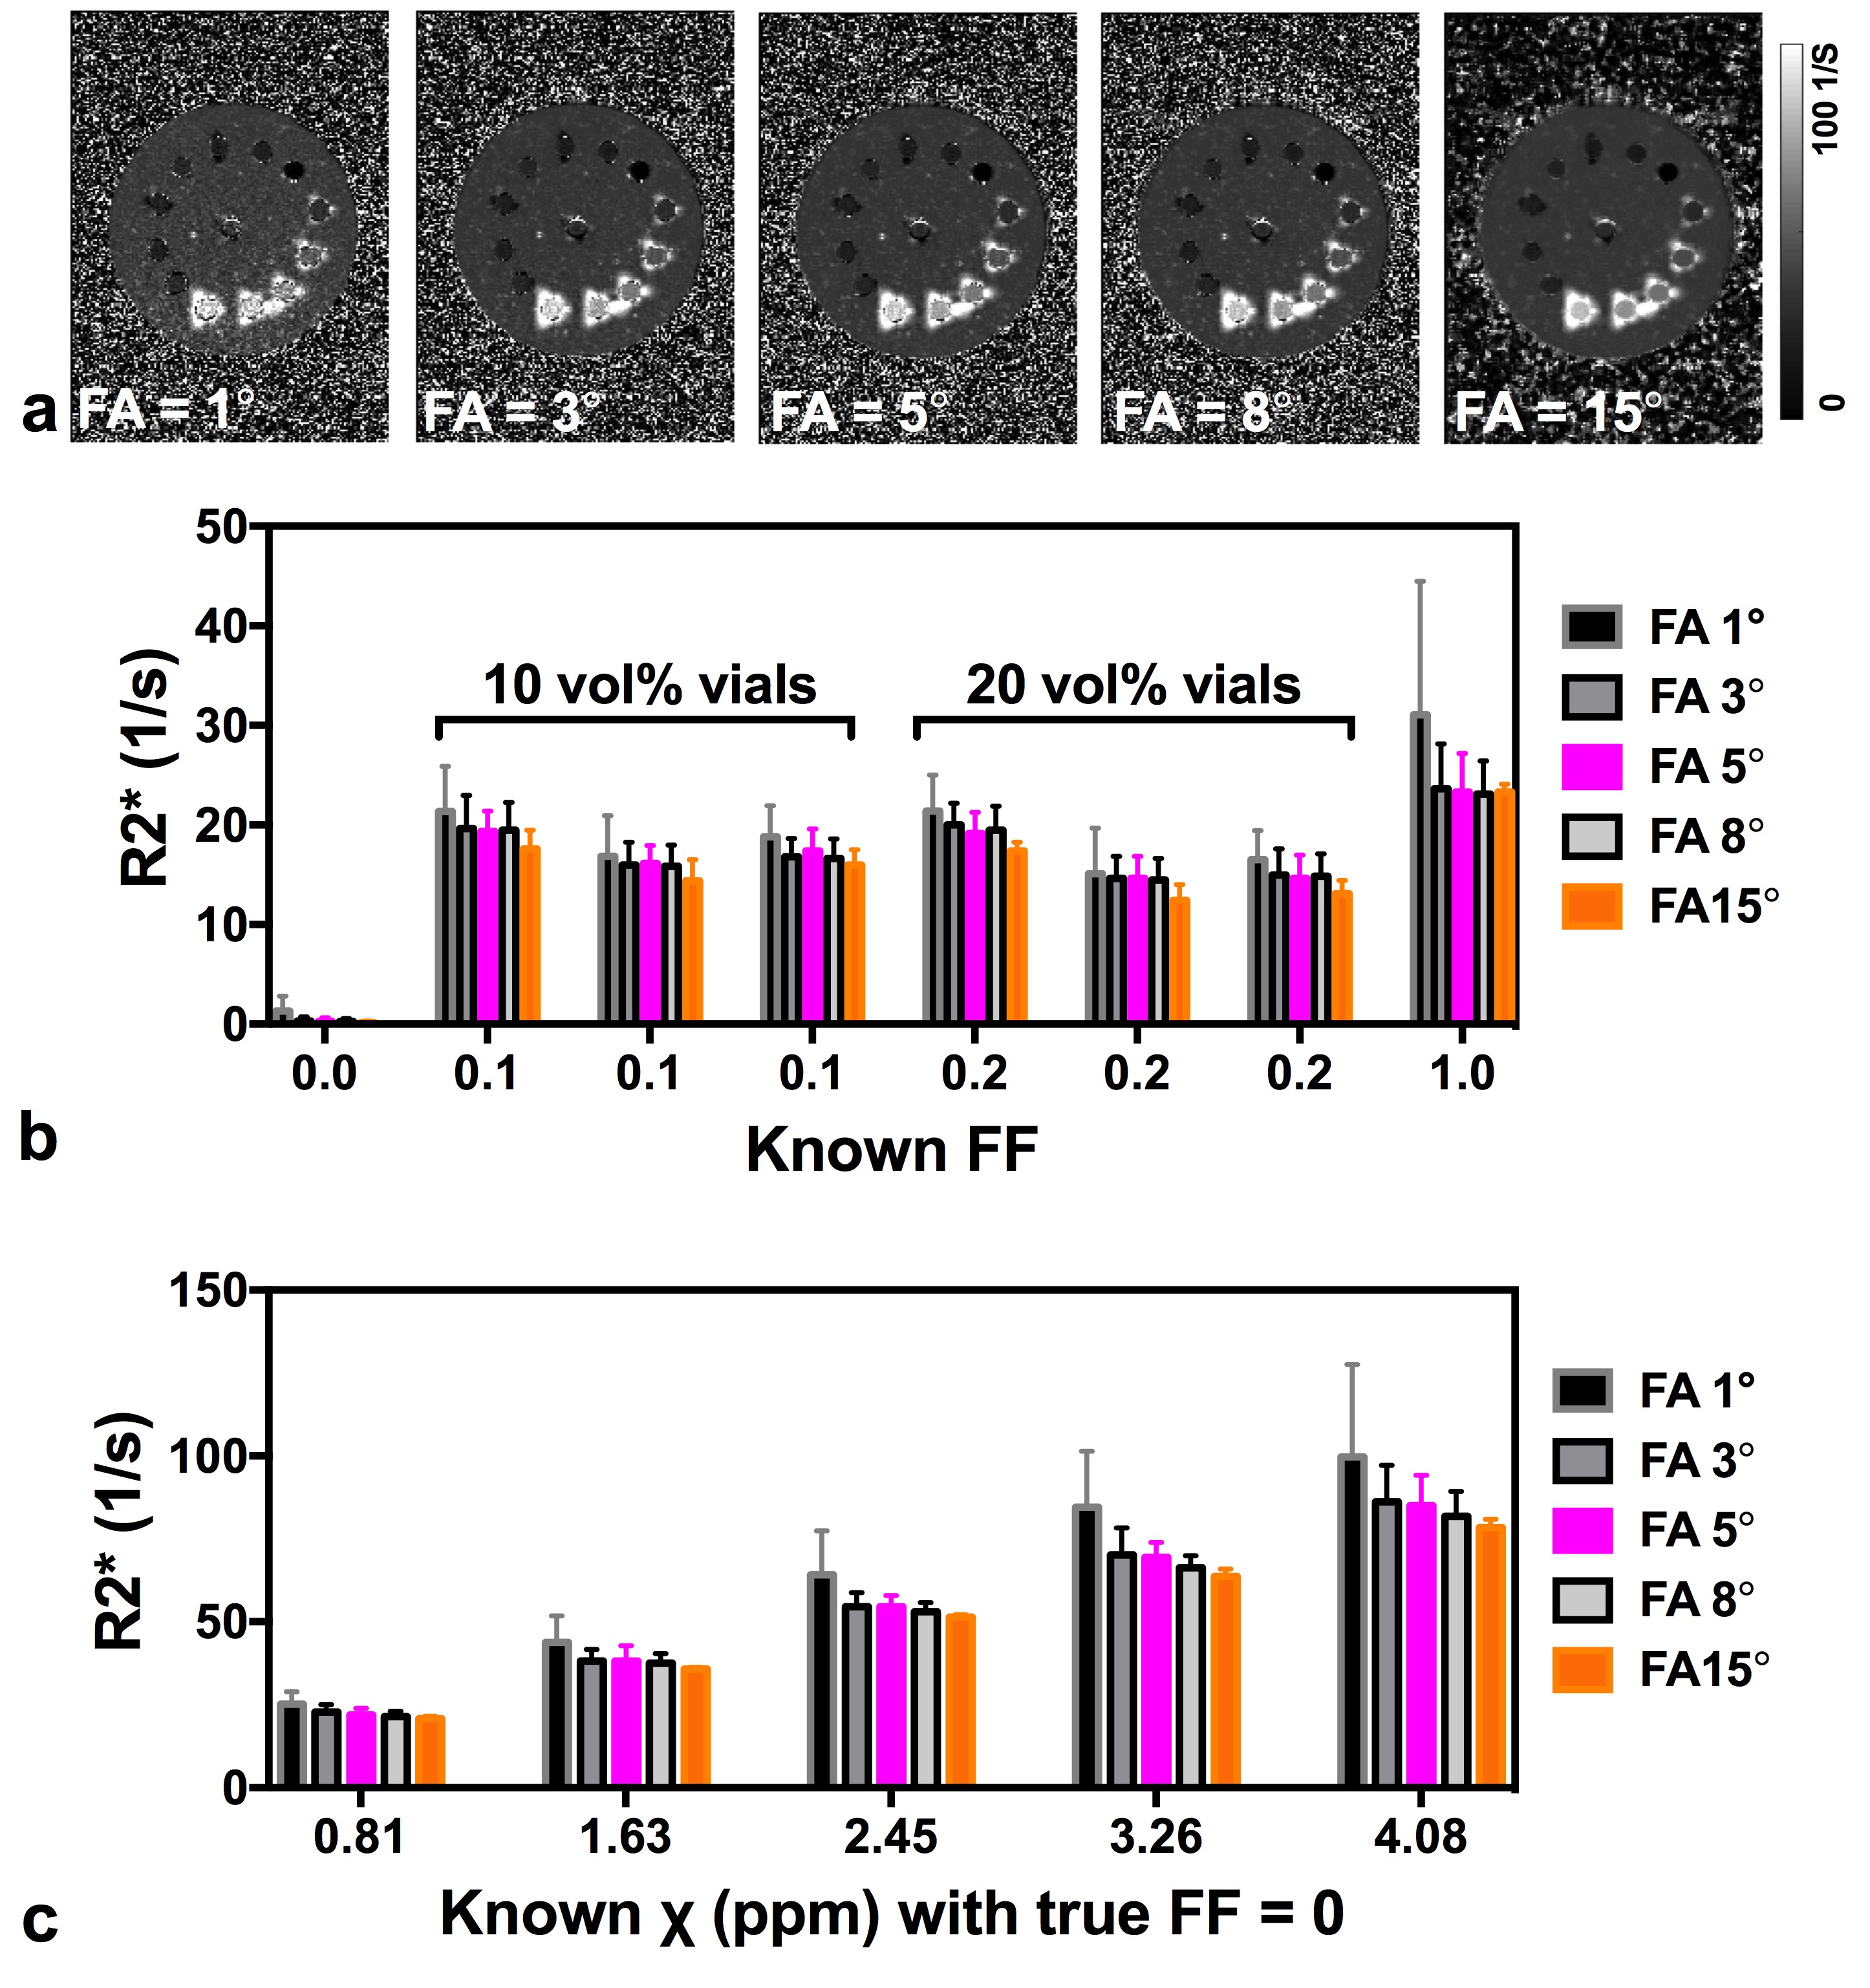
The phantom was scanned in the coronal plane with five different FAs (1°, 3°, 5°, 8° and 15°). The remaining scan parameters were: TR 51 ms; bandwidth 1015 Hz/pixel; spatial resolution 1.0×1.0×2.0 mm3; GRAPPA = 2.
Processing: First, we corrected the phase errors associated with the bipolar acquisition on an echo-by-echo basis. Second, we used the unwrapping-based B0 mapping technique15 to map FF. Third, we generated a total field map using a complex fitting method, followed by calculating the QSM map using both the Laplacian boundary value background removal method16 and the morphology enabled dipole inversion algorithm9; only the seven in-phase echoes were used in QSM quantification. Finally, R2* maps were generated from all ten echoes using exponential fitting.
Analysis: Regions of interest (ROIs) were manually drawn on the 1st echo magnitude image for each vial at the central coronal slice; mean and standard deviation over each ROI (~ 36 pixels) were calculated for the FF, χ and R2* maps; the water vial was chosen as the reference for the susceptibility value.
RESULTS: Results from the phantom experiments are presented in Figs. 2-4 for FF estimation, susceptibility mapping and R2* mapping, respectively. Figure 2b shows that the FF of the oil-water emulsions was overestimated with FA = 15° (mean estimated FF is 19% for the three 10 vol% vials and 33% for the 20 vol% vials). In the presence of Gd, (Fig. 2c) fat is artificially introduced, with values as high as 0.05 at FA=5°. Figure 3c shows that estimated χ was more sensitive to FA in vials with Gd concentration >1.0%; in these vials estimated χ was lower than expected. Figures 4b and 4c show that both FF and χ affect R2*, with a decrease in estimated R2* with increasing FA as expected.
DISCUSSION: When using a small FA (<5°) in the presence of both fat and high iron concentration, both FF and χ will be erroneously calculated due to FA effects. When a FA=8° is used, fat will not appear artificially in FF maps where iron content is high and will suffer an overestimation of FF or only 12%. At the highest FA (15°) T1 correction for FF estimation17 should be applied. Therefore our phantom results suggest that a FA of 8° is a promising tradeoff but future work with in vivo data is required.
CONCLUSION: A single mGRE scan has the potential to accurately estimate FF, χ and R2* if FA-dependent biases are understood and accounted for.
Acknowledgements
Partial funding was provided by a grant from the Natural Sciences and Engineering Research Council of Canada and a grant from Canadian Institutes of Health Research (PJT 153411). M.D. is a Career Scientist of the Heart and Stroke Foundation of Ontario.References
1. Sharma SD, Hernando D, Horng DE, Reeder SB. Quantitative susceptibility mapping in the abdomen as an imaging biomarker of hepatic iron overload. Magn Reson Med 2015;74(3):673-683.
2. Dimov AV, Liu T, Spincemaille P, et al. Joint estimation of chemical shift and quantitative susceptibility mapping (chemical QSM). Magn Reson Med 2015;73(6):2100-2110.
3. Dong J, Liu T, Chen F, et al. Simultaneous phase unwrapping and removal of chemical shift (SPURS) using graph cuts: application in quantitative susceptibility mapping. IEEE Trans Med Imaging 2015;34(2):531-540.
4. Liu Z, Kee Y, Zhou D, Wang Y, Spincemaille P. Preconditioned total field inversion (TFI) method for quantitative susceptibility mapping. Magn Reson Med 2017;78(1):303-315.
5. Liu CY, McKenzie CA, Yu H, Brittain JH, Reeder SB. Fat quantification with IDEAL gradient echo imaging: correction of bias from T(1) and noise. Magn Reson Med 2007;58(2):354-364.
6. Hernando D, Sharma SD, Aliyari Ghasabeh M, et al. Multisite, multivendor validation of the accuracy and reproducibility of proton-density fat-fraction quantification at 1.5T and 3T using a fat-water phantom. Magn Reson Med 2017;77(4):1516-1524.
7. Zhou D, Cho J, Zhang J, Spincemaille P, Wang Y. Susceptibility underestimation in a high-susceptibility phantom: Dependence on imaging resolution, magnitude contrast, and other parameters. Magn Reson Med 2017;78(3):1080-1086.
8. de Rochefort L, Liu T, Kressler B, et al. Quantitative susceptibility map reconstruction from MR phase data using bayesian regularization: validation and application to brain imaging. Magn Reson Med 2010;63(1):194-206.
9. Liu J, Liu T, de Rochefort L, et al. Morphology enabled dipole inversion for quantitative susceptibility mapping using structural consistency between the magnitude image and the susceptibility map. Neuroimage 2012;59(3):2560-2568.
10. Hines CD, Yu H, Shimakawa A, McKenzie CA, Brittain JH, Reeder SB. T1 independent, T2* corrected MRI with accurate spectral modeling for quantification of fat: validation in a fat-water-SPIO phantom. J Magn Reson Imaging 2009;30(5):1215-1222.
11. Hernando D, Sharma SD, Kramer H, Reeder SB. On the confounding effect of temperature on chemical shift-encoded fat quantification. Magn Reson Med 2014;72(2):464-470.
12. Pineda AR, Reeder SB, Wen Z, Pelc NJ. Cramer-Rao bounds for three-point decomposition of water and fat. Magn Reson Med 2005;54(3):625-635.
13. Reeder SB, McKenzie CA, Pineda AR, et al. Water-fat separation with IDEAL gradient-echo imaging. J Magn Reson Imaging 2007;25(3):644-652.
14. Deistung A, Rauscher A, Sedlacik J, Stadler J, Witoszynskyj S, Reichenbach JR. Susceptibility weighted imaging at ultra high magnetic field strengths: theoretical considerations and experimental results. Magn Reson Med 2008;60(5):1155-1168.
15. Liu J, Drangova M. Method for B0 off-resonance mapping by non-iterative correction of phase-errors (B0-NICE). Magn Reson Med 2015;74(4):1177-1188.
16. Zhou D, Liu T, Spincemaille P, Wang Y. Background field removal by solving the Laplacian boundary value problem. NMR Biomed 2014;27(3):312-319.
17. Kuhn JP, Jahn C, Hernando D, et al. T1 bias in chemical shift-encoded liver fat-fraction: role of the flip angle. J Magn Reson Imaging 2014;40(4):875-883.
Figures