2193
Fast Zoomed QSM of the Human Midbrain at 7T1Danish Research Center for Magnetic Resonance, Centre for Functional and Diagnostic Imaging and Research, Copenhagen University Hospital Hvidovre, Hvidovre, Denmark, 2Center for Magnetic Resonance, Department of Electrical Engineering, Technical University of Denmark, Lyngby, Denmark, 3Bio-Imaging Research Team, Korea Basic Science Institute, Cheongju, Republic of Korea, 4Bio-Analysis Science, University of Science and Technology, Daejeon, Republic of Korea
Synopsis
In this work, zoomed quantitative susceptibility mapping (QSM) is proposed as an alternative way of accelerating high resolution QSM data acquisition at 7T. Inner volume excitation is realized with 2D spatially selective excitation, targeting the midbrain, which is the primary region of investigation for Parkinson’s disease. The consequence of reducing the excited region on the reconstructed susceptibility maps was investigated via simulations, where the diameter of a brain mask was gradually decreased in the QSM processing pipeline. The susceptibility maps of a healthy volunteer at 7T acquired with inner volume excitation are compared to those derived from a whole brain.
Purpose
In Parkinson’s disease1, disease severity has been shown to be correlated with the quantitative susceptibility of the substantia nigra and other subcortical areas. In these diseases where the area of interest is limited to subcortical areas, it would be desirable to speed up image acquisition by reducing the FOV to the targeted area. Fast QSM2,3,4 acquisition techniques utilizing advanced parallel imaging5 and compressed sensing6 exist in the literature, however we investigate an alternative acceleration method using inner volume imaging (IVI)7 for zoomed QSM8 targeting only the region of interest. The feasibility of combining IVI with QSM at 7T was studied in simulations and zoomed QSM was demonstrated on a healthy volunteer.Methods
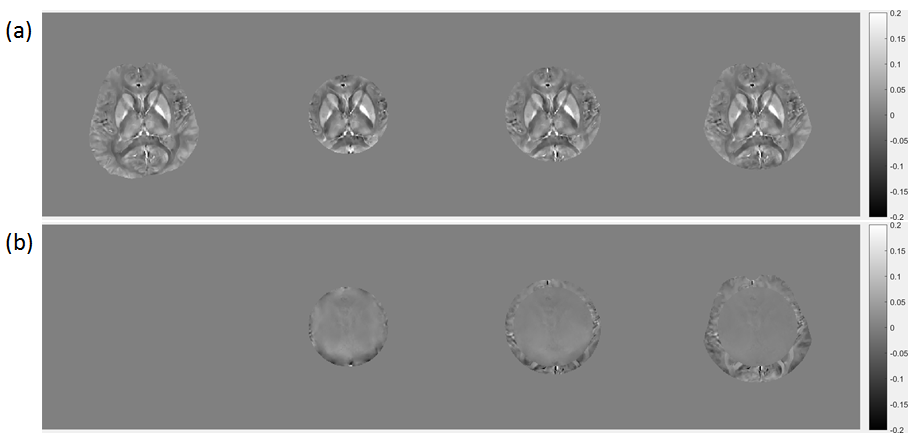
As the QSM reconstruction relies on an inversion of the dipolar field patterns from phase images, a region around the target area should be available to perform an accurate reconstruction. Furthermore, for the removal of background fields, a certain extent of the brain needs to be visible. To assess the degree to which a zoomed FOV can be used, a simulation study was performed to evaluate the feasibility of zoomed QSM. This was done by simulating IVI on a full-brain in-vivo data set (3T, MEDI toolbox9), where the diameter of a cylindrical brain mask was gradually decreased in the QSM processing pipeline (131mm, 112mm, and 94mm). The QSM reconstruction errors with a zoomed FOV were assessed by subtraction of the full brain QSM images from the zoomed QSM images.
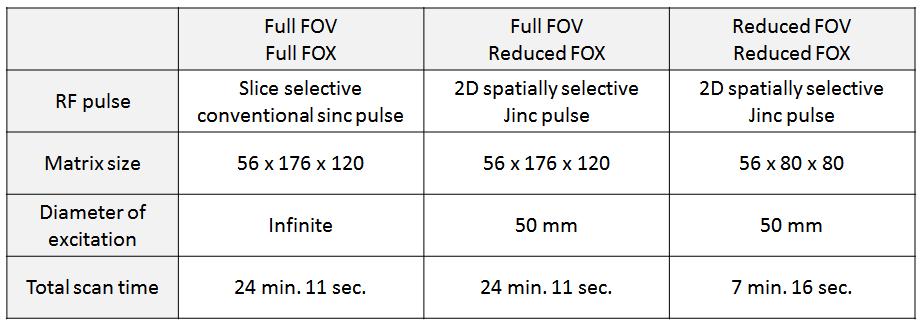
Zoomed QSM measurements were performed by exciting only the midbrain region using a spiral 2D spatially selective excitation10 with a circular localization pattern. 3D multi-echo FFE brain images were acquired in a healthy volunteer on a 7T system (Philips, Best, The Netherlands) with a 32 receive-channel head coil (Nova Medical, Wilmington, USA). All experiments were performed in accordance to local ethical guidelines. Three acquisitions were performed: full FOV with a whole brain excitation, full FOV with inner-volume excitation, and reduced FOV with inner-volume excitation. For all three imaging sequences, the common scan parameters are: voxel size = 1×1×1 mm3, eight echo times (TEs) of 2.4, 4.8, 7.2, 9.6, 12.0, 14.4, 16.8 and 19.2 ms, and flip angle (FA) = 15°. Scan time, excitation, and readout coverage for the three sequences are summarized in table 1. All QSM reconstructions were performed using the MEDI toolbox.
Results
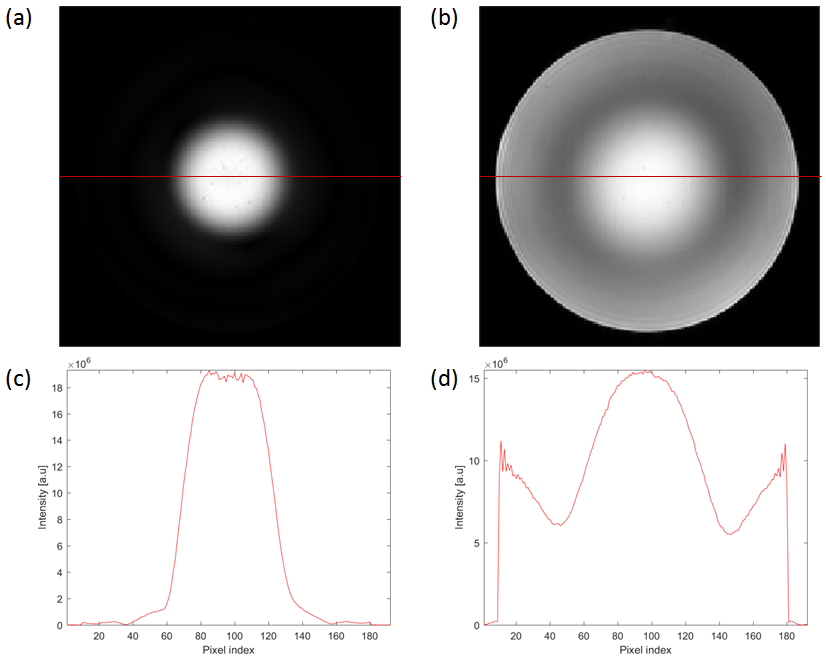
In Figure 1, the excitation profile of the spiral 2D spatially selective RF pulse was assessed. A 1D intensity profile along a diameter of the selected volume shows the localized excitation pattern.
Figure 2 shows susceptibility maps derived from simulated IVI datasets. Reducing the diameter did not impact the QSM image in the central region, although in the subtraction images some artifacts can be seen on the edge of the excited region.
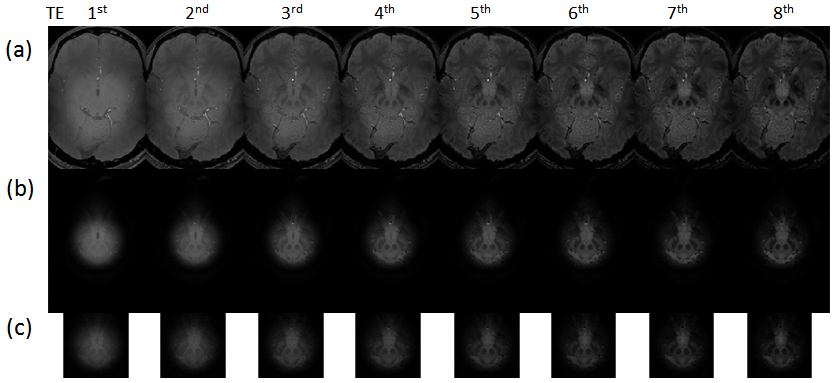
Axial slices showing the region of interest at eight different echo times (TEs) are shown in the first row of Figure 3. The same slices acquired with full FOV and inner-volume excitation and with reduced FOV and inner-volume excitation are shown in the second row and third row of Figure 3, respectively.
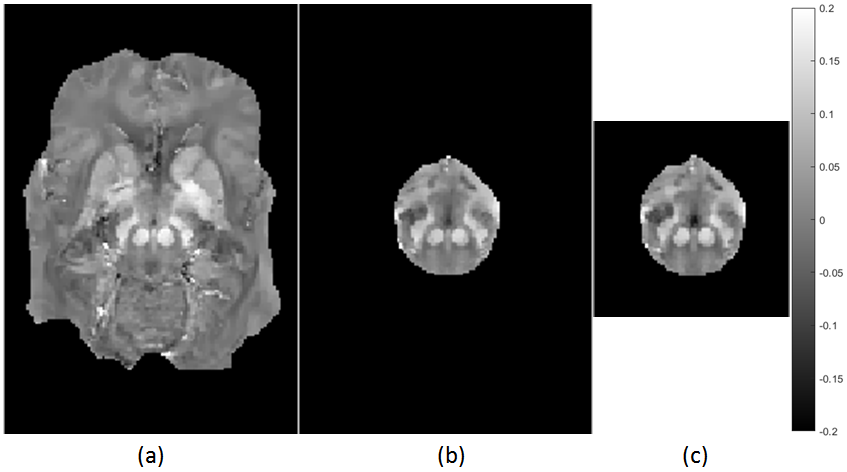
The midbrain susceptibility maps of 3 different scans were reconstructed and compared in Figure 4 and show similar data quality, despite a drastically reduced scan time for the third scan.
Discussion
A threefold scan time reduction was achieved with reduced FOV and inner-volume excitation. Although the QSM reconstruction is based on a non-local phase contrast, the major component of susceptibility effects in phase images is along the B0 magnetic field direction. No visible changes in susceptibility maps were observed, in agreement with the small error observed in the IVI simulations. Earlier studies reported increased errors with FOV smaller than 70 mm, based on simulated data from full FOV datasets; however our in vivo data does not show any significant contrast differences in the areas of interest such as the substantia nigra. This could possibly be due to difference in the regularization used for the inversion, which is part of the processing.Conclusion
QSM has earlier been shown to be a potential biomarker for early diagnosis of degenerative diseases such as Parkinson’s disease. However, the main disadvantage is the long scan times required for high resolution QSM. We reduced scan-time by a factor of 3.3 using zoomed QSM at high resolution, allowing midbrain susceptibility maps in a clinically realistic scan-time of 7 minutes without advanced image reconstruction methods. Further scan-time reduction might be achieved by combining 3D spatially selective excitation with advanced acceleration techniques5, 6, which will be pursued in future studies.Acknowledgements
This work is supported by the Danish Ministry of Higher Education (Danish Government Scholarship) and by the South Korean government (Institute for Information & Communications Technology Promotion grant MSIP 2015-0-00020).
References
1. P. Damier, E. C. Hirsch, Y. Agid, A. M. Graybiel, 1999, The substantia nigra of the human brain, Brain, vol. 122, no. 8, pp. 1437-1448
2. Haacke, EM and Liu, S and Buch, S and Zheng, W and Wu, D and Ye, Y, Quantitative susceptibility mapping: current status and future directions., Magn Reson Imaging 33(1):1-25 (2015)
3. Reichenbach, JR and Schweser, F and Serres, B and Deistung, A, Quantitative Susceptibility Mapping: Concepts and Applications., Clin Neuroradiol 25(2):225-30 (2015)
4. Yi Wang, Tian Liu, 2014, Quantitative susceptibility mapping (QSM): Decoding MRI data for a tissue magnetic biomarker, Magnetic Resonance in Medicine, vol. 73, no. 1, pp. 82-101
5. Berkin Bilgic, Borjan A. Gagoski, Stephen F. Cauley, Audrey P. Fan, Jonathan R. Polimeni, P. Ellen Grant, Lawrence L. Wald, Kawin Setsompop, 2015, Wave-CAIPI for Highly Accelerated 3D Imaging, Magnetic Resonance in Medicine, vol. 73, pp. 2152-2162
6. Bing Wu, Wei Li, Arnaud Guidon, Chunlei Liu, 2011, Whole brain susceptibility mapping using compressed sensing, Magnetic Resonance in Medicine, vol. 67, no. 1, pp. 137-147
7. D A Feinberg, J C Hoenninger, L E Crooks, L Kaufman, J C Watts, M Arakawa, 1985, Inner volume MR imaging: technical concepts and their application., Radiology, vol. 156, no. 3, pp. 743-747
8. Ahmed M. Elkady, Hongfu Sun, Alan H. Wilman, 2016, Importance of extended spatial coverage for quantitative susceptibility mapping of iron-rich deep grey matter, Magnetic Resonance Imaging, vol. 34(4), pp. 574-578
9. Tian Liu, Weiyu Xu, P. Spincemaille, A. S. Avestimehr, Yi Wang, 2012, Accuracy of the Morphology Enabled Dipole Inversion (MEDI) Algorithm for Quantitative Susceptibility Mapping in MRI, IEEE Transactions on Medical Imaging, vol. 31, no. 3, pp. 816-824
10. John Pauly, Dwight Nishimura, Albert Macovski, 1989, A k-space analysis of small-tip-angle excitation, Journal of Magnetic Resonance (1969), vol. 81, no. 1, pp. 43-56
Figures