2192
Effects of Motion in Quantitative Susceptibility Mapping of Brain1Biomedical Engineering, University of Alberta, Edmonton, AB, Canada
Synopsis
Typical Quantitative Susceptibility Mapping (QSM) sequences have a long acquisition time which may yield motion artifacts that alter magnitude, phase and susceptibility values in the brain. Simulations and motion experiments were conducted on patients suspected of stroke and healthy volunteers to calculate the variations of susceptibility, magnitude and local field in brain. Variations between susceptibility and magnitude images were compared. In general, magnitude images were found to be more affected by motion than QSM in the brain areas studied.
Introduction
Quantitative Susceptibility Mapping (QSM) is a post processing technique from gradient echo images which has been applied to study multiple sclerosis, hematoma, microbleeds, calcification etc1-5. Typical QSM sequence acquisition time is ~5 minutes during which patient motion may occur. Motion artifacts affecting the magnitude and phase image are translated to QSM through the reconstruction process, potentially leading to artefactual susceptibility values and image distortion.Purpose
To investigate the effects of motion on QSM in brain using simulation, volunteer and patient studies and compare to magnitude and local phase images from the same sequence.Methods
Acquisition: Magnitude and phase images were obtained from 3D gradient echo sequences at 3T for healthy volunteers and patients with suspected stroke. Imaging parameters were: flip angle = 150, TE=20ms, TR=27ms, Number of slices=72 or 80, Acquisition time= 3.5 or 5 mins, Resolution=0.68mmX0.68mmX1.8mm or 0.85mmX0.85mmX1.3mm). To evaluate actual motion patterns, time series Echo Planar Imaging (EPI) was also performed with images every 2 seconds for 8 minutes.
Reconstruction: QSM reconstruction was conducted by unwrapping the phase using PRELUDE (Phase Region Expanding Labeller for Unwrapping Discrete Estimates), extracting the brain followed by a background removal with RESHARP (Regularization Enabled Sophisticated Harmonic Artifact Reduction for Phase data) and finally total variation dipole inversion was performed6.
Subjects: Twenty-one patients from a clinical stroke research study were examined retrospectively to determine evidence of motion artifact on QSM. Ten of these patients had motion artifact on magnitude images ranging from ringing artifact to substantial signal destruction resulting in masking out of frontal brain in the corresponding QSM. Those with observed motion artifact were included in the study as anecdotal examples. Motion patterns were then simulated and applied to uncorrupted data in 8 subjects. Actual measured motion patterns were simulated from additional time series EPI studies. Additional motion experiments were performed to collect data from a volunteer while staying still, taking deep breaths and moving head sharply 8 times during the scan. All images were collected using a 64-channel receiver head-neck, with additional padding to minimize the subject motion.
Simulation: Actual translational motion plots obtained from a 8 minute EPI study were used to simulate 3D motion effects on the k-space of the 3D GRE acquisition prior to reconstruction. Motion patterns were also simulated based on types of artifacts seen in stroke images. Two motion patterns applied were repeated rhythmic head displacement of 4.25mm and return in 10s with repetition every 30s and sharp displacement of 4.25mm in the last one third of the acquisition time.
Results
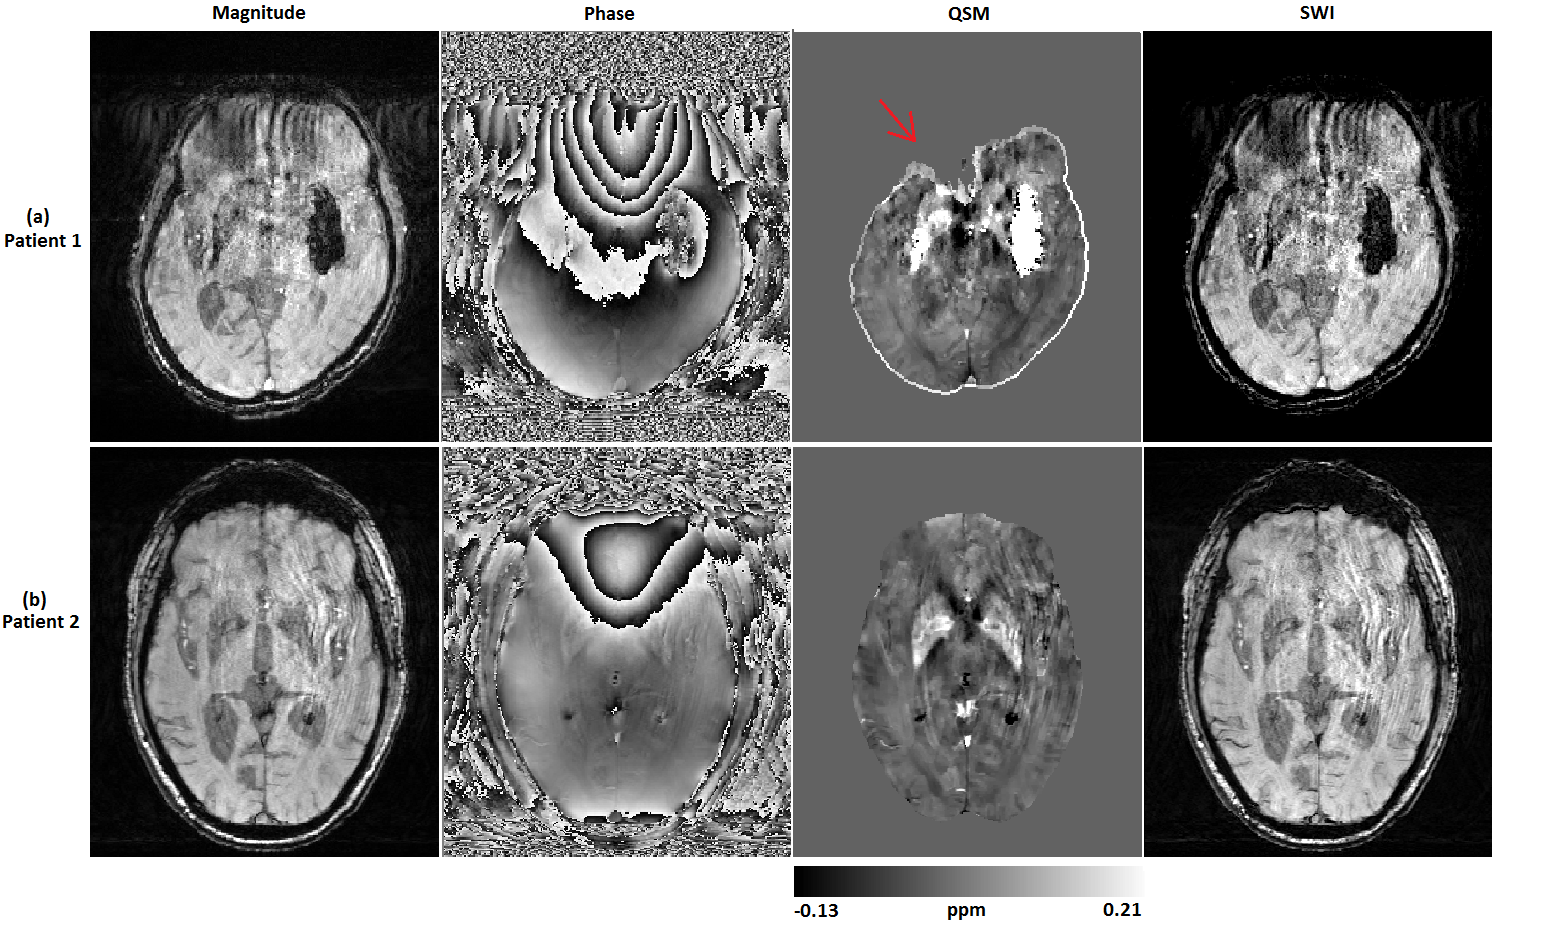
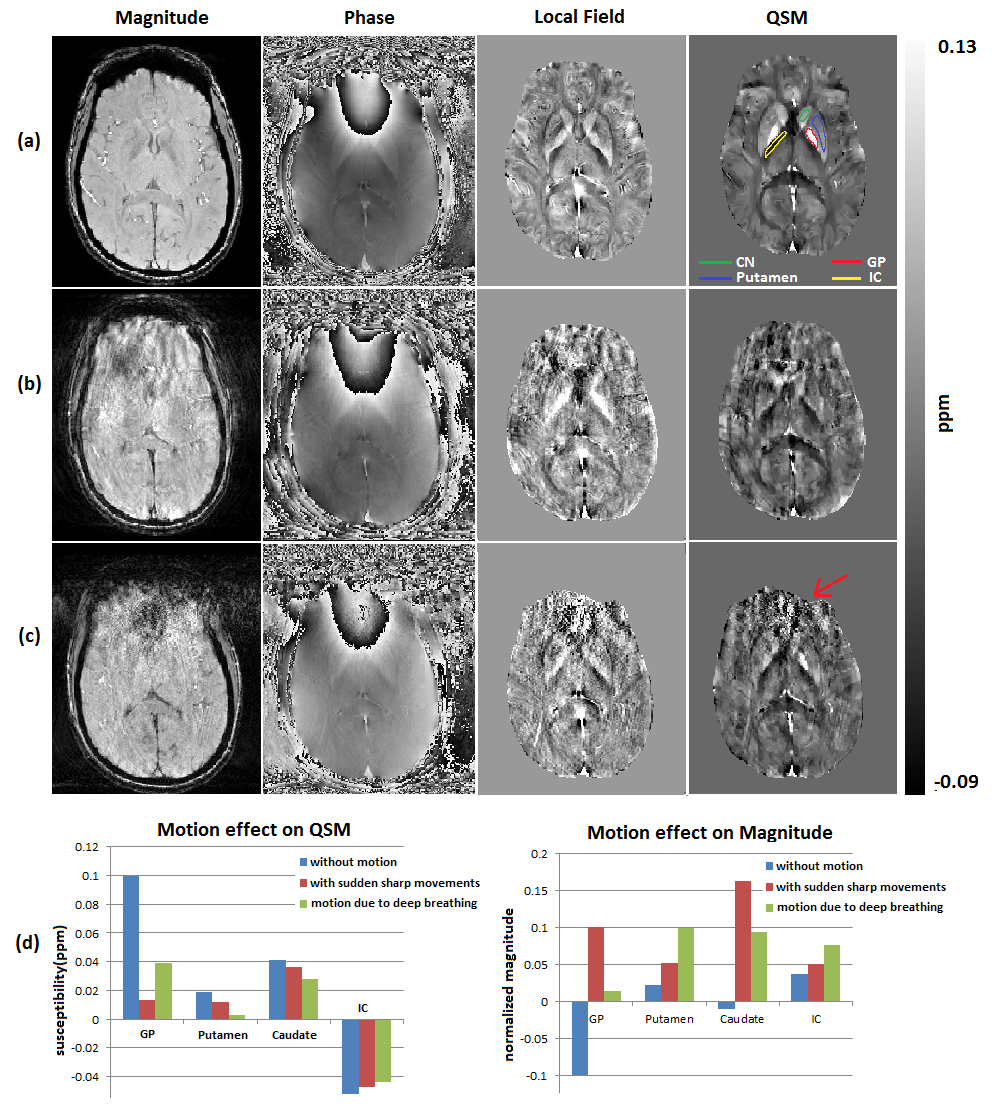
Motion in stroke patients mostly caused ringing artifact, blurring in images or frontal brain distortion due to deep breathing. Examples from stroke subjects are shown in Fig 1.
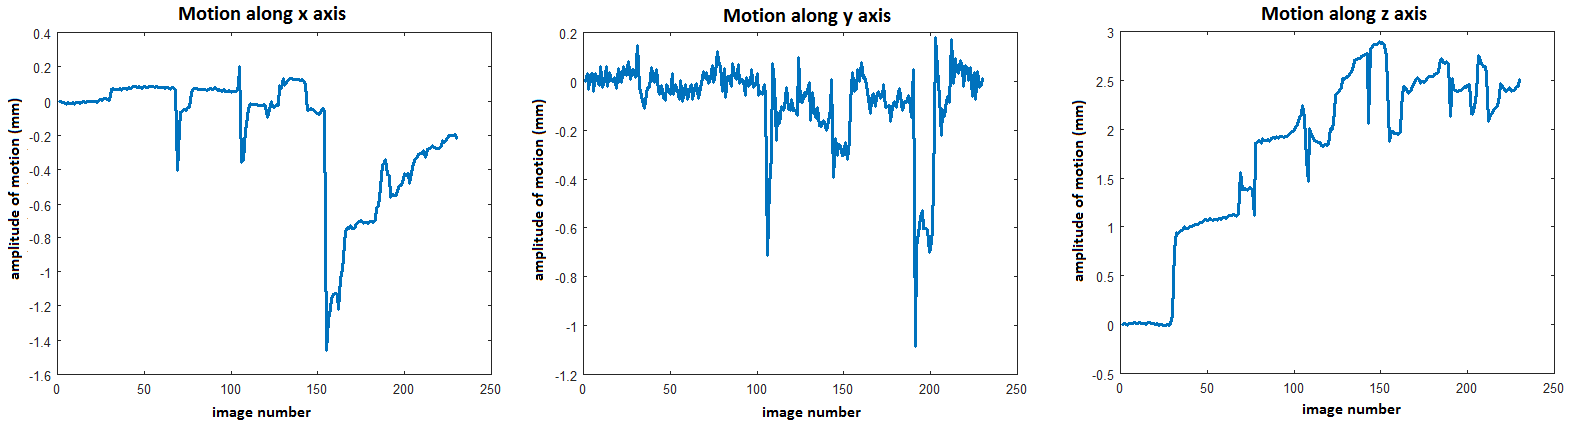
Fig 2 shows real-time motion extracted from time series EPI using Statistical Parameter Mapping (SPM) for a severe motion case which was used to form the simulated motion for Fig. 3b. Since the motion was severe, the amplitude of the motion was halved for simulation.
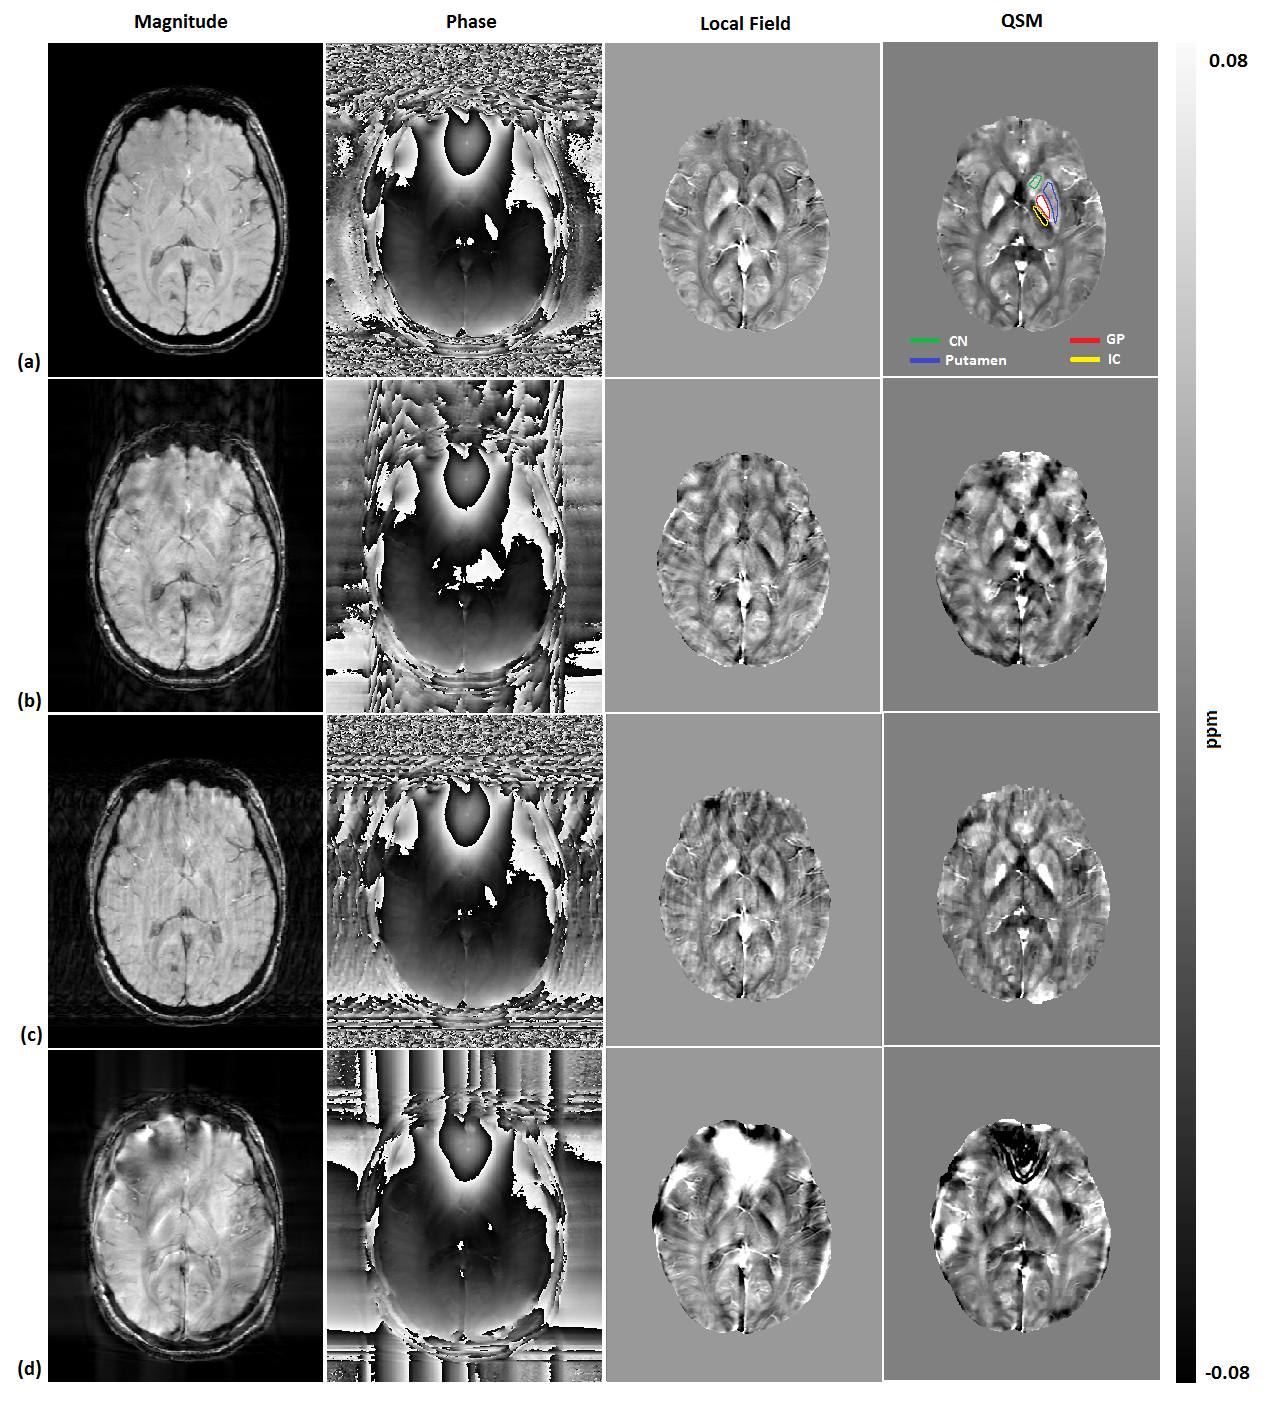
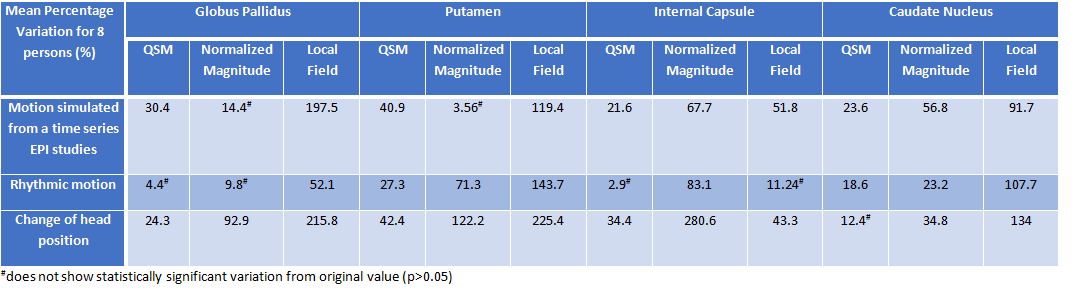
In Fig 3, the effects of different motion patterns were simulated, beginning with a motion-free volunteer result. Fig 4 shows effects of actual head movements of a volunteer and also includes a bar graph with variations in susceptibility and magnitude for this case. The mean results from these motion patterns applied to 8 volunteers are shown in Table 1. A paired t-test was conducted to determine significant difference between values (p<0.05). The local field, magnitudes and QSM values showed significant change for most motion patterns. The local field was observed to be highly sensitive to motion. In general, magnitude images were more greatly affected by motion than QSM, even though QSM starts with highly motion sensitive phase images.
Discussion and Conclusion
Sensitivity of susceptibility and normalized magnitude to motion was found to be dependent on the location in the brain, susceptibility strength and nature of motion that was applied. Local field was observed to be most sensitive to motion. Somewhat surprisingly, magnitude images were found to be more greatly affected by motion than QSM in the areas studied, which were limited to deep grey matter. The regularization process of QSM may smooth motion effects to some degree. Although less sensitive than magnitude, QSM showed significant variation due to motion and hence post-processing motion corrections or much faster sequences (like EPI-QSM) need to be considered, particularly for clinical applications in motion-prone diseases, such as stroke.Acknowledgements
Research support from Canadian Institutes of Health Research.
We thank Mitacs for their Globalink Graduate Fellowship to A.D.
References
1. Langkammer C, Liu T, Khalil M, Enzinger C, Jehna M, Fuchs S, Fazekas F, Wang Y, Ropele S. Quantitative susceptibility mapping in multiple sclerosis. Radiology. 2013 May;267(2):551-9.
2. Wang S, Lou M, Liu T, Cui D, Chen X, Wang Y. Hematoma volume measurement in gradient echo MRI using quantitative susceptibility mapping. Stroke. 2013 Aug;44(8):2315-7
3. Chen W, Zhu W, Kovanlikaya I, Kovanlikaya A, Liu T, Wang S, Salustri C, Wang Y. Intracranial calcifications and hemorrhages: characterization with quantitative susceptibility mapping. Radiology. 2014 Feb; 270(2):496-505.
4. Liu T1, Surapaneni K, Lou M, Cheng L, Spincemaille P, Wang Y. Cerebral microbleeds: burden assessment by using quantitative susceptibility mapping. Radiology. 2012 Jan;262(1):269-78.
5. Chang S, Zhang J, Liu T, Tsiouris AJ, Shou J, Nguyen T, Leifer D, Wang Y, Kovanlikaya I. Quantitative Susceptibility Mapping of Intracerebral Hemorrhages at Various Stages. J Magn Reson Imaging. 2016 Aug;44(2):420-5.
6. Sun H & Wilman AH. Background field removal using spherical mean value filtering and Tikhonov regularization. Magn Reson Med 2013:71:1151-7.
Figures