2190
COSMOS for Estimating Variation in Single Orientation Quantitative Susceptibility Mapping of the Brain: An Ultra High Field Study1Melbourne Brain Centre Imaging Unit, Department of Anatomy and Neuroscience, University of Melbourne, Parkville, Australia, 2Department of Radiology, University of Calgary, Calgary, AB, Canada
Synopsis
The purpose of this study was to use high resolution Calculation of susceptibility through Multiple Orientation Sampling (COSMOS) reconstructed QSM (QSMc) as a gold standard to estimate the variation, distribution and magnitude of a single orientation QSM reconstruction pipeline. QSMc processing is an emerging technique for overcoming artefacts characteristic of single orientation QSM (QSMs). However it requires at least 4 fold increases in image acquisition times or reductions in resolution and SNR. We sought to produce high resolution QSMc reference datasets from healthy subjects to quantify the differences from QSMs values across a variety of cortical and subcortical brain regions.
Introduction
Quantitative susceptibility mapping (QSM) is an emerging technique for imaging brain microstructure and is particularly sensitive to brain iron, which is present in deep grey matter structures. Application of QSM to other brain areas, such as the cortex, is of increasing interest in assessments of cortical pathology in multiple sclerosis[1] and Alzheimer’s disease, with recent work showing cortical QSM may be a marker for onset of cognitive decline[2]. QSM is typically acquired with the subject in a single orientation in the scanner but certain brain microstructure, particularly cortex, may not be accurate due to reconstruction artefacts at the edge of the brain. Calculation of Susceptibility through Multiple Orientation Sampling (COSMOS) is the gold-standard technique for QSM[3,4] and combines a number of head orientations to complete information about the underlying dipole field. Given the potential uncertainty in studies reliant on single-orientation QSM, we sought to create high resolution 7 Tesla COSMOS QSM as reference datasets from healthy subjects. These were then compared to single orientation images in an initial exploration of differences across a variety of brain regions.Methods
All imaging was conducted with approval of the University of Melbourne Human Research Ethics Committee. 6 healthy subjects (4 males, 2 females, aged 25-38 years) volunteered for this study. MRI was conducted on a 7T research system (Siemens Healthcare, Erlangen, Germany), using a 32-channel receive/volume transmit head coil (Nova Medical, Wilmington MA, USA). 4-echo monopolar 3D gradient-echo images were acquired for QSM calculation (TEs/TR/FA:4.8-15.45ms(ΔTE=3.55ms)/18ms/9°,0.6mm-iso) in five head orientations relative to B0: neutral (parallel to field), neck flexed forward, neck extended, and left and right tilted head positions. All volume planes were aligned with the AC-PC line. An MP2RAGE T1-weighted structural image (TE/TR/TIs/FAs:2.9ms/4.9s/0.7+2.7s/5+6°, 0.9mm-iso resolution) was acquired in the neutral position. Post-processing: MP2RAGE-UNIDEN anatomical volumes were affine registered (niftyReg, TIG, University College London) to a bias-field corrected version of the 1st echo image used for QSM. MP2RAGE-UNIDEN anatomical volumes were then processed in Freesurfer (v6.0, MGH). QSM processing: Phase unwrapping was performed with the best-path method [5], background phase removal using RESHARP [6] with a 1mm spherical kernel radius and final QSM calculation using iLSQR [7]. COSMOS processing was performed by a direct dipole inversion in the least-squares formation by combining the local field maps from 5 orientations. Regions from the Freesurfer ‘aparc+aseg’ segmentation volume were used to create regional volumes and generate cortical surfaces.Results
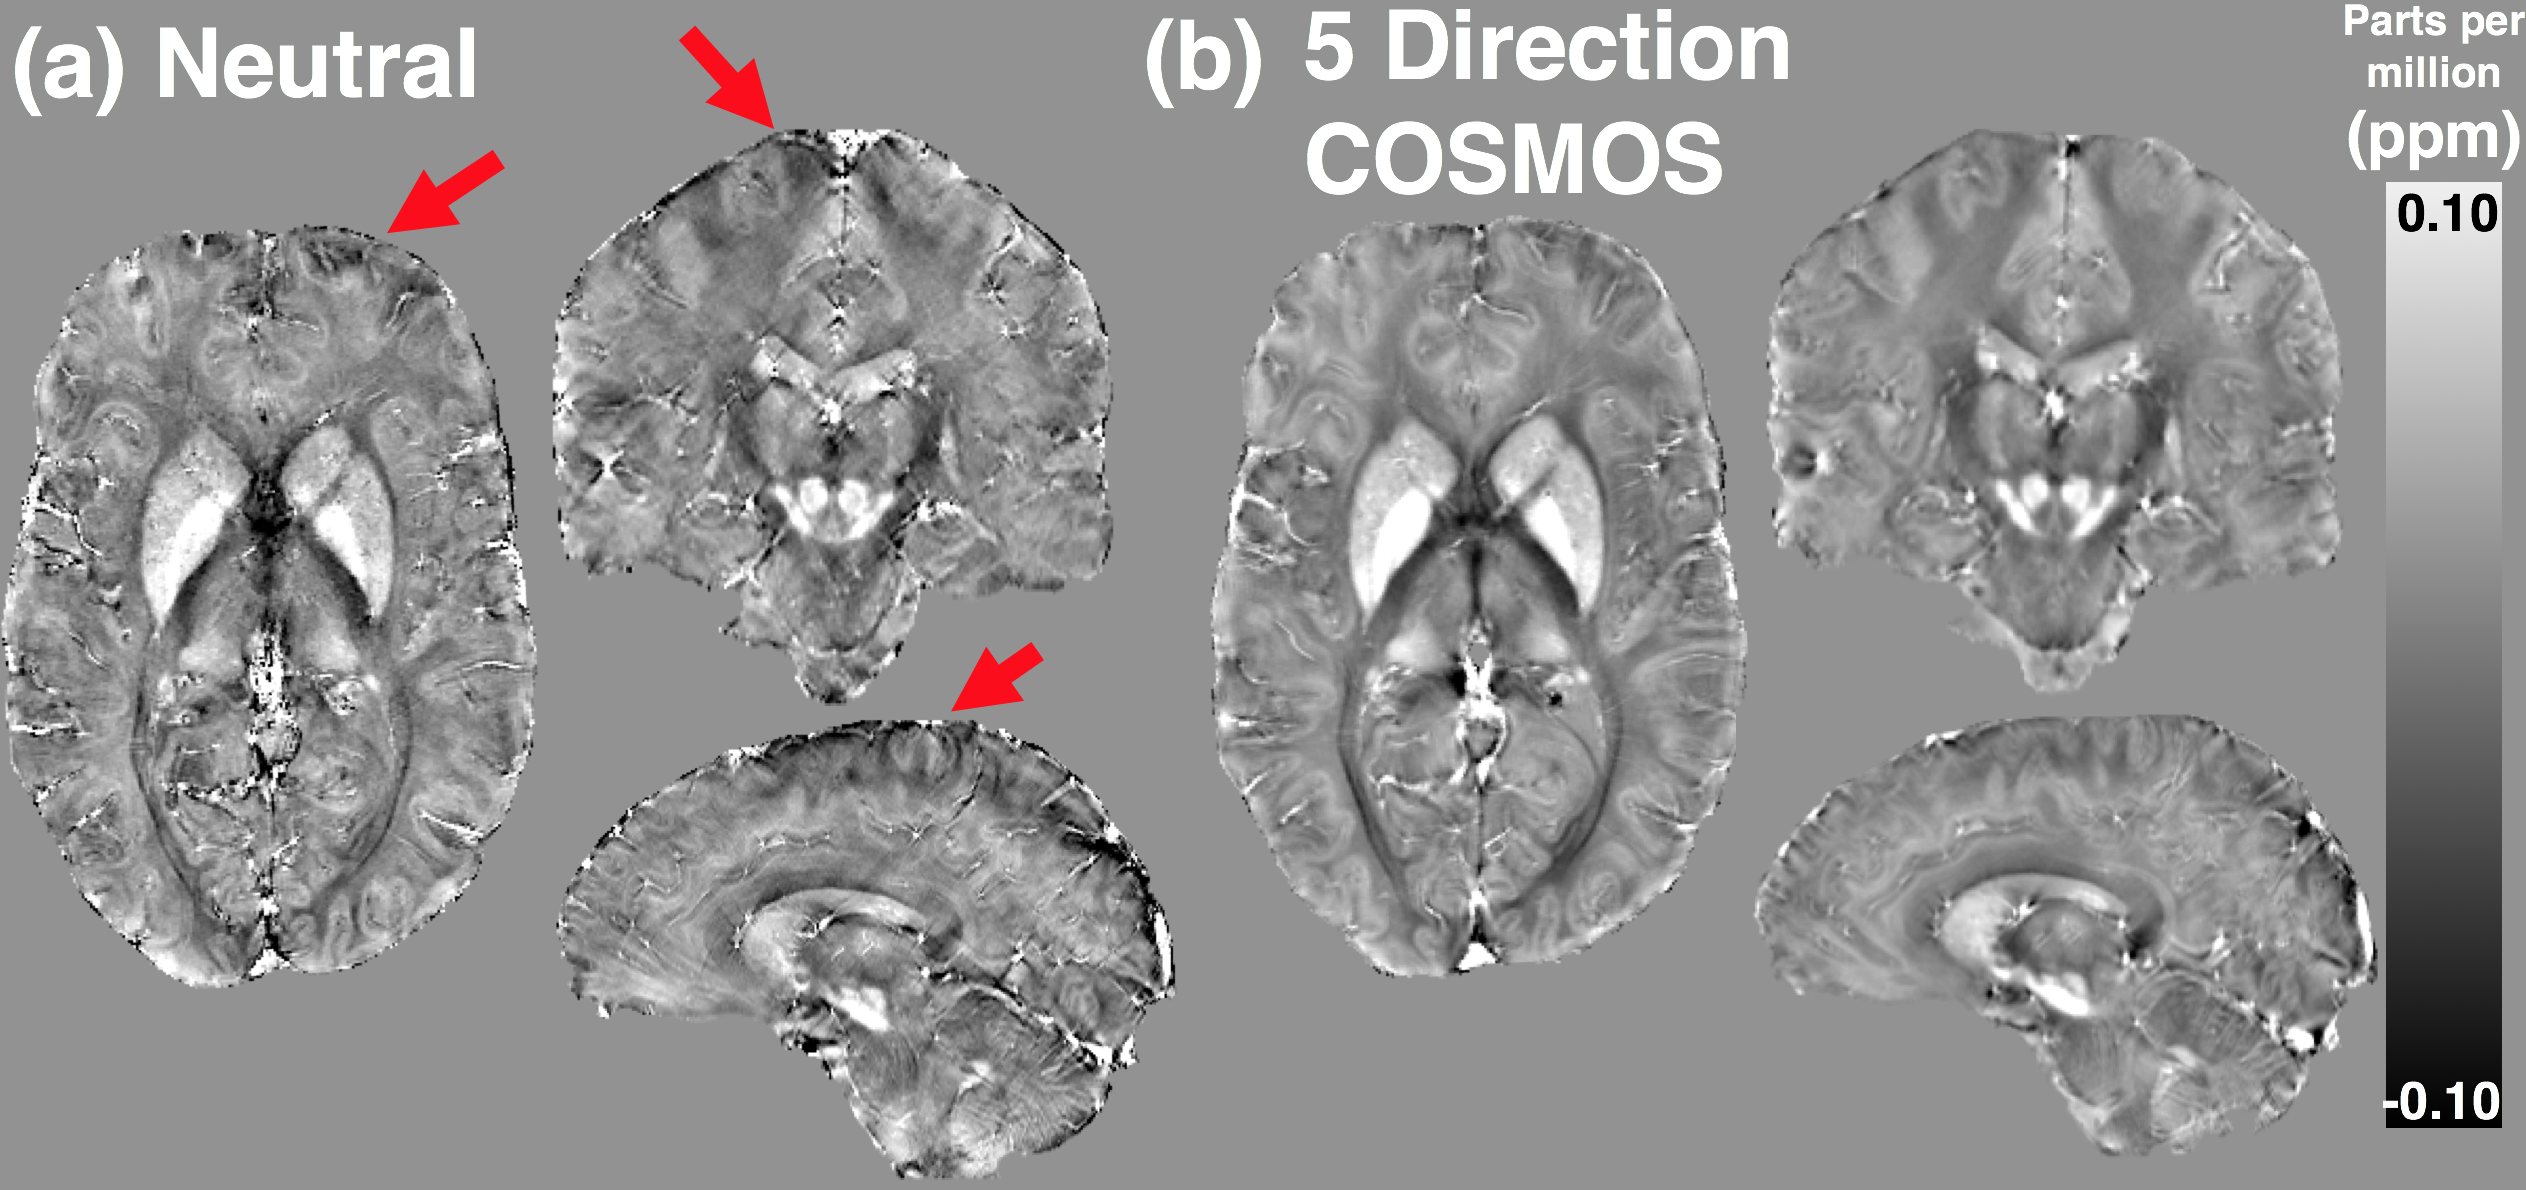
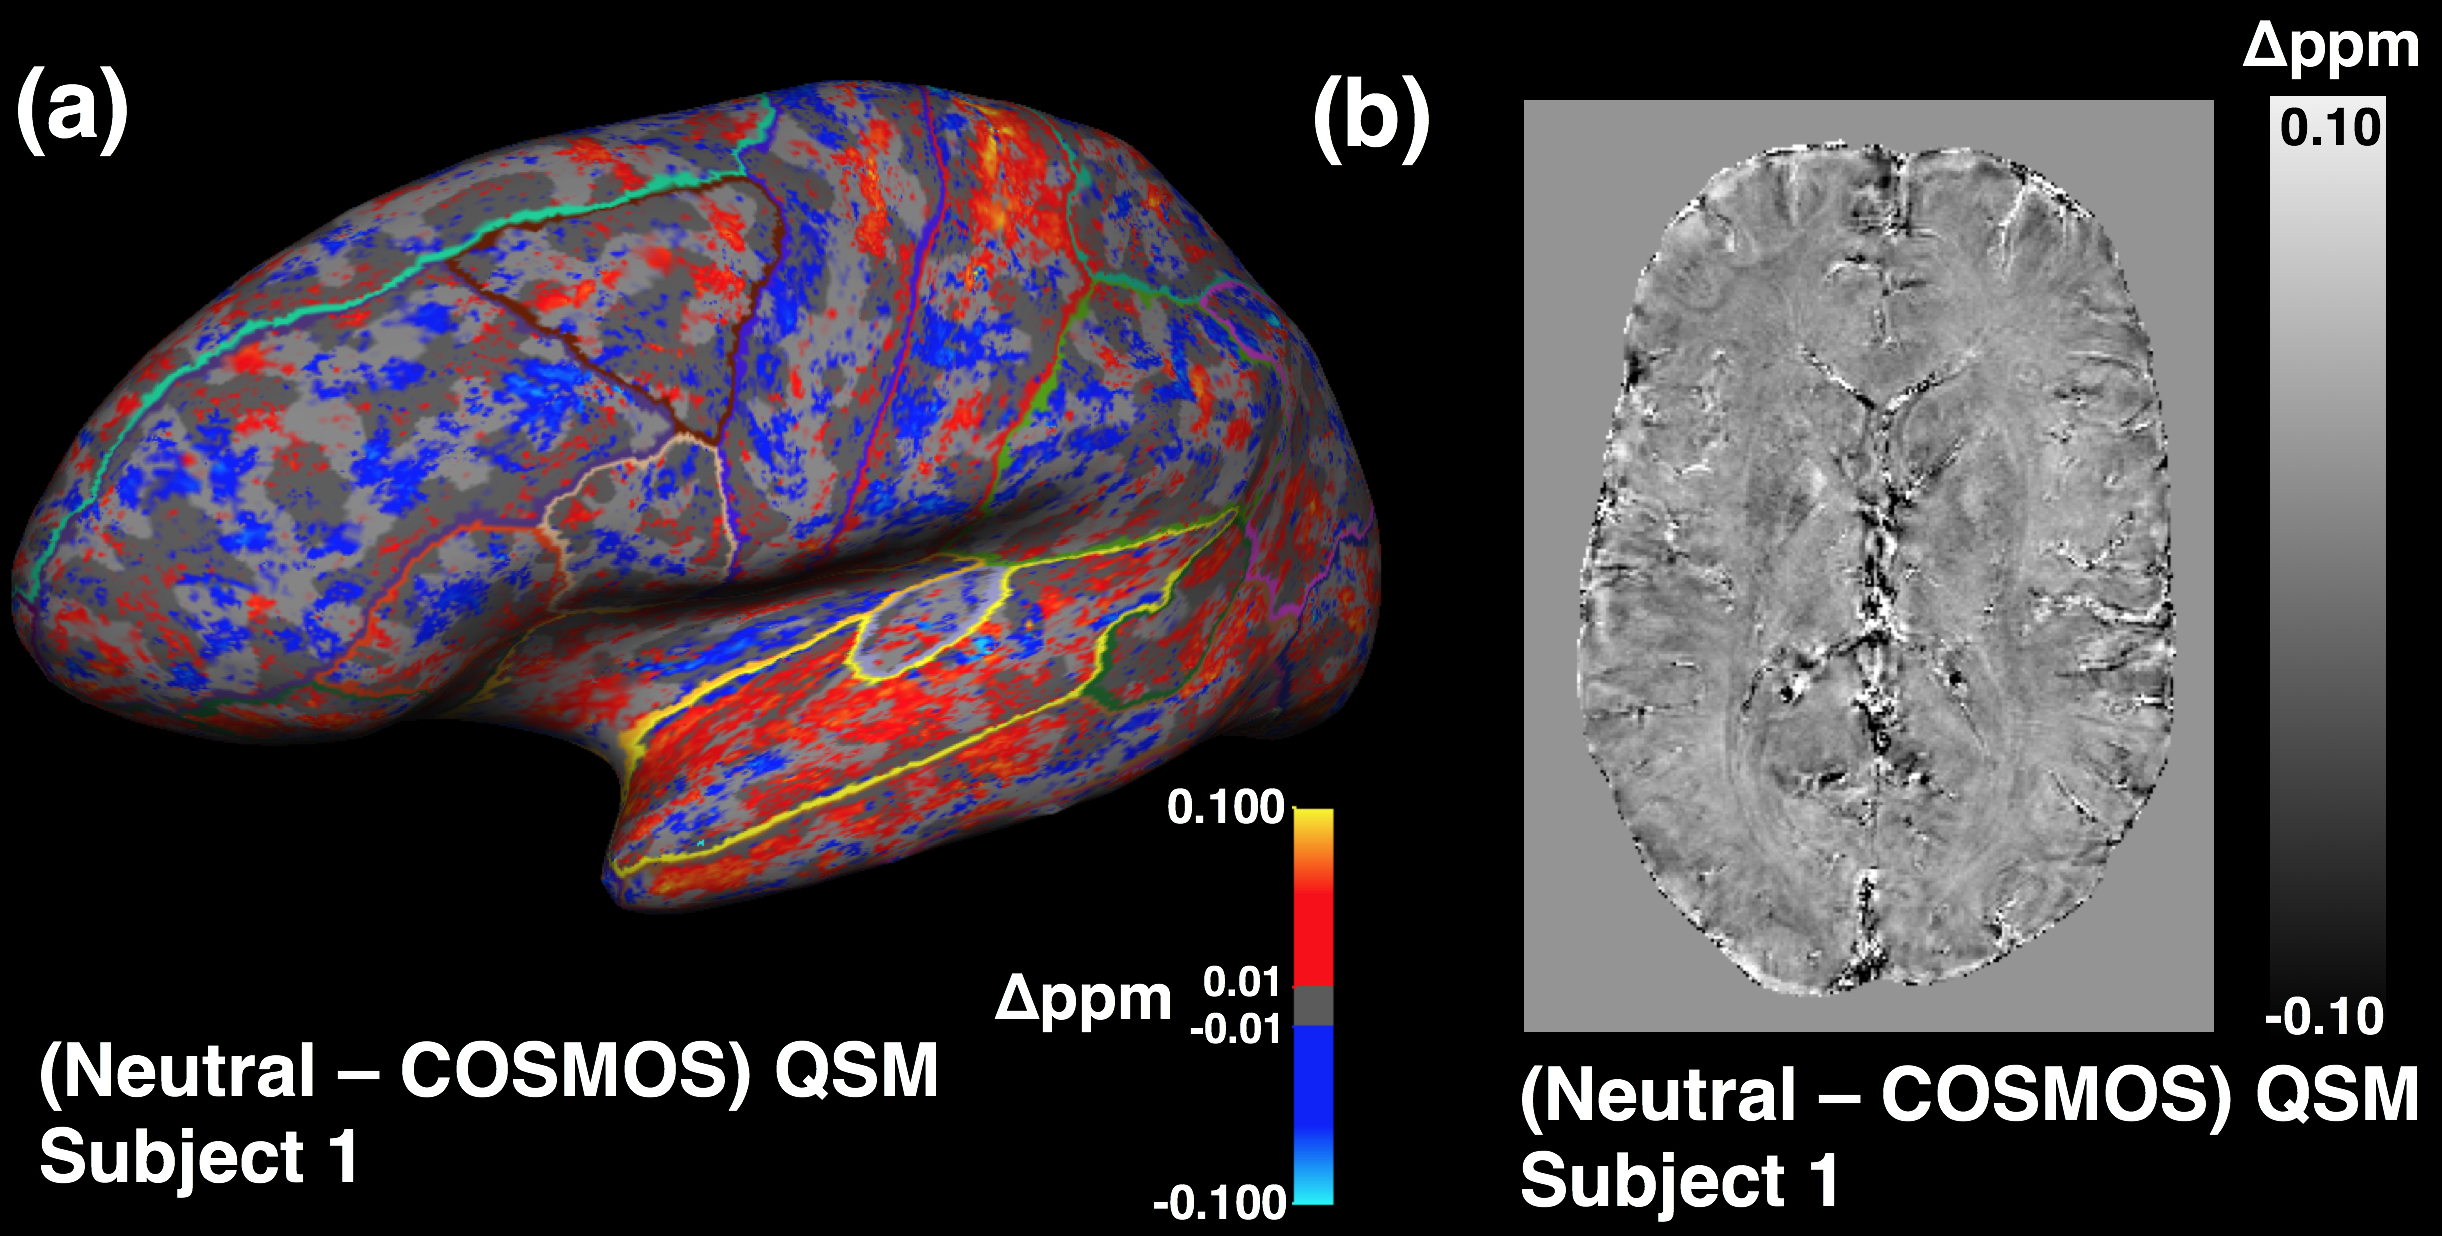
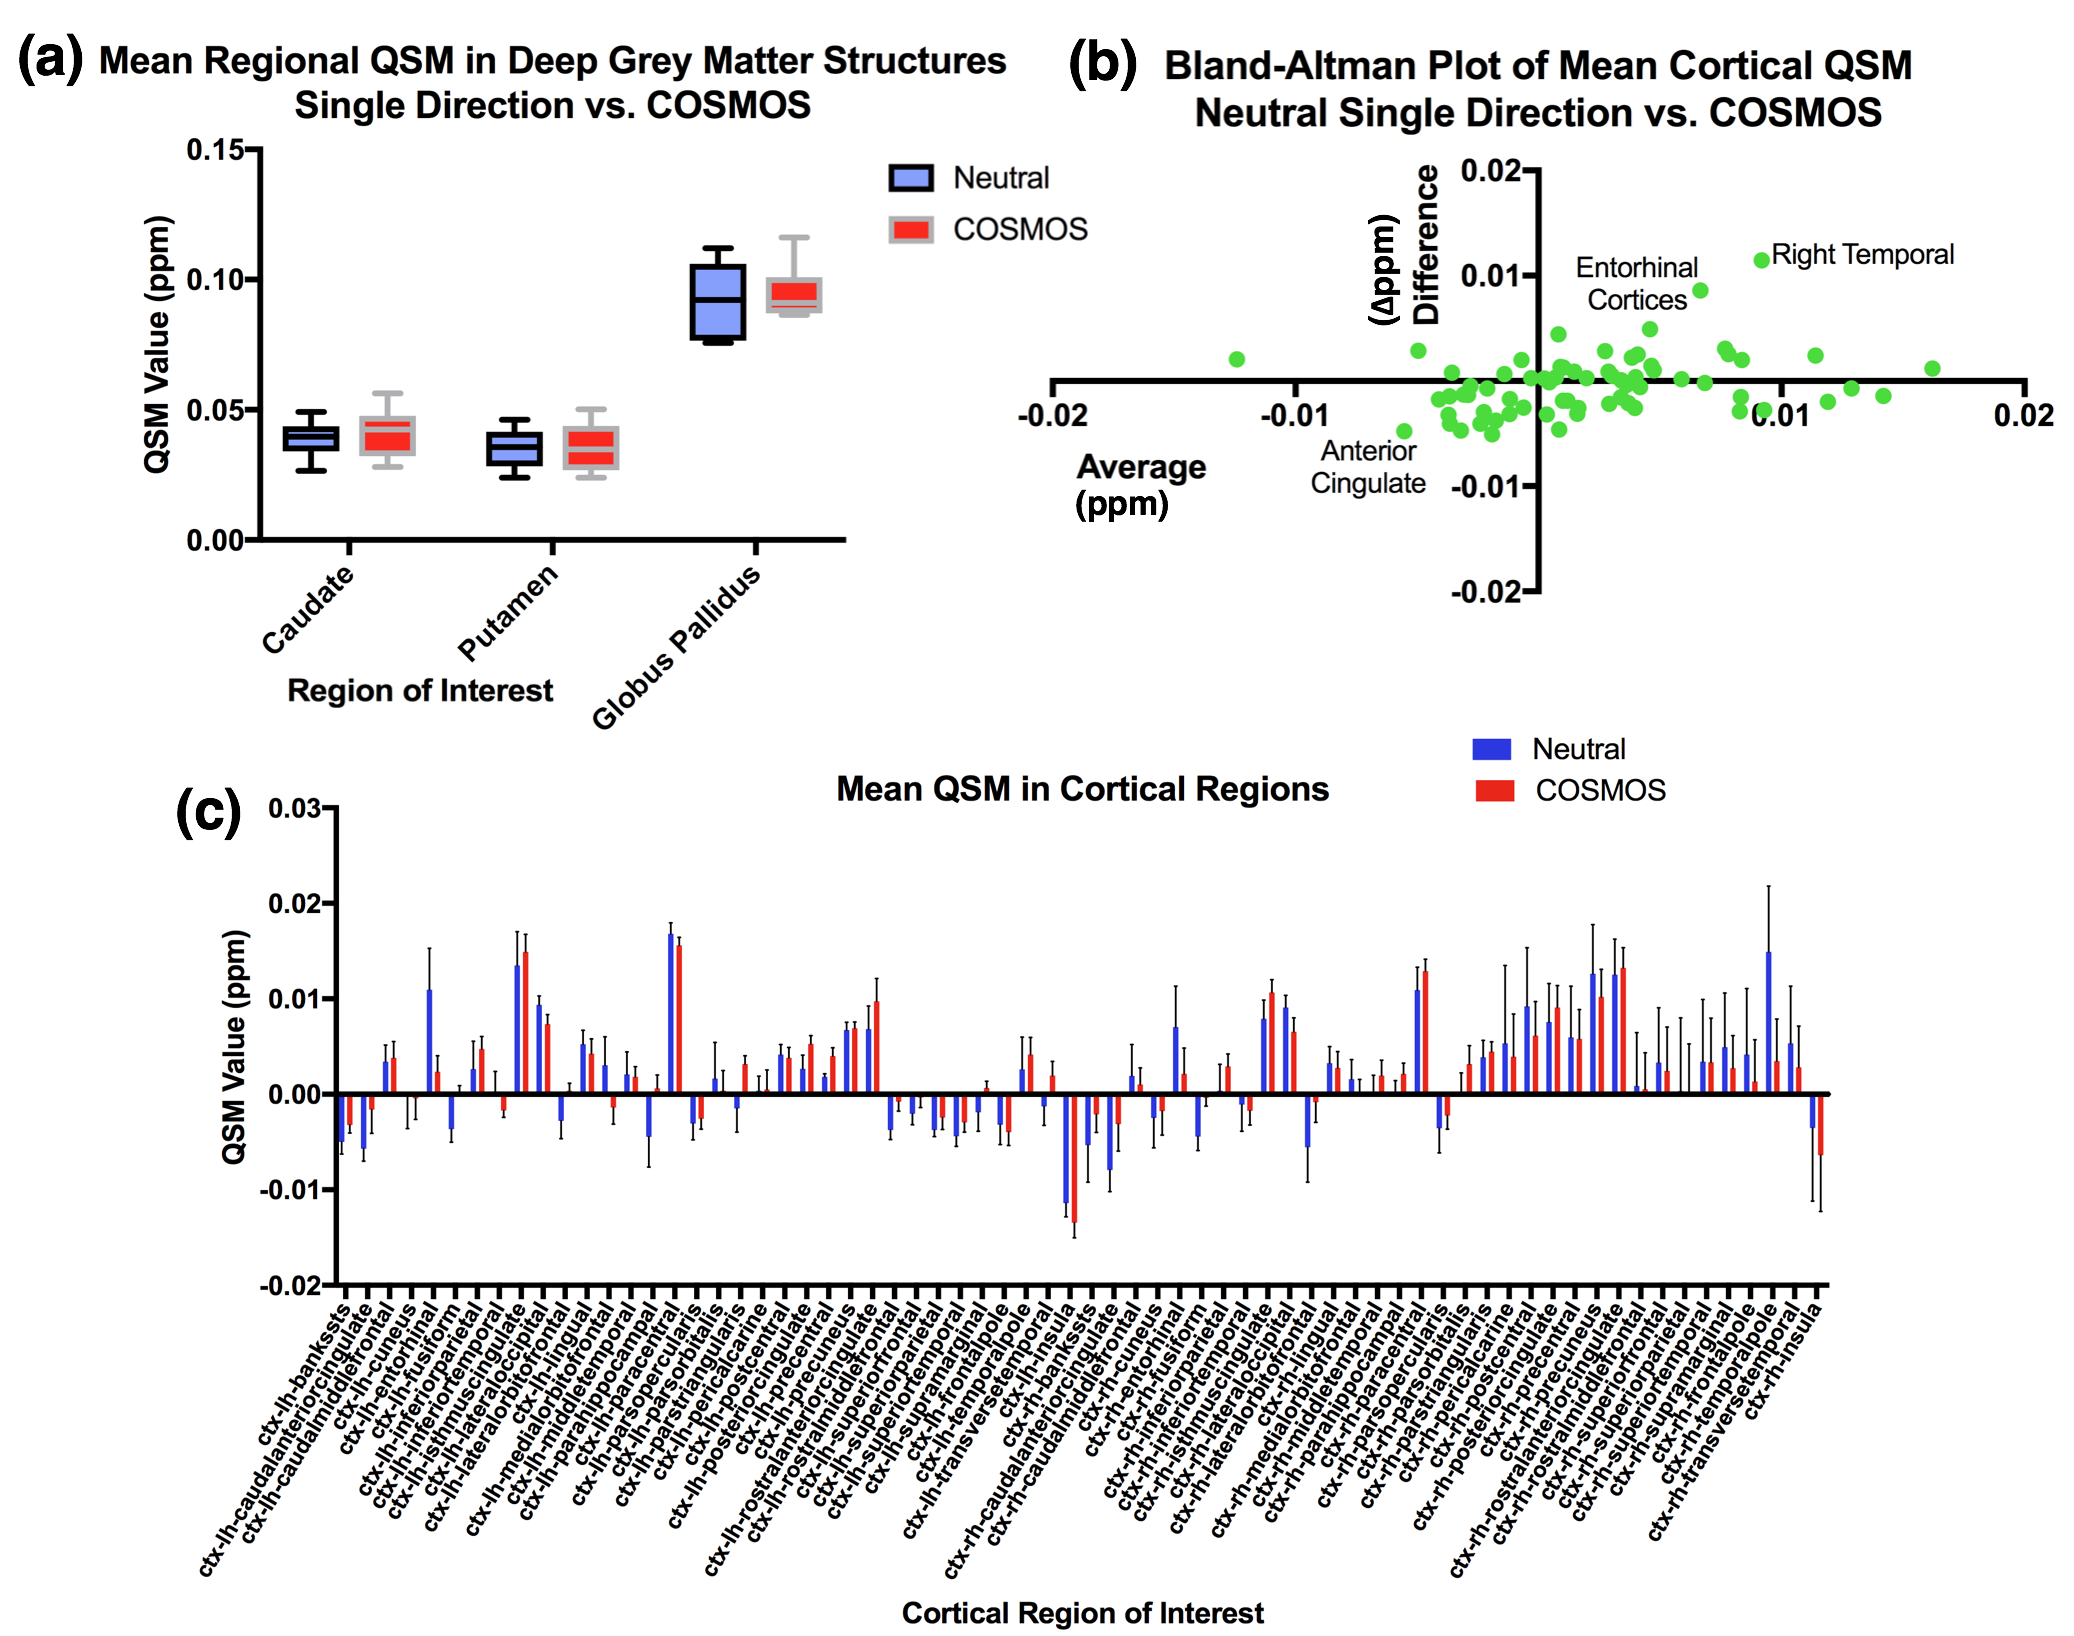
As shown in the representative subject in Figure 1, high-quality 0.6mm isotropic QSM maps were produced by the single and multi-orientation gradient-echo datasets with both neutral and five-direction COSMOS displaying similar QSM values. The COSMOS maps were observed to have significantly less artefact, particularly in frontal and parietal regions. Difference maps of the neutral and COSMOS QSM datasets showed generally uniform contrast (Figure 2b) but when viewed on a 3D surface some anatomical correspondence may be noted (Figure 2a). Mean QSM values were calculated for both deep grey and cortical regions and no significant difference seen in single and COSMOS QSM values after segmentation of deep grey matter structures (Figure 3a). A Bland-Altman plot of the difference vs. the mean of the two maps (Figure 3b) identified cortical parcellations at the limits of the agreement between the two images such as the entorhinal cortices and anterior cingulate.Conclusion
This exploratory investigation has shown no significant difference between mean QSM values in the deep grey matter indicating their high iron content confers a high enough susceptibility to be measured accurately without need for multiple orientations. In the cortex, we found two regions were there was a significant difference between QSM values from the two methods indicating a single orientation may be inaccurate in these areas. The construction of an open source high-resolution COSMOS atlas and standard brain has the potential to be an extremely valuable resource for standardising QSM algorithms, and thus giving QSM a pathway to becoming a validated imaging biomarker.Acknowledgements
JOC is supported by a University of Melbourne McKenzie Fellowship. We thank Siemens Healthcare for access to the works-in-progress MRI sequences mentioned. The MBCIU 7T MRI system and BAM are supported by the Australian National Imaging Facility (NIF). High-performance computing support provided by the Multi-modal Australian ScienceS Imaging and Visualisation Environment (MASSIVE).References
[1] In Vivo 7T MR Quantitative Susceptibility Mapping Reveals Opposite Susceptibility Contrast between Cortical and White Matter Lesions in Multiple Sclerosis. Bian W, Tranvinh E, Tourdias T, Han M, Liu T, Wang Y, Rutt B, Zeineh MM. AJNR Am J Neuroradiol. 2016 Jun 9.
[2] Cerebral quantitative susceptibility mapping predicts amyloid-β-related cognitive decline. Ayton S, Fazlollahi A, Bourgeat P, Raniga P, Ng A, Lim YY, Diouf I, Farquharson S, Fripp J, Ames D, Doecke J, Desmond P, Ordidge R, Masters CL, Rowe CC, Maruff P, Villemagne VL; Australian Imaging Biomarkers and Lifestyle (AIBL) Research Group, Salvado O, Bush AI. Brain. 2017 Aug 1;140(8):2112-2119
[3]Liu, Tian; Spincemaille, Pascal; De Rochefort, Ludovic; Kressler, Bryan; et al. (2009). Calculation of susceptibility through multiple orientation sampling (COSMOS): A method for conditioning the inverse problem from measured magnetic field map to susceptibility source image in MRI". Mag Reson Med. 61 (1): 196–204.
[4]Wharton, Sam; Schäfer, Andreas; Bowtell, Richard (2010). Susceptibility mapping in the human brain using threshold-based k-space division. Mag Reson Med. 63 (5): 1292–304.
[5]Abdul‐Rahman HS, Gdeisat MA, Burton DR, Lalor MJ, Lilley F, Moore CJ. Fast and robust three‐dimensional best path phase unwrapping algorithm. Appl. Opt. 2007; 46(26): 6623–6635.
[6]Sun H, Wilman AH. Background field removal using spherical mean value filtering and Tikhonov regularization. Magn Reson Med. 2014 Mar;71(3):1151-7.
[7]Li W, Wang N, Yu F, Han H, Cao W, Romero R, Tantiwongkosi B, Duong TQ, Liu C. A method for estimating and removing streaking artifacts in quantitative susceptibility mapping. Neuroimage. 2015 Mar;108:111-22.
Figures