2189
Incremental modeling in DCE-MRI in gliomasMagne Kleppestø1, Christopher Larsson1, and Atle Bjørnerud1
1Oslo University Hospital, Oslo, Norway
Synopsis
This work compares three kinetic models for evaluation of DCE-MRI in high-grade gliomas: the Tofts-Kermode (TK) model, the extended Tofts model (ETM) and the two-compartment exchange (TCE) model. 25 patients underwent a combined 238 examinations, and kinetic analysis was performed using the three models. In tumor regions where the data was better fitted using TK or TCE, median Ktrans estimates obtained from this model was compared to that from using ETM. It was found that in tumor regions in which TCE provides the best fit, median Ktrans was significantly underestimated when applying ETM.
Introduction
Dynamic Contrast-Enhanced (DCE)-MRI uses tracer kinetic modeling for estimation of functional parameters. Several models are in use, ranging from one- to four-parameter models. A more advanced model will often provide a better fit, but it is generally recommended to use the simplest model that explains the data1. The model most commonly used at present in gliomas is the Extended Tofts Model2 (ETM), which is a three parameter model that produces estimates of blood volume (vp), extravascular, extracellular space (ve) and leakage of contrast agent through the blood-brain barrier (Ktrans). The aim of this study was to investigate the consequence for estimates of Ktrans when the ETM is applied in tumor regions where a different model provides a better fit to the tissue concentration curve.Methods
A total of 238 examinations from 25 patients with high-grade gliomas were included in the study. The patients were repeatedly imaged at regular intervals as part of a prospective treatment assessment study. DCE data was obtained by a 3D saturation recovery gradient echo sequence (resolution: 1.88x1.88x4 mm3, temporal resolution: 2.1 s). The DCE series were analyzed using incremental modeling, where each voxel was analyzed using increasingly more advanced kinetic models with increasing number of parameters. An F-test was applied to test if the more advanced model gave a significant better fit than the former. Each tumor ROI was divided into sub-ROIs based on the chosen kinetic model.The DCE series were analyzed using three different kinetic models: the two parameter Tofts-Kermode (TK) model3, the three parameter ETM and the four parameter two-compartment exchange (TCE) model4. This enabled a comparison of suitability of each model on a voxel-for-voxel basis. Tumors in which a sub-ROI could be defined of at least 50 voxels that was determined to be better fitted by a model other than ETM was included in the analysis. The median Ktrans estimates as produced by ETM and the better fitted model were compared using Wilcoxon signed rank test.Results
Figure 1 shows the distribution of the chosen model for more than 140,000 voxels from all tumor ROIs. 70 % of voxels are best fitted using ETM, 16 % using TCE and 13 % using TK. Figure 2 displays a boxplot of the median Ktrans estimated using ETM relative to TCE and TK in sub-ROIs in which TCE (n = 75) and TK (n = 80), respectively, was found to provide better model fits. As can be seen, when using ETM, Ktrans is underestimated in the TCE sub-ROIs (p < 10-9), while little deviation is seen in the TK sub-ROIs (p > 0.8). An example slice showing an incremental model map is shown in figure 3. The different colors indicate which model is chosen in each voxel.Discussion
The global distribution of voxels from the incremental model analysis in figure 1 indicates that ETM is a reasonable choice in our materal of high-grade gliomas. However, 16 % of the tumor voxels in the herein assessed dataset are found to be better described by using the more advanced TCE. The non-significant variation in median Ktrans estimates when using ETM or TK in the TK sub-ROIs is an expected outcome in tumor regions where vp is indeed negligible, thus enabling the simpler TK model to provide a sufficient description of the tissue kinetics. While the TCE model offers an attractive method of supplying more detailed information about tumor tissue, it requires input data of proportionally higher quality. A question that is raised from the results of this study is whether it is reasonable and useful to combine different models within the same tumor. This may be especially relevant for high-grade gliomas, which are known to exhibit great variation in vascular properties within a single specimen.Conclusion
The present work has shown that a single kinetic model may not be sufficiently able to describe all tissue in the same tumor.Acknowledgements
No acknowledgement found.References
- Sourbron, S. P., & Buckley, D. L. (2013). Classic models for dynamic contrast-enhanced MRI. NMR in Biomedicine, 26(8), 1004–1027.
- Tofts, P. S., Brix, G., Buckley, D. L., Evelhoch, J. L., Henderson, E., Knopp, M. V., … Weisskoff, R. M. (1999). Estimating kinetic parameters from dynamic contrast-enhanced T1- weighted MRI of a diffusable tracer: Standardized quantities and symbols. Journal of Magnetic Resonance Imaging, 10(3), 223–232.
- Tofts, P. S., & Kermode, A. G. (1991). Measurement of the blood-brain barrier permeability and leakage space using dynamic MR imaging. 1. Fundamental concepts. Magn Reson Med, 17(2), 357–367.
- Brix, G., Kiessling, F., Lucht, R., Darai, S., Wasser, K., Delorme, S., & Griebel, J. (2004). Microcirculation and microvasculature in breast tumors: Pharmacokinetic analysis of dynamic MR image series. Magnetic Resonance in Medicine, 52(2), 420–429.
Figures

Histogram
showing the distribution of voxels (n=143,654) being best described by the
Tofts-Kermode (TK) model, extended Tofts model (ETM) and two-compartment
exchange (TCE) model.
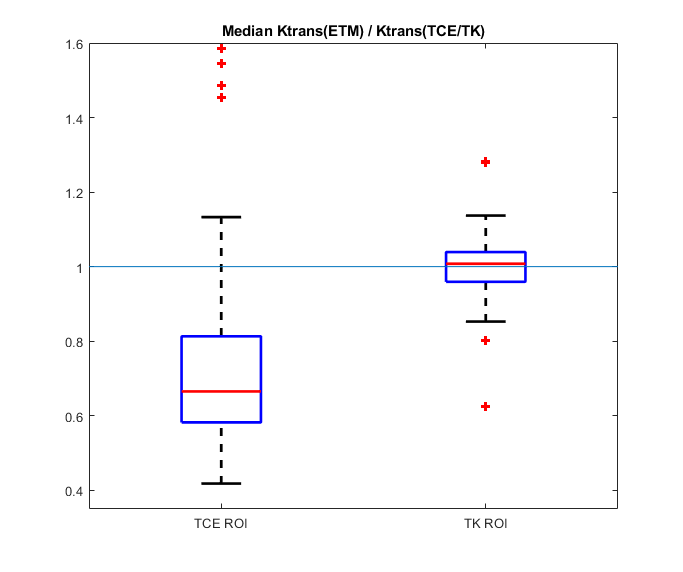
Boxplots
representing the relative magnitude of median Ktrans estimates when evaluated using the ETM compared
to the TK or TCE models in sub-ROIs where one of the latter was found to be a
better match for the tissue response curve.

An example slice of an incremental model map overlayed on a corresponding structural T1-scan. The colors represents the chosen model in each tumor voxel as red (TCE), green (ETM) and yellow (TK) sub-ROIs.