2186
Feasibility of measuring subtle Blood-Brain Barrier permeability change with reduced scan time using Dynamic Contrast-Enhanced Magnetic Resonance Imaging1Sackler Institute of Graduate Biomedical Science, New York University School of Medicine, New York, NY, United States, 2Center for Biomedical Imaging, Radiology, New York University School of Medicine, New York, NY, United States, 3Center for Advanced Imaging Innovation and Research, Radiology, New York University School of Medicine, New York, NY, United States, 4Centre for Preclinical Imaging, Institute of Translational Medicine, University of Liverpool, liverpool, United Kingdom
Synopsis
The purpose of this study is to evaluate the feasibility of using a new contrast kinetic model to accurately measure changes in the low permeability of the blood-brain barrier due to the subtle vascular disruption in the development of neurodegenerative diseases. Our proposed kinetic model, named extended Patlak model (EPM), includes the plasma flow from the artery to capillary bed, which allows the accurate description of intake dynamics. We hypothesize that this extension allows EPM to estimate the permeability change more accurately than the conventional Patlak model (PM) with a reduced scan-time of around 10 min.
Introduction
Dynamic contrast enhanced(DCE)-MRI have been used as a quantitative tool for investigating tissue microstructures associated with various brain pathologies, such as brain tumor, stroke, and multiple sclerosis.1 In these studies, the Patlak model (PM) is generally used to evaluate the vascular permeability of the brain parenchyma. However, the underlying assumption of PM is valid for the later portion of the time-concentration curve where the capillaries and arteries have same concentration of the contrast agent. This and a low permeability of typical BBB require a long scan-time, around 20-30 minutes, which is not convenient for elderly patients. This study investigates the feasibility of the proposed EPM, which we hypothesize to result more accurate estimation of subtle BBB disruption than PM even with a reduced scan-time.Methods
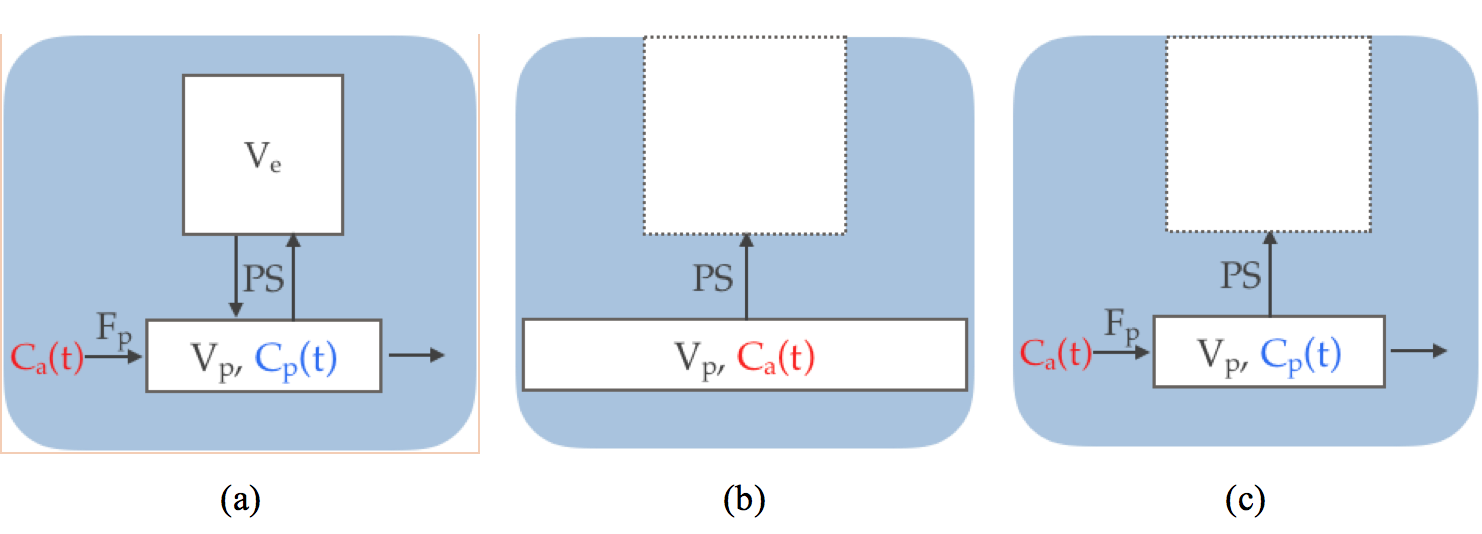
Contrast Kinetic Modeling: Figure 1a demonstrates the illustration of the 2-compartment exchange model (TCM)2, which consists of 4 parameters: the volume fraction of the extravascular extracellular space(EES) (ve), the volume fraction of the blood plasma compartment (vp), the flow coming from the artery to the capillary (Fp) and the bidirectional permeability surface-area-product (PS). TCM is often used for the tissues with higher permeability such as tumor regions. In normal brain regions, the reverse flow coming back from EES may be negligible during the scan-time, due to the lower permeability exchange rate. Thus, the unidirectional exchange is often assumed, such as in the PM3, as depicted in Figure 1b. Furthermore, the PM also assumes the concentration of contrast agent in capillary bed is same as that of the artery (i.e. infinite Fp), which is only valid after long time. Thus, we proposed the new contrast kinetic model, as named EPM(Figure 1c), which extends the PM to include the flow(Fp). With this extension, EPM can describe the early intake dynamics, which allows the accurate estimation of kinetic parameters, even with a reduced scan-time.
Simulation study: A numerical simulation study was carried out to evaluate the accuracy of the EPM as compared to PM for estimating kinetic parameters of the tissues with small PS value. The population based Arterial Input Function(AIF) by Parker et al4 was used and the concentration curve was generated using TCM with the parameters, reflecting literature values for the grey matter of patients with early Alzheimer’s Disease5. Then the same simulation was repeated with the low flow to find the effect of blood flow to each model. To simulate the realistic MR signal, Gaussian noise with the variance of 1.5% of base-line signal intensity was added. The simulated data were used to investigate the influence of scan-time on the accuracy of parameter estimation.
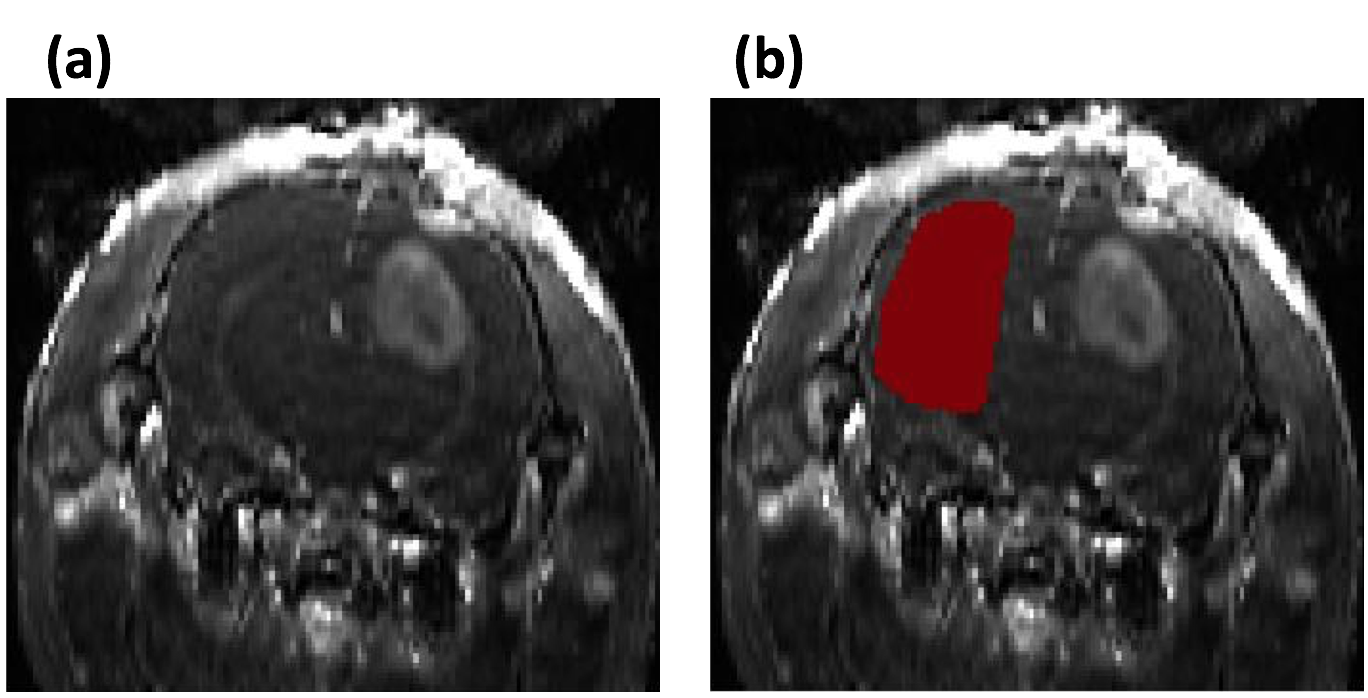
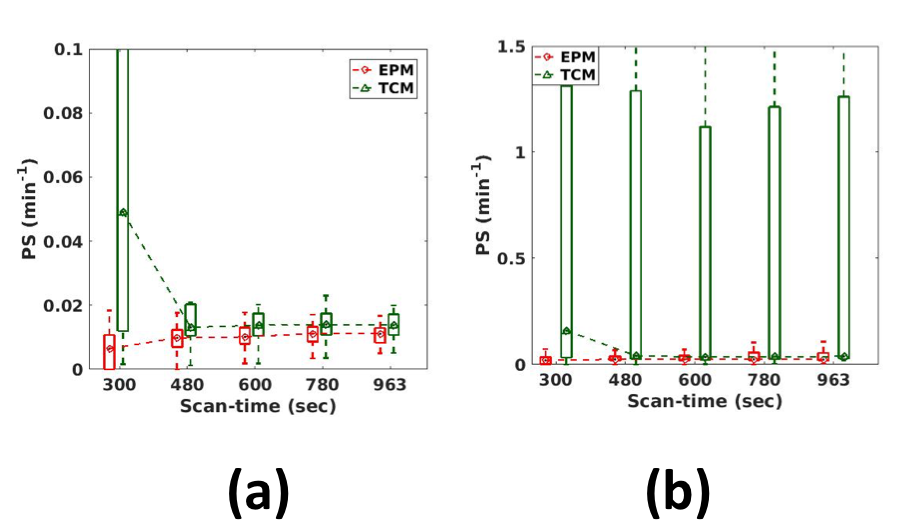
Animal study: Three 4~6 weeks-old syngeneic female Fisher rats injected with F98 glioblastoma intracranial tumor cells were used to assess the tissues with the wide range of permeability changes. A 3D dual-echo spoiled GRE sequence was used with the temporal-resolution=5.37s/frame, TR=14ms, TE1/2=2.2/4.6ms, FA=12, FOV=20mmx25mm, acquisition matrix=64x128, and 8slices with 1mm-thickness. For data analysis, the contralateral side of each rat’s brain was manually selected for the ROI in the normal brain regions, and a bootstrapping analysis was performed, as shown in Figure 2. The data set were also truncated to the sets of shorter scan-times. Both EPM and PM were used to analyze the data. For tumor regions, the peri-tumor region (intermediate permeability change) was separated from the core-tumor region (high permeability change), using the PS values estimated from TCM.
Result
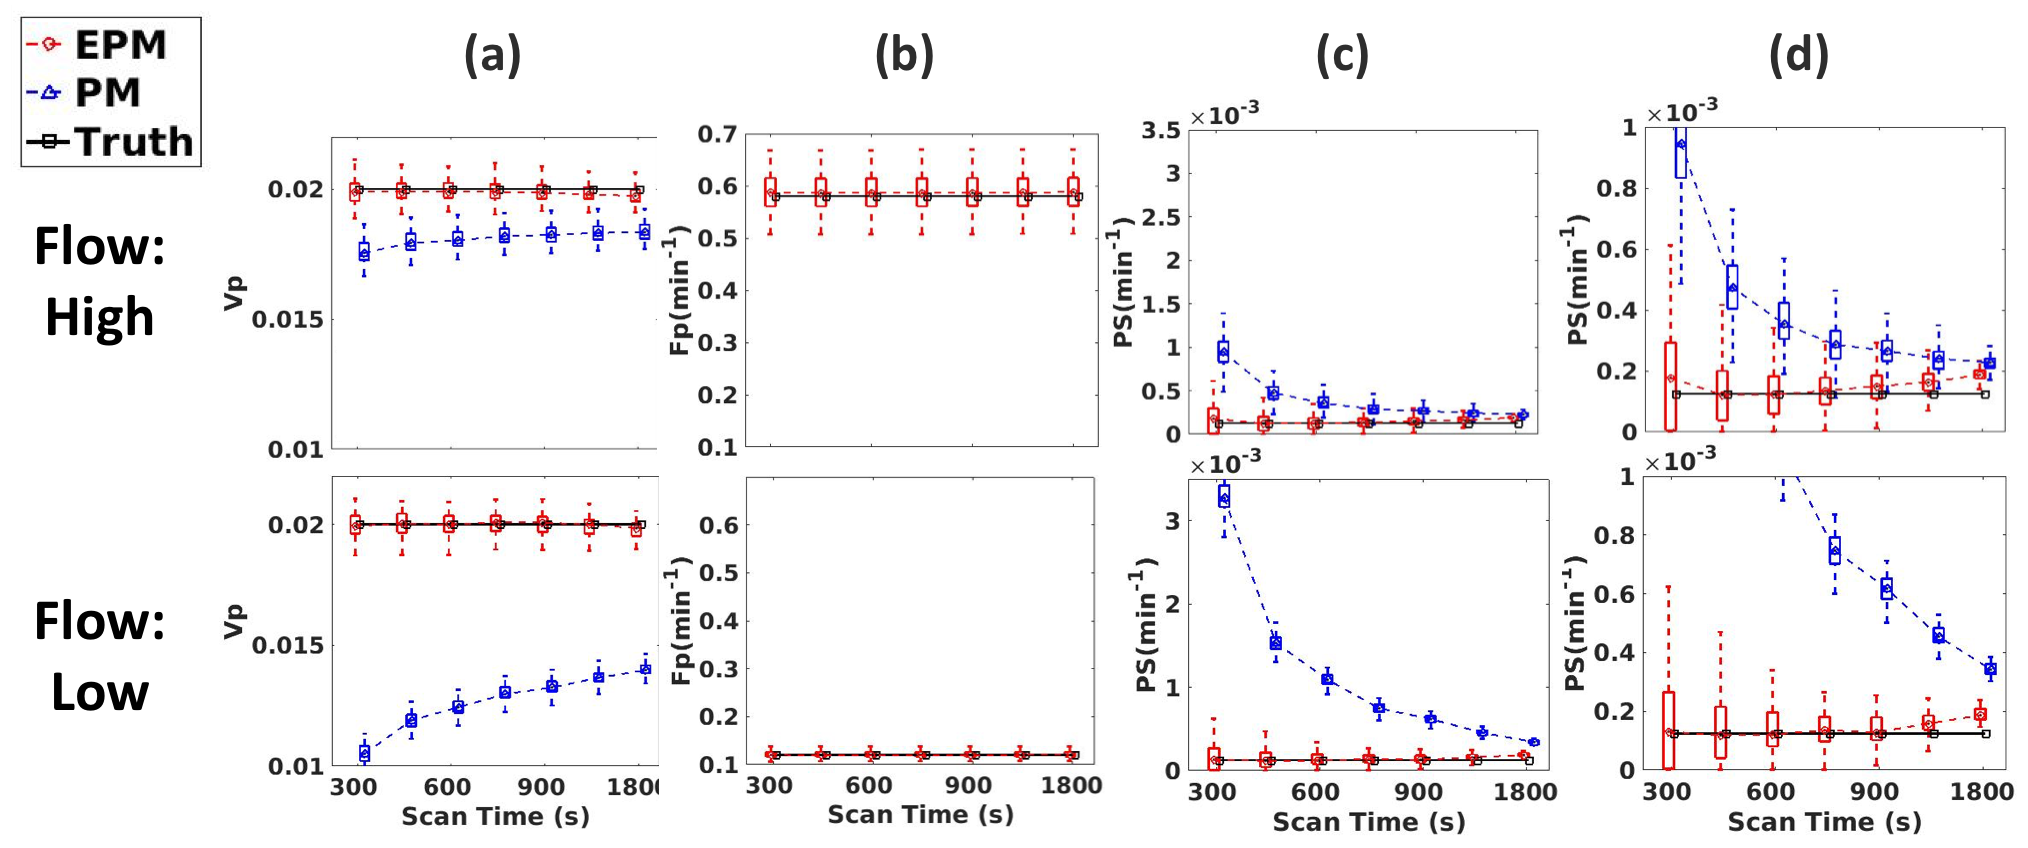
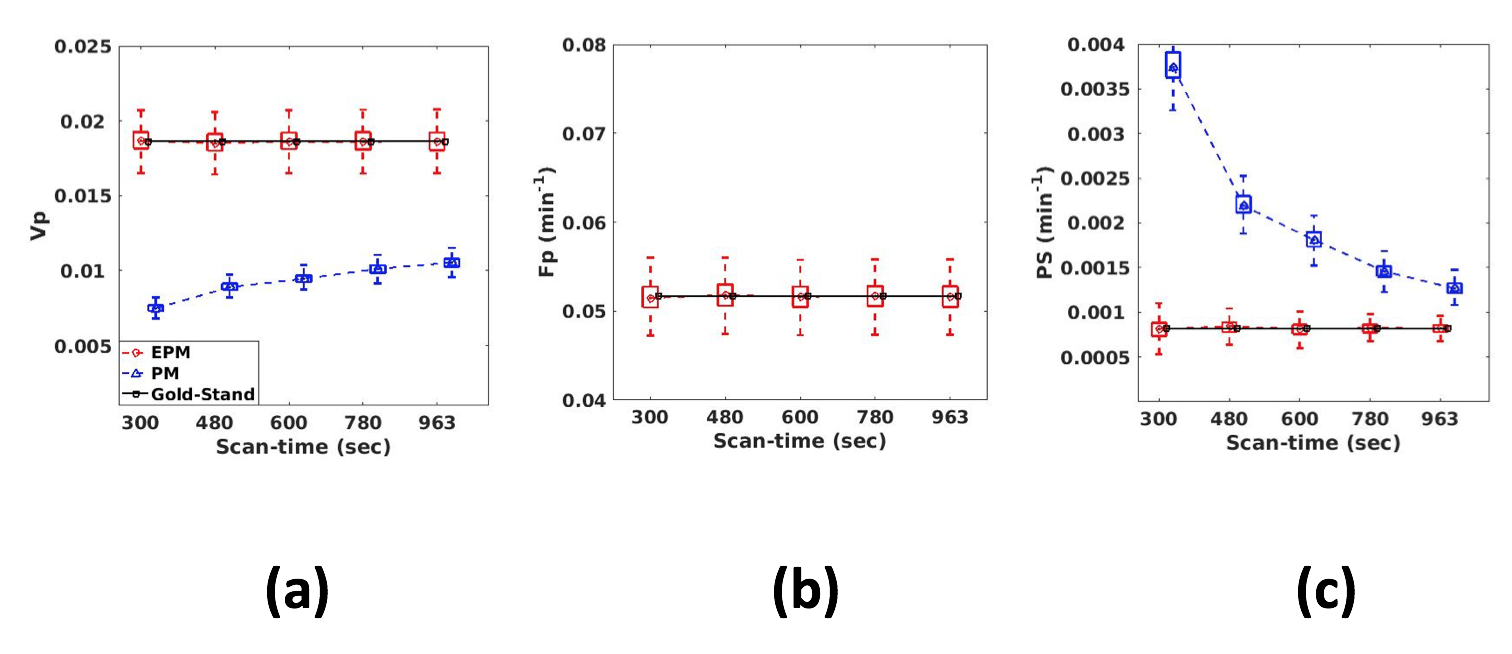
Figure 3 shows the influence of the scan-time on the kinetic parameters. As shown in Figure 3(a), PM-vp suffers from the underestimation as the scan-time reduces, while EPM-vp is consistent even with the reduced scan-time. The underestimation is exacerbated when Fp of the simulated tissue is low. EPM-Fp shows robust and accurate estimation over the different scan-times (Figure 3(b)). Similarly, EPM-PS estimation shows its accuracy and robustness over the PM-PS, regardless of Fp of the simulated tissue and the length of scan-time. In contrast, PM-PS experiences the extremely large error, when the flow is low, as shown in Figure3(c)-(d). Figure 4 shows the kinetic parameters estimated from the normal brain regions. The trends of all kinetic parameters were coherent with the simulation results: PM experiences the larger error as the scan-time reduces, while EPM maintains its accuracy even with the reduced scan-time. Figure 5 suggests that the EPM is also suitable for analyzing the tissues with intermediate permeability change (peri-tumor regions).Discussion and Conclusion
The numerical simulation and our animal study result suggest that the proposed EPM is a more appropriate model than the conventional PM for assessing the subtle BBB disruption with a reduced scan-time.Acknowledgements
NIH grant R01CA160620 and Alzheimer’s Association Research Grant AARG-17-533484.References
1. Heye AK, Culling RD, Valdes Hernandez Mdel C, Thrippleton MJ, Wardlaw JM. Assessment of blood-brain barrier disruption using dynamic contrast-enhanced MRI. A systematic review. NeuroImage Clinical. 2014;6:262-74. doi: 10.1016/j.nicl.2014.09.002. PubMed PMID: 25379439; PubMed Central PMCID: PMC4215461.
2. Brix G, Kiessling F, Lucht R, Darai S, Wasser K, Delorme S, Griebel J. Microcirculation and microvasculature in breast tumors: pharmacokinetic analysis of dynamic MR image series. Magnetic resonance in medicine. 2004;52(2):420-9. doi: 10.1002/mrm.20161. PubMed PMID: 15282828.
3. Patlak CS, Blasberg RG, Fenstermacher JD. Graphical evaluation of blood-to-brain transfer constants from multiple-time uptake data. J Cereb Blood Flow Metab. 1983;3(1):1-7. doi: 10.1038/jcbfm.1983.1. PubMed PMID: 6822610.
4. Parker GJ, Roberts C, Macdonald A, Buonaccorsi GA, Cheung S, Buckley DL, Jackson A, Watson Y, Davies K, Jayson GC. Experimentally-derived functional form for a population-averaged high-temporal-resolution arterial input function for dynamic contrast-enhanced MRI. Magnetic resonance in medicine. 2006;56(5):993-1000. doi: 10.1002/mrm.21066. PubMed PMID: 17036301.
5. van de Haar HJ, Burgmans S, Jansen JF, van Osch MJ, van Buchem MA, Muller M, Hofman PA, Verhey FR, Backes WH. Blood-Brain Barrier Leakage in Patients with Early Alzheimer Disease. Radiology 2016;281(2):527-535.
Figures