2185
Diffusion dependency of oxygenation measurements obtained with Vessel Architectural Imaging1Oslo University Hospital, Oslo, Norway, 2Department of Physics, University of Oslo, Oslo, Norway, 3Department of Neurosurgery, Oslo University Hospital, Oslo, Norway, 4Institute of Clinical Medicine, University of Oslo, Oslo, Norway
Synopsis
With the dual echo DSC-based technique Vessel Architectural Imaging (VAI), measurement of oxygenation level (∆SO2) can be obtained. However, how the ∆SO2-parameter is influenced by diffusion have previously not been investigated. Based on simulations, we show that the measured ∆SO2 obtained from VAI have a diffusion dependency proportional to 1/ √D. ADC-maps from 10 glioblastoma patients were used to display the range correction factors in white matter and tumor regions. In conclusion, the diffusion dependency should be corrected for to obtain more accurate measurements of ∆SO2, and may be especially relevant for brain diseases with aberrant diffusion characteristics.
Introduction
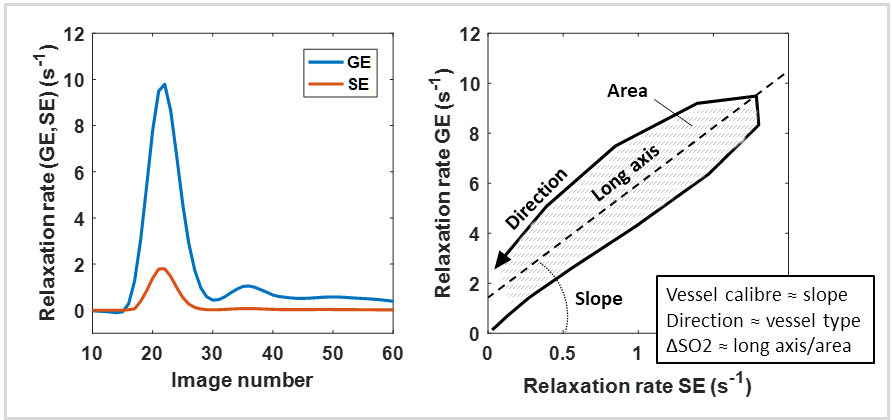
Vessel Architectural Imaging (VAI) is based on Dynamic Susceptibility Contrast (DSC) where simultaneous gradient echo (GE) and spin echo (SE) acquisitions are performed.1 The vessel vortex obtained by VAI (Figure 1) can provide information about the microvasculature, including vessel calibre2, vessel type and the oxygenation level (∆SO2).3 However, the effect of diffusion on the ∆SO2 parameter, and how this can be corrected for, has not previously been examined. This may be of relevance for obtaining a more accurate measurement of ∆SO2.Material and Methods
Monte Carlo simulations of intravascular magnetic susceptibility perturbations were conducted to obtain signal responses – and subsequently VAI parameters – for varying oxygenation levels and diffusion constants (D). Arterial oxygen saturation level was set to 100%, while venous oxygen saturation level varied from 100% to 0%, with increments of 25%. D varied from 100 to 1100 µm2/s, with increments of 100 µm2/s.
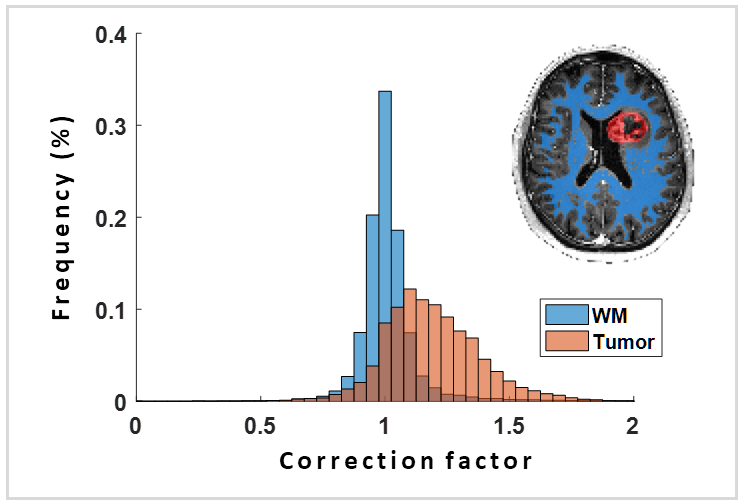
Subject data included VAI analysis from glioblastoma patients (N = 10). In addition, binary maps of white matter were obtained from inversion recovery Look-Locker acquisitions4, ADC-maps from diffusion tensor images and tumor ROIs were delineated on post-contrast T1 images. Based on the diffusion-dependency found in simulated data, correction factors were obtained from ADC-maps. Histograms of correction factors in tumor and white matter-masks were generated, where the correction factors were subject-wise normalized to the median value of white matter.
Results
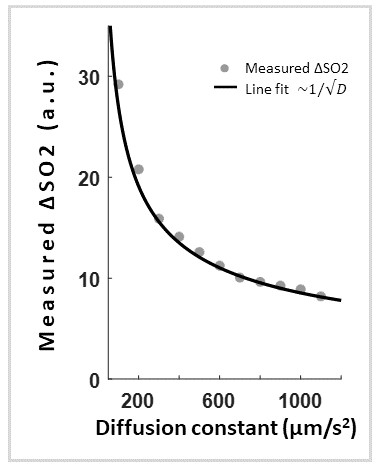
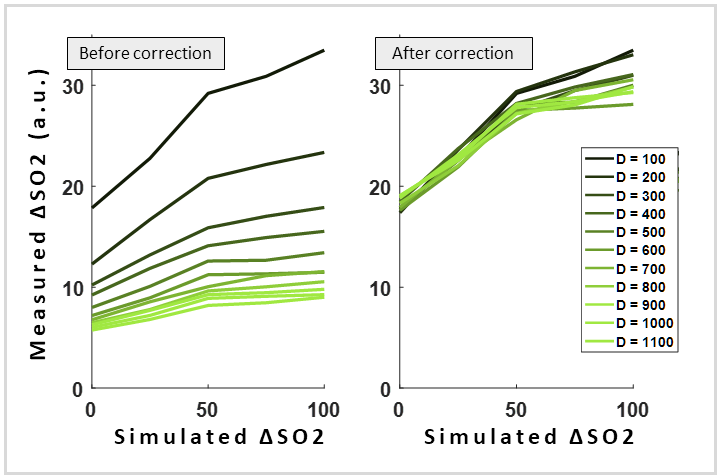
Simulations show that the measured ∆SO2 decreases with increasing D. Specifically, the dependency was found to be proportional to 1/√D (Figure 2). Plotting the measured ∆SO2 across simulated ∆SO2 for varying D demonstrate this dependency (Figure 3A). By using √D as a correction factor, the measured ∆SO2 becomes independent of D (Figure 3B).
Subject data show that there is a substantial range of correction factors in white matter and tumor regions (Figure 3). The interquartile range was (1.04 - 0.96 = 0.08) in white matter, and (1.30 - 1.06 = 0.24) in tumor regions.
Discussion
The diffusion dependency of the ∆SO2-parameter found in our simulated data indicates that the measured ∆SO2 in regions of fast diffusion are underestimated compared to regions with slow diffusion. Subject data show that comparing uncorrected ∆SO2 across regions of varying ADC may contribute to pronounced errors, and should therefore be corrected.Conclusion
Our simulation results show that the diffusion dependency of the measured ∆SO2 is given by 1/√D, and that this diffusion dependency should be corrected for to obtain a more accurate measurement of ∆SO2 across regions of varying diffusion. This correction may be especially relevant for brain diseases that are associated with aberrant diffusion characteristics, such as neurodegenerative disorders and brain tumors.Acknowledgements
No acknowledgement found.References
1. Emblem KE et al. Nat Med. 2013;19(9):1178-83
2. Digernes I et al. J Cereb Blood Flow Metab. 2017;37(6):2237-2248
3. Boxerman et al. Magn Reson Med 1995;34:555-566
4. Shin et al. Neuroimage 2010; 52:1347-1354
Figures