2184
Measuring transient T2* changes in vivo to validate Dynamic Distributed Spirals, a novel DSC-perfusion method1Department of Radiology, University of Chicago, Chicago, IL, United States, 2MR Technology Design Group, Barrow Neurological Institute, Phoenix, AZ, United States
Synopsis
Validating new contrast-enhances sequences is problematic, as risks associated with gadolinium contrast agents generally preclude testing in healthy volunteers. The Dynamic Distributed Spirals trajectory (DDS) is a promising new dynamic susceptibility-contrast (DSC)-perfusion method. In this work, we show that DDS is capable of measuring the transient T2* changes induced by breathholding which are much lower in magnitude than the susceptibility changes induced by contrast agent transit in conventional DSC-perfusion experiments.
Introduction
One of the major challenges of any new contrast-enhanced method is in vivo validation. In general, novel DSC perfusion methods are unable to be directly validated by measuring perfusion parameters due to non-zero risks associated with gadolinium-chelate contrast agents. However, DSC perfusion methods in their most basic form detect changes in T2* as created by a transient susceptibility gradient between vasculature and surrounding tissue.
In the original publication describing blood-oxygenation level dependent MRI (BOLD) (1), changes in susceptibility were induced by local changes in blood flow and oxygen consumption. Under normal conditions, a given percent of oxygenated hemoglobin is converted to deoxyhemoglobin by neuronal activity. The difference in magnetic environments between deoxyhemoglobin and tissue plasma creates a susceptibility gradient which decreases signal magnitude in T2*-weighted sequences. Increased neuronal activity increases local carbon dioxide concentration which increases CBF and oxygen delivery resulting in a net reduction in OEF. This creates a small but measurable reduction in susceptibility which can be measured during extended breathholds. The induced T2*-relaxivity changes due to the passage of contrast agent in DSC-perfusion methods is several orders of magnitude greater than the expected relaxivity change due to breath-holding (2).
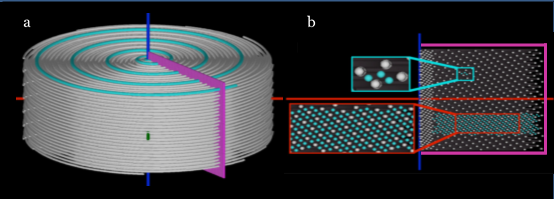
We developed a novel GRAPPA-accelerated DSC-perfusion method based on the Distributed Spirals trajectory called Dynamic Distributed Spirals (DDS) (Figure 1) (3). If the proposed method is capable of reliably detecting changes in T2*-relaxivity related to breath-holding, it is reasonable to assume the proposed method will be capable of accurately measuring changes in T2*-relaxivity due to contrast agent passage in DSC-perfusion studies, without having to inject gadolinium contrast agets into healthy volunteers or subjecting clinical patients to untested sequences.
Methods
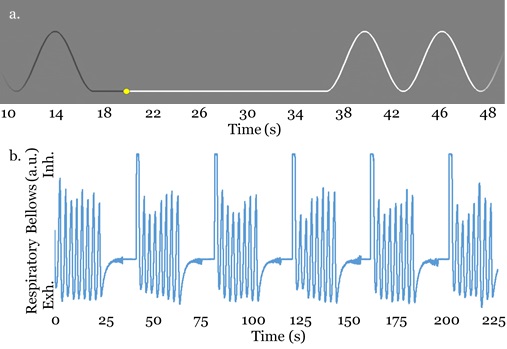
In order to verify the proposed method in vivo, six healthy volunteers were scanned with a breath-holding protocol to stimulate changes in T2* related to blood carbon dioxide levels. Volunteer breathing was prompted with a sinusoidal waveform which volunteers viewed via fMRI goggles (Figure 2). Breathing was monitored with the use of respiratory bellows . The breath-holding scheme required volunteers to hold their breath for 20 seconds followed by 40 seconds of regular breathing at 10 breaths per minute. Detectability of ΔR2* during moderate breath holding was assessed by examining percent change in R2* and activation fraction volume in the proposed method as well as SENSE-accelerated EPI. Activation due to hypercapnia was determined by calculating the average signal during breathhold and normal breathing and performing a t-test to determine the statistical significance of signal variation.
The proposed spiral trajectory is shown in Figure 1. A cross-section of the volume in the kz - kr direction shows a uniform sampling pattern which is used to interpolate missing data using GRAPPA. The proposed method is a modification of the method presented in (4), which uses fully sampled data sets through time to calibrate GRAPPA weights for individually undersampled segments of the trajectory.
Imaging parameters were as follows: FOV (xy/z) = 22 / 10 cm, resolution (xy/z) = 3 / 3 mm. Image matrix (xy/z) = 73 / 34. Maximum gradient = 35 mT/m, maximum slew = 110 mT/m/ms. For the spiral acquisition, pulse repetition, echo times = 14.8 / 0.95, 6.9 ms (dual echo). ADC time = 4.5 ms, temporal resolution = 900 ms. Total scan time = 4.8 minutes. For the EPI acquisition, pulse repetition, echo time = 900 / 35 ms.
Results and Conclusions
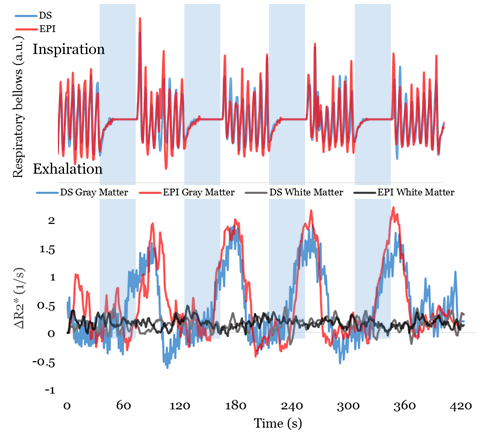
ΔR2* was calculated and averaged across volunteers and breath-hold cycles in white matter and deep gray matter. Figure 3 shows the agreement between breathing during spiral and EPI acquisitions. The white matter ROI did not show statistically significant changes induced by breath holding (p = 0.319) which was expected due to low metabolic activity. In the gray matter ROI for both the proposed method and EPI acquisitions the maximum difference in signal magnitude between periods of breath holding and normal breathing was approximately 3%, which matched expected values for a breathhold of 20 seconds (78).
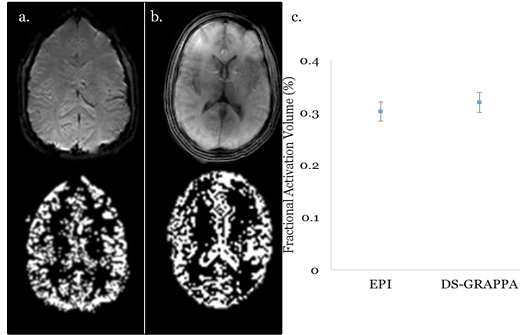
Figure 4 shows a representative slice with statistically significant signal changes due to breath-holding, as well as the averaged fractional activation volume for EPI and the proposed method. As expected, the activation of pixels was concentrated in regions dominated by gray matter. For EPI acquisitions, the total fractional activation was 0.302 ± 0.012, and was 0.324 ± 0.0296 for the proposed method. Differences between the two acquisitions were not statistically significant (p = 0.21). The increased fractional activation in the spiral acquisition may be due to residual blurring due to off resonance, in which signal from metabolically active gray matter is spread into neighboring voxels.
The proposed method demonstrated the capacity to detect very small changes in T2* in vivo induced by moderate breath holding.
Acknowledgements
This work was made possible by research support from Philips Heathcare.References
1. Ogawa S et al. Intrinsic signal changes accompanying sensory stimulation: functional brain mapping with magnetic resonance imaging. Proc Natl Acad Sci USA. 1992; 89:5951-55.
2. Birn RM et al. The respiratory response function: the temporal dynamics of fMRI signal fluctuations related to changes in respiration. Neuroimage. 2008; 40:644-54.
3. Turley DC et al. Distributed Spirals: a new class of 3D k-space trajectories. Mag Reson Med. 2013; 70:413-19.
4. Seiberlich N. Improved radial GRAPPA calibration for real-time free-breathing cardiac imaging. Mag Reson Med. 2011; 66:1682-88.
Figures