2183
RF Transmit Calibration for DCE-MRI1Electrical Engineering Department, University of Southern California, Los Angeles, CA, United States, 2Department of Radiological Sciences & Physics and Biology in Medicine IDP, University of California, Los Angeles, Los Angeles, CA, United States, 3Imaging Physics, Sanford Health, Fargo, ND, United States
Synopsis
Spatial inhomogeneity in the transmitted RF introduces bias and increased variance in quantitative DCE-MRI metrics, which can dominate all other sources of error if uncorrected. The amount and pattern of inhomogeneity depends on the RF coil geometry, the driving circuits, and the vendor-specific pre-scan calibration. In this work, we (1) constructed human tissue-mimicking torso and brain phantoms, (2) measured and compared the spatial RF transmit inhomogeneity across different scanners, vendors, and sites, and (3) evaluated vendor-recommended methods for RF transmit measurement.
Introduction
Spatial inhomogeneity in the transmitted RF (B1+) field is known to introduce bias and increased variance in quantitative DCE-MRI metrics (e.g. tracer kinetic parameter maps) 1–4. If unaccounted for, these errors can dominate all other sources of bias and variance, and lead to the inability of differentiating tumor and normal tissue 5. The amount and pattern of inhomogeneity depends on the RF coil geometry, the circuits that drive them, and the vendor-specific pre-scan calibration. In this independent study, initiated by the RSNA-QIBA DCE-MRI Task Force, we compare the spatial RF transmit inhomogeneity across different scanners, vendors, and sites, and evaluate vendor-recommended methods for RF transmit measurement that can be used to correct data prior to quantitative DCE-MRI analysis. Human tissue mimicking torso and brain phantoms were constructed. B1+ maps were acquired on a broad range of platforms using a consistent protocol as well as vendor-recommended fast protocols.Methods
A spherical head phantom (Diffusion Phantom Shell, High Precision Devices, Boulder, Colorado) and a custom torso phantom (Shelley Medical, Hamilton, Ontario) were used in this study. The torso shaped phantom was approximately the size of a human adult torso with a concentric outer shell, creating one large fillable interior volume and one smaller fillable outer volume to mimic subcutaneous adipose tissue. The outer volume of the torso phantoms was filled with a commercial fat-mimicking solution with T1 of approximately 350 ms (Fat Mimic L9010, High Precision Devices, Boulder, Colorado). The human adult head-sized phantom had a single interior fillable volume. The inner volumes were conductivity matched to human tissue using NaCl 6. B1+ variation is not expected to be a function of T1, however, B1+ mapping techniques could be biased by T1. Hence, two versions of each phantom were created and the interior volumes were filled with two different solutions (Nickel(II) chloride hexahydrate, Sigma-Aldrich, St. Louis, Missouri) to cover the range of short and long T1s expected in organ tissue during a DCE-MRI acquisition with a current recommended contrast agent dose. Phantoms and resulting concentrations for all four phantoms are shown in Figure 1.
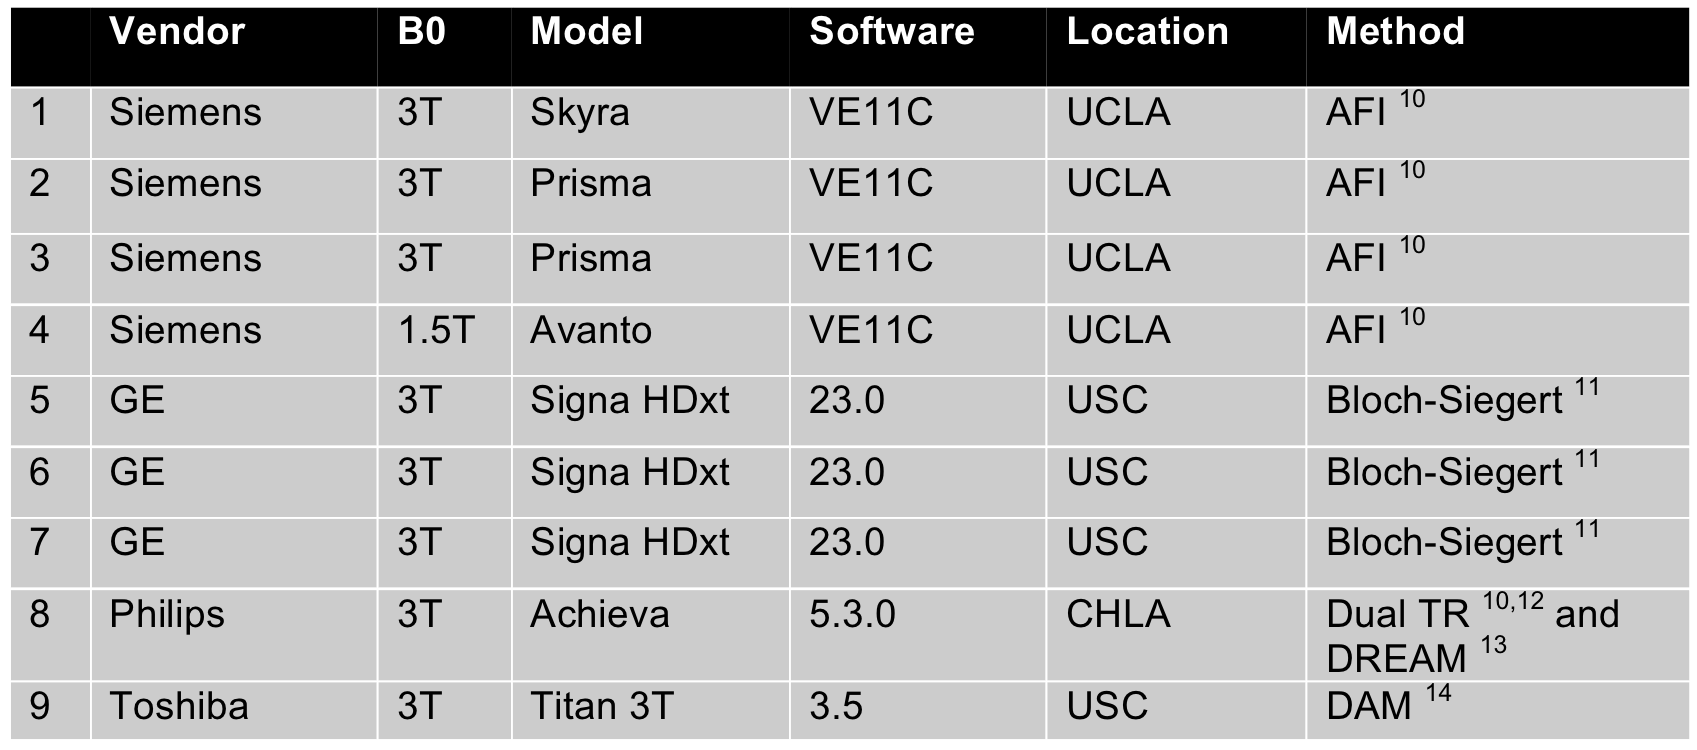
The B1+ mapping methods included vendor-provided methods that were provided through a survey given to the Vendor subcommittee of the RSNA QIBA, and follow-up discussions with vendor representatives. Scanners and vendor specific B1+ mapping sequences are listed in Figure 2. On all scanners, the clinically available 2D multi-slice double-angle gradient-echo method (DAM) was used as the “ground truth” reference standard ($$$\alpha_1 = 45^\circ, \alpha_2 = 90^\circ$$$, TR = 6s, matrix size = 64x64, 8 slices for the head phantoms, 20 slices for the torso phantoms, 8mm slice thickness with 2mm gap) 7. To mitigate slice profile effects, image analysis was performed on the central slice of each image volume acquired after slice profile correction 8.
Results
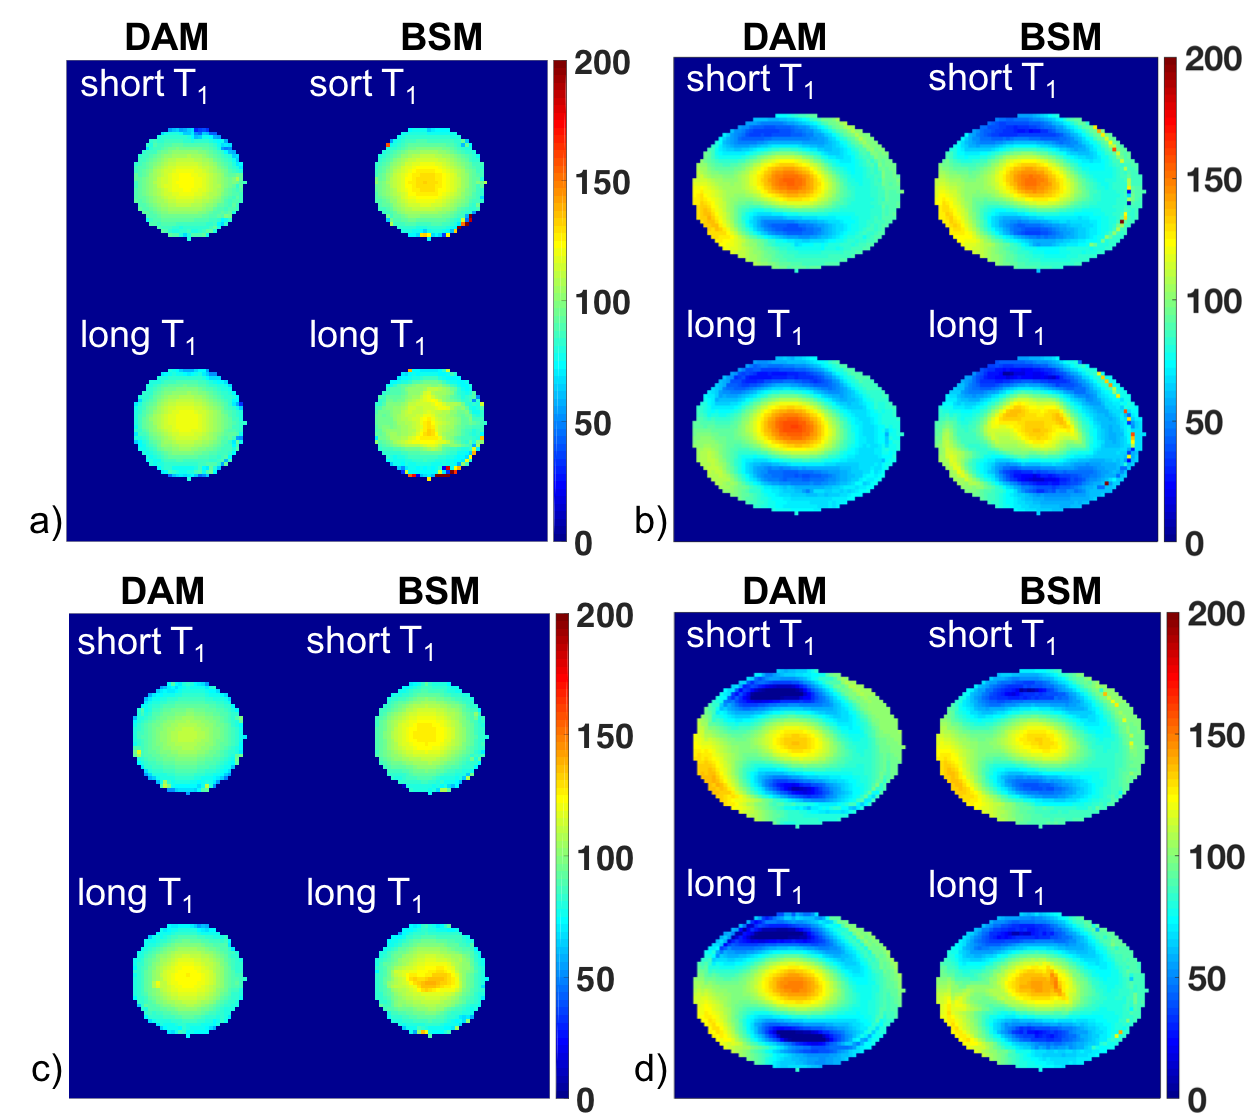
Figure 3 shows representative B1+ maps of head and torso phantoms for the DAM reference method and Bloch-Siegert method (BSM) for two GE scanners (scanners 5 and 6 as listed in Figure 2). As expected, B1+ variation is greater in the torso phantoms than for the smaller head phantoms. For the head phantoms, 90% of the B1+ scales ranged from 84% to 118% for scanner 5 and from 80% to 115% for scanner 6. For the torso phantoms, the range was 48% to 138% for scanner 5 and 31% to 124% for scanner 6. While both scanners show a similar pattern, the generated B1+ maps differ in spatial variation between the two scanners and methods.
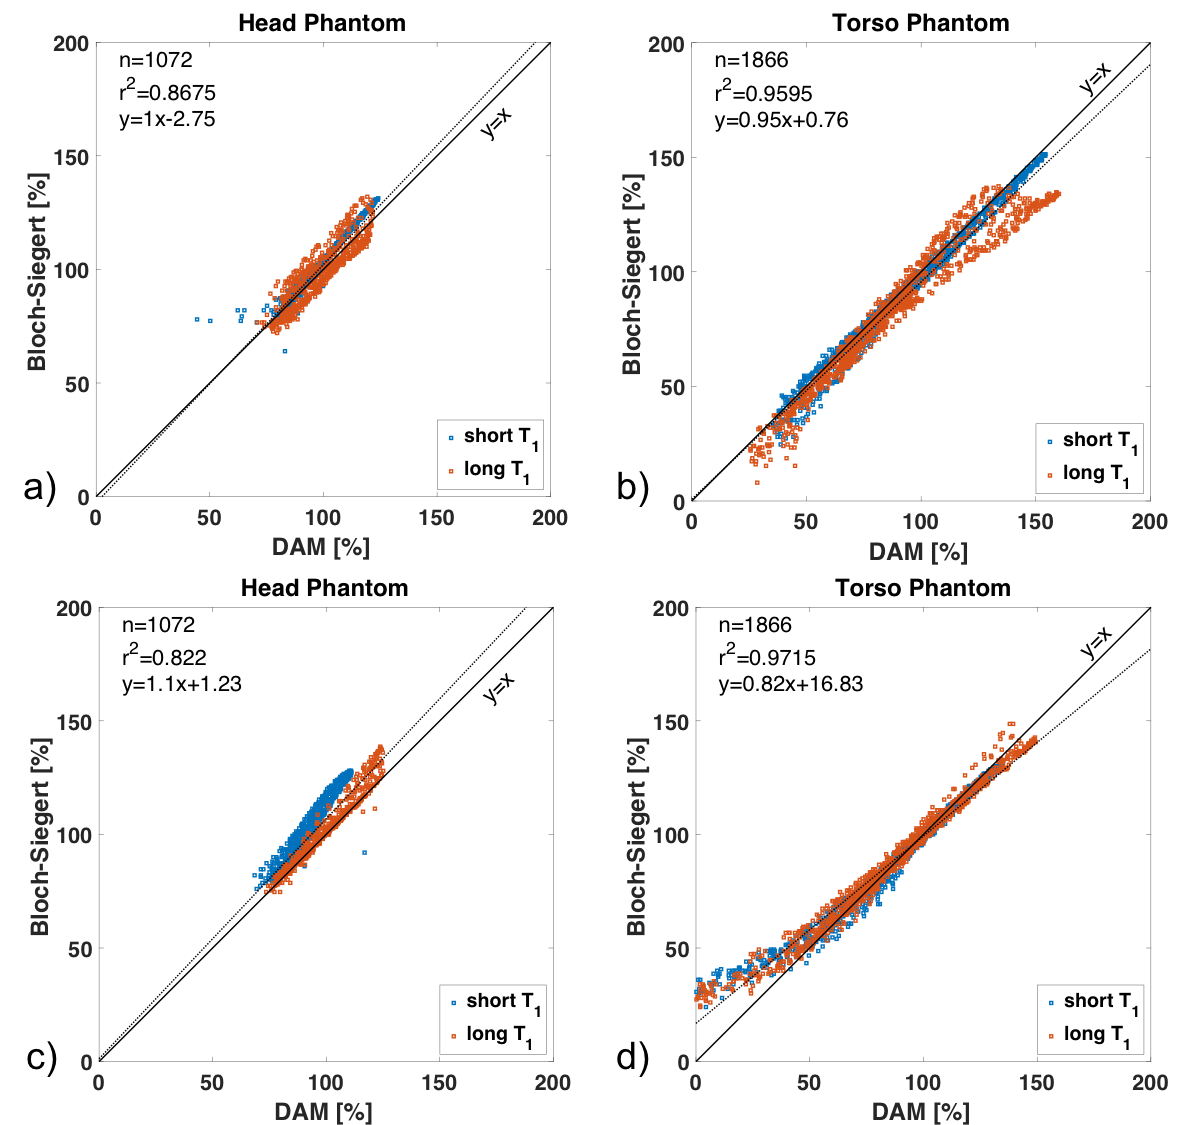
Figure 4 contains correlation plots for the for B1+ maps shown in Figure 3. While there is overall good agreement between BSM and DAM, the agreement is scanner and phantom dependent. Especially at large deviations, BSM can lead to substantial over- or under-estimation.
Discussion
Preliminary results from this study indicate significant variation of generated B1+ maps across different scanners and sites (Figure 3 and 4). Imaging will be repeated at all sites after two months. Simulations will also be used to determine the impact of B1+ field compensation on DCE-MRI modeling results 3,9.Acknowledgements
This study is part of an RSNA-QIBA Round 6 Groundwork Project funded in part by the NIH/NIBIB under contract no. HHS-N268201500021C. We also thank John E. Kirsch, Marc R. Lebel, Hans Peeters, Kay Nehrke, Peter Börnert, Samir Sharma, and all members of the QIBA DCE-MRI Task Force that provided guidance and/or helpful discussions.References
1. C. A. Azlan, T. S. Ahearn, P. Di Giovanni, S. I. K. Semple, F. J. Gilbert, and T. W. Redpath, “Quantification techniques to minimize the effects of native T1 variation and B1 inhomogeneity in dynamic contrast-enhanced MRI of the breast at 3 T,” Magn. Reson. Med., vol. 67, no. 2, pp. 531–540, 2012.
2. J. A. Brookes, T. W. Redpath, F. J. Gilbert, A. D. Murray, and R. T. Staff, “Accuracy of T1 measurement in dynamic contrast-enhanced breast MRI using two- and three-dimensional variable flip angle fast low-angle shot,” J. Magn. Reson. Imaging, vol. 9, no. 2, pp. 163–171, 1999.
3. K. Sung, B. L. Daniel, and B. A. Hargreaves, “Transmit B1+ field inhomogeneity and T 1 estimation errors in breast DCE-MRI at 3 tesla,” J. Magn. Reson. Imaging, vol. 38, no. 2, pp. 454–459, Aug. 2013.
4. C. A. Azlan, P. Di Giovanni, T. S. Ahearn, S. I. K. Semple, F. J. Gilbert, and T. W. Redpath, “B1 transmission-field inhomogeneity and enhancement ratio errors in dynamic contrast-enhanced MRI (DCE-MRI) of the breast at 3T,” J. Magn. Reson. Imaging, vol. 31, no. 1, pp. 234–239, 2010.
5. F. M. Fennessy, A. Fedorov, S. N. Gupta, E. J. Schmidt, C. M. Tempany, and R. V. Mulkern, “Practical considerations in T1 mapping of prostate for dynamic contrast enhancement pharmacokinetic analyses,” Magn. Reson. Imaging, vol. 30, no. 9, pp. 1224–1233, 2012.
6. S. Gabriel, R. W. Lau, and C. Gabriel, “The dielectric properties of biological tissues : II . Measurements in the frequency range 10 Hz to 20 GHz,” Phys. Med. Biol., vol. 2251, 1996.
7. E. K. Insko and L. Bolinger, “Mapping of the Radiofrequency Field,” J. Magn. Reson. Ser. A, vol. 103, no. 1, pp. 82–85, Jun. 1993.
8. K. H. Sung, “B1 Map Plugin.” [Online]. Available: http://kyungs.bol.ucla.edu/software/b1_map/b1_map.html. [Accessed: 01-Nov-2017].
9. M. C. Schabel and D. L. Parker, “Uncertainty and bias in contrast concentration measurements using spoiled gradient echo pulse sequences,” Phys. Med. Biol., vol. 53, no. 9, pp. 2345–2373, May 2008.
10. V. L. Yarnykh, “Actual flip-angle imaging in the pulsed steady state: A method for rapid three-dimensional mapping of the transmitted radiofrequency field,” Magn. Reson. Med., vol. 57, no. 1, pp. 192–200, 2007.
11. L. I. Sacolick, F. Wiesinger, I. Hancu, and M. W. Vogel, “B1 mapping by Bloch-Siegert shift,” Magn. Reson. Med., vol. 63, no. 5, pp. 1315–1322, May 2010.
12. K. Nehrke, “On the steady-state properties of actual flip angle imaging (AFI),” Magn. Reson. Med., vol. 61, no. 1, pp. 84–92, 2009.
13. K. Nehrke and P. Börnert, “DREAM-a novel approach for robust, ultrafast, multislice B1 mapping,” Magn. Reson. Med., vol. 68, no. 5, pp. 1517–1526, 2012.
14. K.
Yokoyama, R. Ishimura, M. Imai, T. Nitatori, M. Yui, S. Kuhara, and K. Yodo,
“Evaluation of dual-channel and 4-port multi transmit technique in 3T MRI:
Implications for cardiac SSFP cine MRI,” Japanese J. Diagnosive Imaging,
vol. 31, no. 2, pp. 101–113, 2013.
Figures