2181
Quantitative Modeling of Sequence Parameter Choices to Support Standardization for Quantitative DCE-MRI1Philips Research Europe, Hamburg, Germany
Synopsis
Systematic and statistical errors in quantitative DCE-MRI measurements which adhere to standardization recommendations by the Quantitative Imaging Biomarker Alliance (QIBA) of the RSNA are assessed using EPG simulations. It is found that small sequence parameter changes, well within the bounds allowed by QIBA, can produce large changes in the estimated quantitative parameters.
Introduction
The quantitative measurement of tissue permeability and perfusion using Dynamic Contrast Enhanced MRI (DCE-MRI) is an important diagnostic tool for chemotherapy follow-up. Nevertheless, reproducibility and comparability of quantitative parameters is poor and improved standardization of both data acquisition and processing is necessary. The Quantitative Imaging Biomarker Alliance (QIBA) has published guidelines for standardization of DCE-MRI to facilitate reproducible, robust and comparable quantification of pharmacokinetic parameters1. The QIBA guidelines specify ranges for a set of important sequence parameters, such as repetition time and flip-angle. In particular, it is recommended to chose the smallest possible TR. The purpose of this work is to study the effect of these choices and to explore the variability of measurements, which adhere to these guidelines.Theory
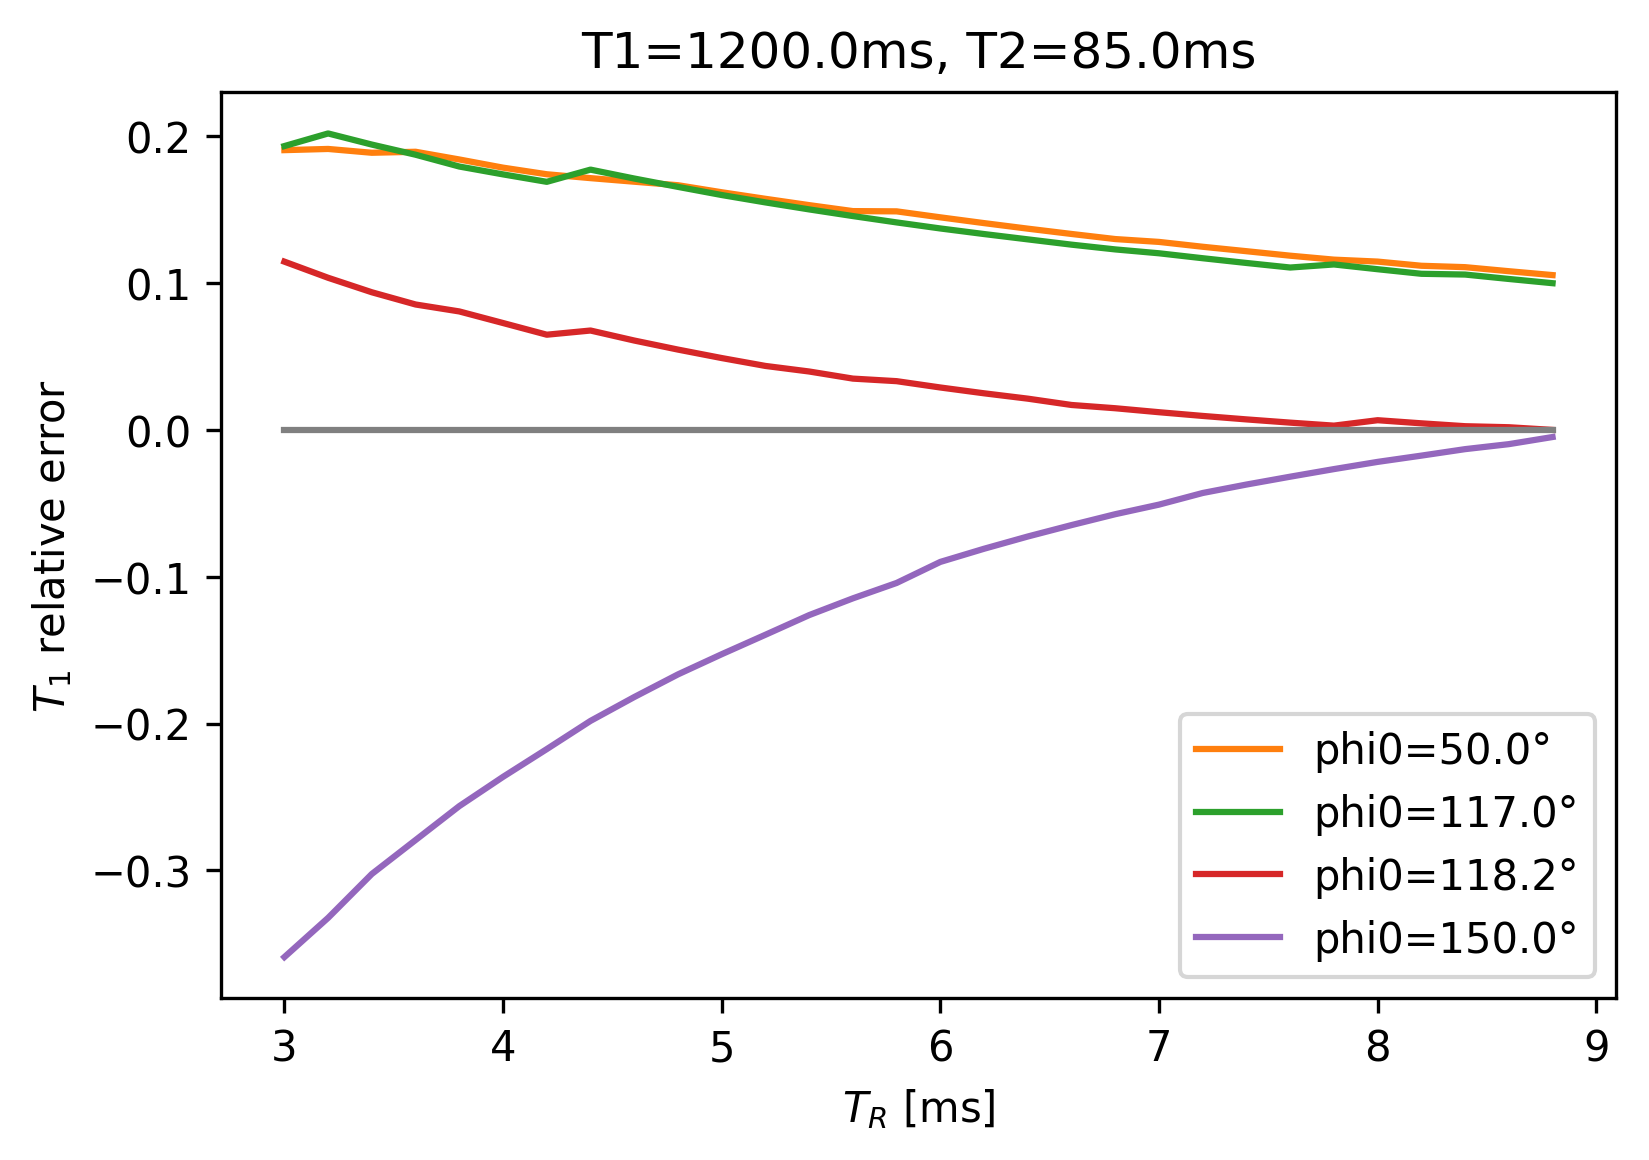
Systematic and statistical errors of two integral parts of the image acquisition and processing chain for DCE-MRI were studied using Extended-Phase-Graph simulations2: T1-mapping based on the variable flip-angle (VFA) method3, and the estimation of contrast-agent concentration4. T1 and T2 were chosen to reflect relaxation parameters of a benign mass in breast tissue5. Signals for different CA concentrations, c, were calculated assuming that the longitudinal relaxation changes according to $$$1/T_1 = 1/T_{10} + c*r_1$$$, where $$$r_1=5.5\ \mathrm{L/mmol/ms}$$$6. TR was varied from 3-9 ms, the flip-angle from 1-30°. The RF-spoiling phase increment, $$$\phi_0$$$, is not specified in the QIBA profile and several choices including 50°, 117°, 118.2°, and 150°7-9 were explored. The spoiling gradient, also not specified by QIBA, was chosen along the slice-encoding direction, achieving $$$8\pi$$$ dephasing over a slice-thickness of 5 mm, with a duration of 1 ms. The tissue diffusion constant was set to $$$D=0.001$$$ mm2/s. For the VFA-T1-Mapping, the optimal pair of flip-angles10 was chosen for a T1 range from 200 - 2000 ms, yielding the angles 1.7°, 6° and 18.5°. For determination of noise propagation, complex Gaussian noise was added to the simulated signals corresponding to SNR=300 for FA=90° and TR>>T1, corresponding to a realistic SNR=13 for FA=10°, TR=5 ms, T1=1000 ms. The noise figure, $$$\delta T_1$$$ is determined as the inter-quartile range (IQR) of the T1-value distribution obtained from N=10000 realizations. The result of the VFA-T1-mapping is used as T10 for the estimation of CA concentration.Results
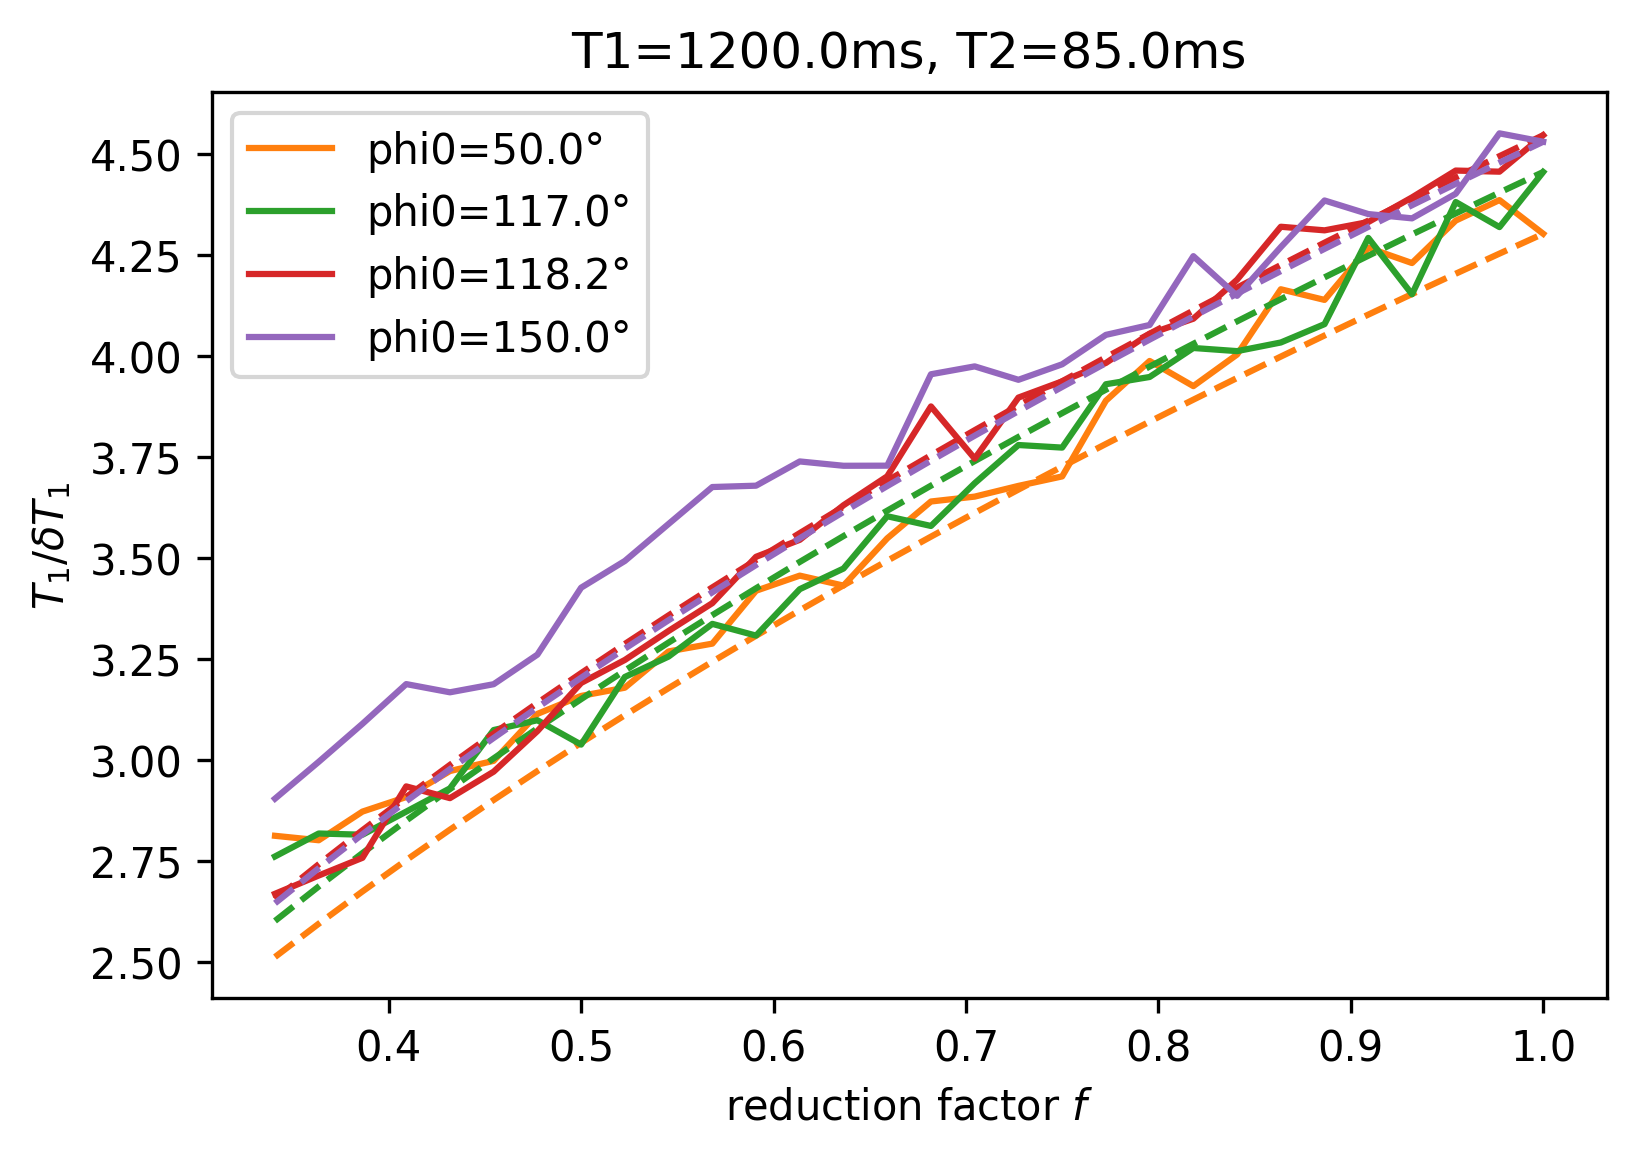
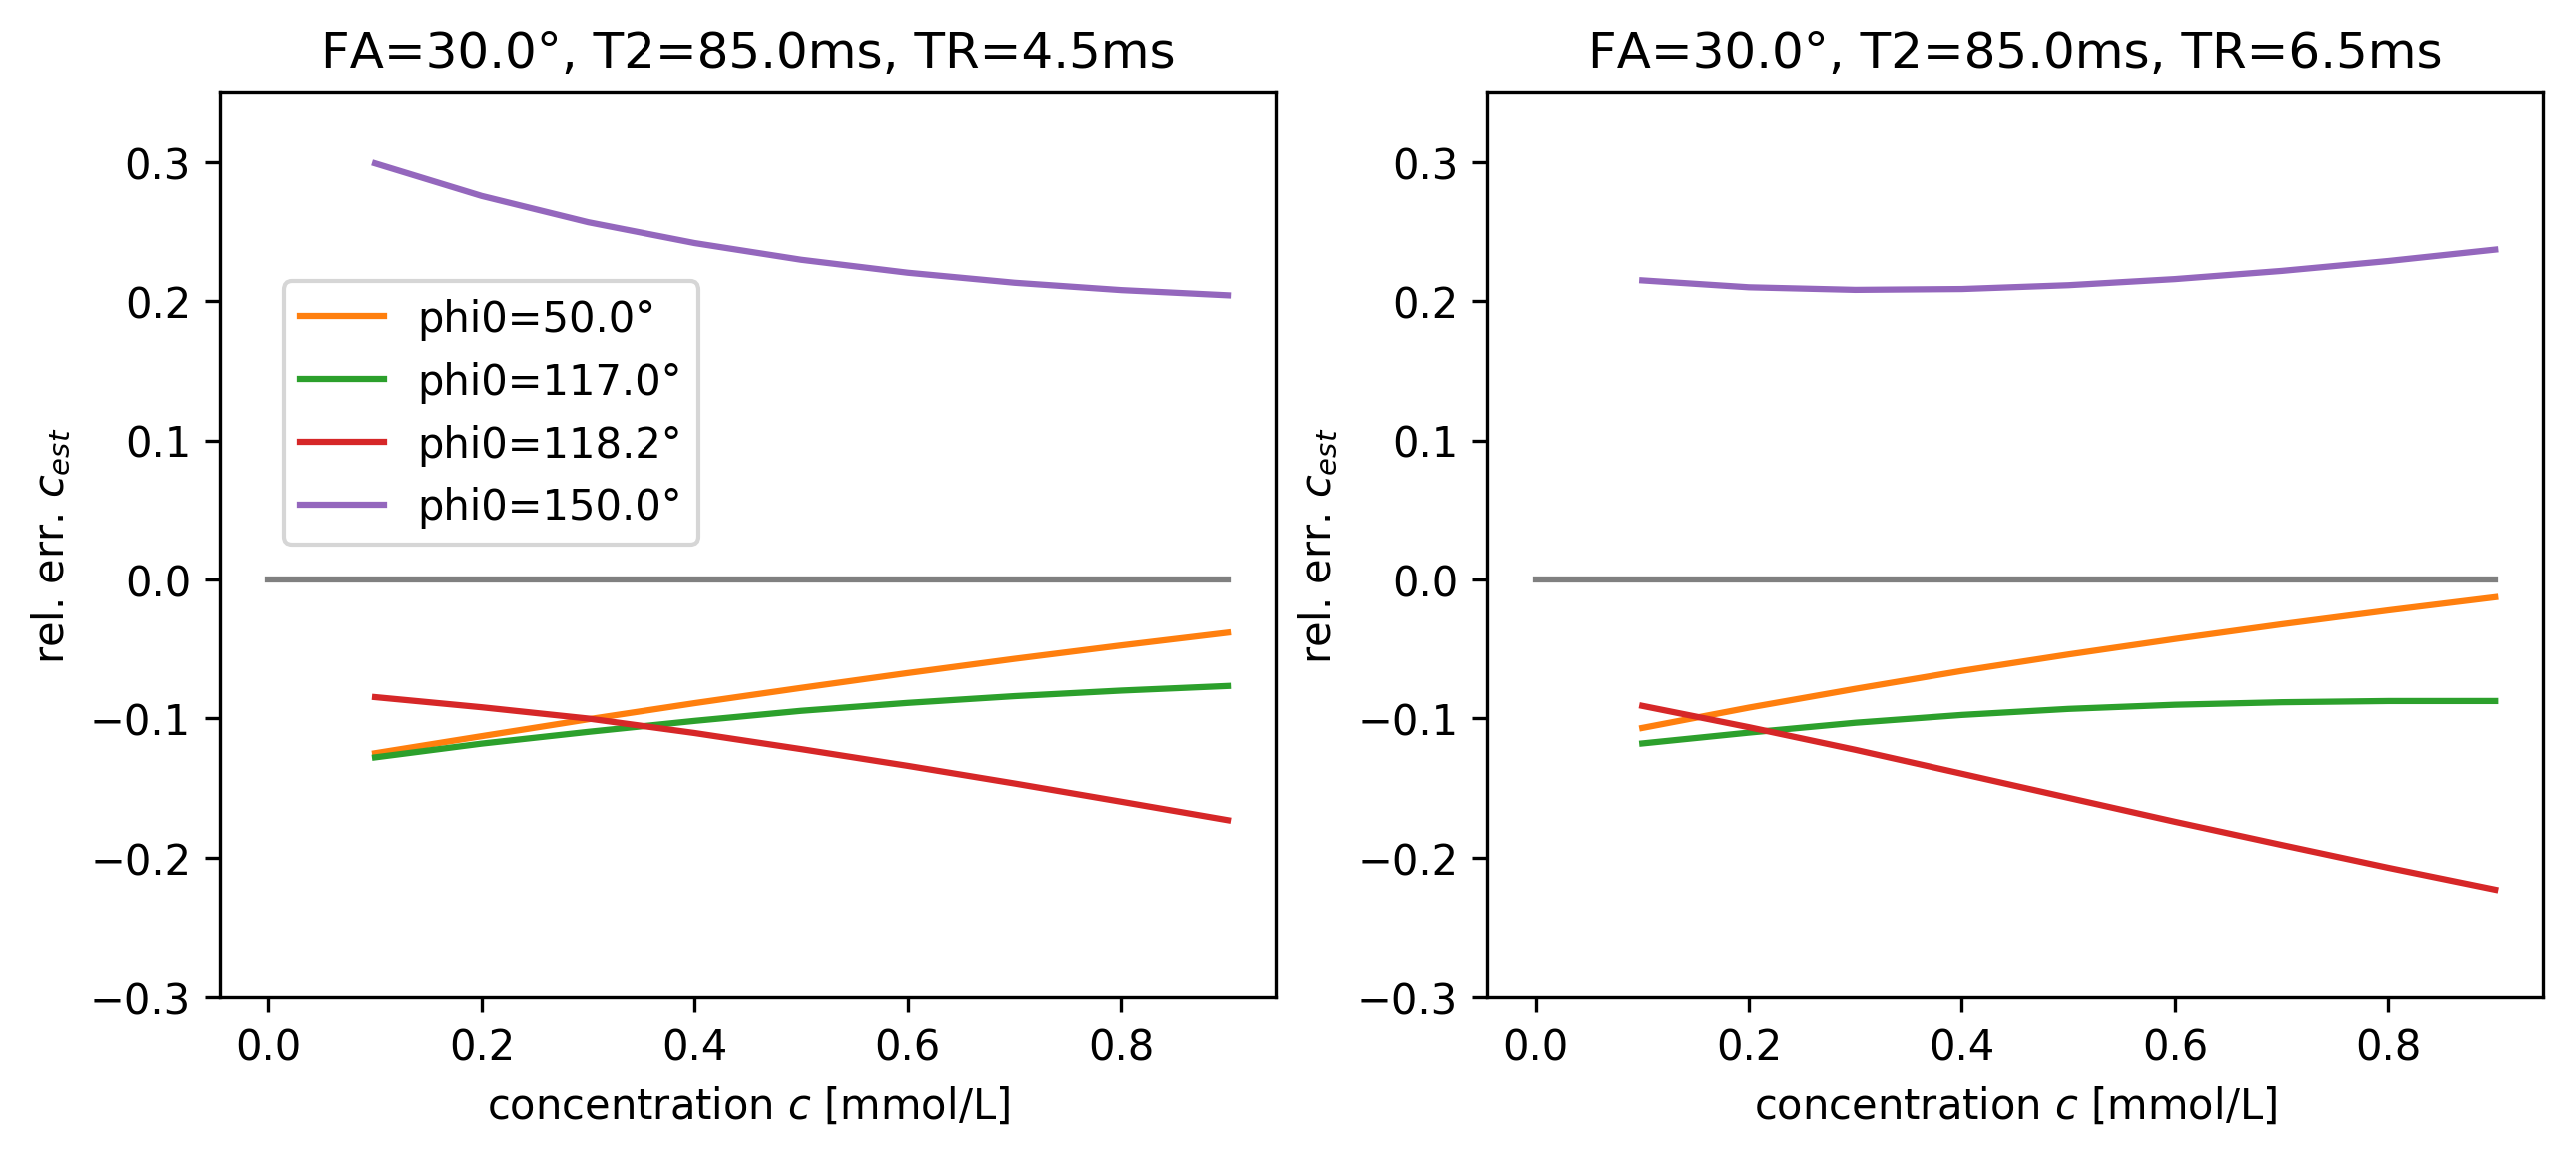
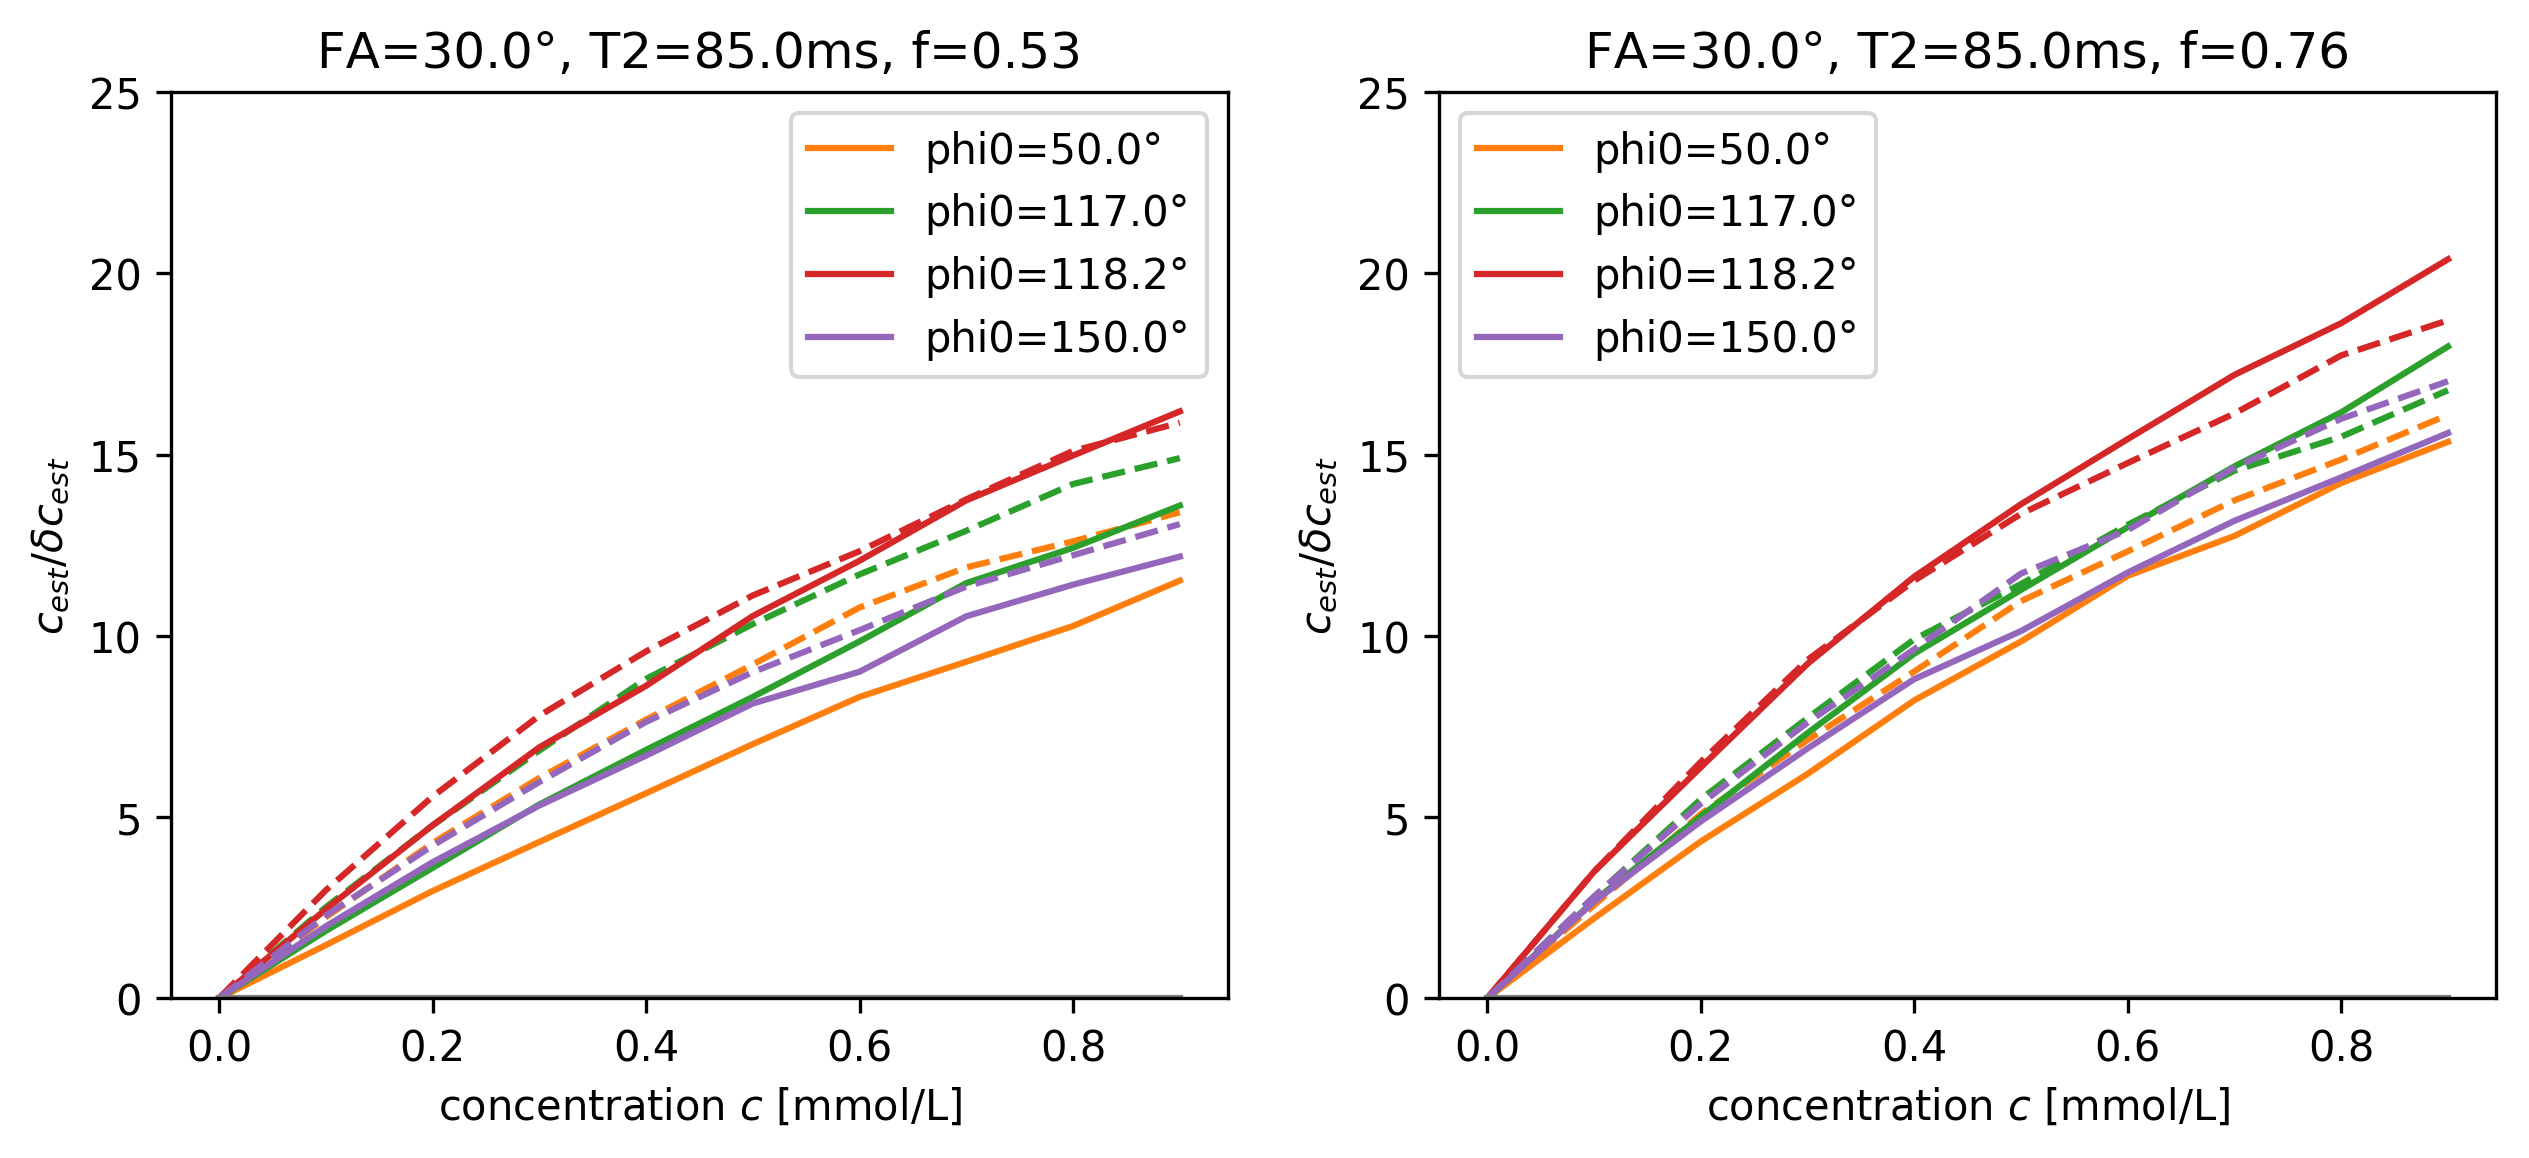
The estimated T1 values in Figure 1 show significant bias, which depends on $$$\phi_0$$$ and reduces as TR increases, i.e. as the ratio TR/T2, which determines the amount of unspoiled transverse magnetization, is reduced. For the visualization of the SNR of T1-mapping in Figure 2, we define the reduction factor f by which the acquisition time for a single image volume is reduced when reducing TR while keeping all other parameters constant. Alternatively, the same reduction in acquisition time could be achieved using parallel imaging with an acceleration factor 1/f, while TR remains fixed, see dashed lines in Figure 2. Biases are also apparent in the estimation of the contrast-agent concentration in Figure 3, again depending on TR and $$$\phi_0$$$. Primarily these are multiplicative biases, which would result in proportional systematic errors in $$$k_{trans}$$$, the surrogate endpoint for the therapy follow-up measurements discussed in the QIBA profile. In addition, nonlinear gain effects are present, which will distort the measured concentration-time curve, leading to modeling errors. These nonlinear gains can even change in sign as a function of TR and flip-angle. Figure 4 shows the effect of acquisition time reduction on the SNR of CA concentration estimation. For smaller f, and for most $$$\phi_0$$$, a small improvement can be seen for the case of parallel imaging.Discussion and Conclusion
Even the strict adherence to the QIBA profile does not guarantee that quantitative results obtained from DCE-MRI data are easily comparable. Systematic errors are caused by incomplete spoiling of the transverse magnetization in the steady-state, which is particularly relevant for sequences with short TR. For the purpose of comparing results from different studies, this problem is augmented by the fact that at least two essential sequence parameters, $$$\phi_0$$$ and the spoiling gradient area, are neither restricted in the QIBA profile nor available after image acquisition. Standardization could be improved by including specifications for $$$\phi_0$$$ and the spoiling gradient area and direction, as well as timing. In the interest of reproducibility and comparability, the exact same sequence should be used for follow-up measurements, since even small changes, e.g. 1 ms change in TR, can lead to significant changes. The main motivation to reduce TR in DCE-MRI is usually to achieve a sufficiently high spatio-temporal resolution. The results shown here suggest that, in view of biases in T1-mapping and SNR in the CA concentration measurement, it may be beneficial to use parallel imaging rather than reducing TR.
Acknowledgements
No acknowledgement found.References
- DCE MRI Technical Committee: DCE MRI Quantification Profile, Quantititve Imaging Biomarkers Alliance, Version 1.0, July 1, 2012. Available from rnsa.org/qiba
- Weigel M., Extended phase graphs: Dephasing, RF pulses, and echoes - pure and simple, JMRI 41, 266 (2015)
- Helms et al., Identification of signal bias in the variable flip angle method by linear display of the algebraic Ernst equation, MRM 66, 669 (2011)
- Schabel and Parker, Uncertainty and bias in contrast concentration measurements using spoiled gradient echo pulse sequences, Phys. Med. Biol. 53, 2345 (2008)
- Keenan et al, Design of a Breast Phantom for Quantitative MRI, JMRI 44, 610 (2016)
- Tofts P. (Editor), Quantitative MRI of the Brain, John Wiley and Sons Ltd. (2003)
- Preibisch and Deichmann, Influence of RF spoiling on the stability and accuracy of T1 mapping based on spoiled FLASH with varying flip angles, MRM 61, 125 (2009)
- Zur et al, Spoiling of transverse magnetization in steady-state sequences, MRM 21, 251 (1991)
- Yarnykh V., Optimal radiofrequency and gradient spoiling for improved accuracy of T1 and B1 measurements using fast steady-state techniques, MRM 63, 1610 (2010) Cheng and Wright, Rapid high-resolution T1 mapping by variable flip angles: Accurate and precise measurements in the presence of radiofrequency field inhomogeneity, MRM 55, 566 (2006)
Figures