2179
Automatic selection of local arterial input functions in perfusion MRI using cluster analysis and priority-flooding1The Florey Institute of Neuroscience and Mental Health, Melbourne, Australia, 2Florey Department of Neuroscience and Mental Health, University of Melbourne, Australia
Synopsis
We present a robust, multi-stage automated local arterial input function (AIF) method to quantify perfusion using dynamic-susceptibility contrast (DSC)-MRI. We show how this approach reduces potential AIF misclassifications observed in existing automated solutions that can lead to quantification errors and artefacts. Examples of our new approach eliminating such artefacts from scans of subjects who exhibit various cerebrovascular abnormalities are provided, with generated perfusion maps further showing regions of higher cerebral blood flow (CBF) relative to established global AIF methods, consistent with a reduction in quantification errors associated with bolus dispersion.
Introduction & Purpose
Quantifying perfusion using dynamic-susceptibility contrast (DSC)-MRI relies on identification of an appropriate arterial input function (AIF)1. Global AIF based methods assume a consistent vascular supply across the brain and can suffer from significant underestimation of cerebral blood flow (CBF) due to delay and dispersion effects2-4, particularly among patients with cerebrovascular diseases. Such errors can be reduced by identifying multiple AIFs, referred to as local AIF methods1.
Importantly, the practical application of any local AIF method in a clinical workflow necessitates an efficient and fully-automated solution. Traditionally, automated local AIF methods have relied on a single computed metric, such as a surrogate measure of bolus arrival time (BAT)5,6, or custom arterial scoring functions7, to identify both local input functions and their associated arterial regions.
Here, we show that the use of a sole criterion to infer vascular supply origins can result in selecting locally suboptimal AIFs. We instead propose a robust, multi-stage automated local AIF method that relies on multiple characteristics of the voxel-specific concentration time-course (CTC) to select input functions and their territories.
Methods
Our 3-stage approach for automatic local AIF identification:
(Stage 1): We begin by segmenting the brain into regions with locally similar vascular supply. Rather than simply equating similarity to spatial proximity, bolus arrival patterns have been shown to be in good agreement with vascular anatomy and physiology6, suggesting BAT is an appropriate metric for estimating arterial regions. As in Willats et al.5 , we define an effective BAT as
$$BAT = FM_C-FM_R+{Tmax}_R$$
where $$$FM_C$$$ is the first-moment of the CTC, and $$$FM_R$$$ and $$${Tmax_R}$$$ are the first-moment and time-to-peak respectively of the global AIF based residue function $$$R(t)$$$. Here, automatic global AIF selection is employed using cluster based analysis as described in Mourisden et al.8 . We subsequently perform a 2D voxel-wise gradient descent on the computed BAT map and associate voxels that share the same local BAT minimum to a single arterial region5,6.
(Stage 2): In contrast to Willats et al.5, due to potential BAT errors we do not assume that locally optimal AIF voxels necessarily correspond to arrival times at local minima. Instead, for each arterial region identified in Stage 1, we perform a cluster based CTC analysis6 to select new locally optimal AIFs, as outlined in Figure 1.
(Stage 3): We then improve our estimates of the arterial territories by applying a priority-flooding transformation9 on the BAT map, subsequently eliminating input functions with relatively small regions that potentially correspond to misclassified venous contributions, as described in Figure 2.
Finally, relative perfusion quantification is determined by performing a voxel-wise CTC deconvolution with the associated local AIF. Specifically, for both global and local AIF methods, we employ a delay-insensitive deconvolution using Tikhonov regularization with a generalized cross-validation (GCV) criterion10. In our subsequent analysis, we refer to the existing5 and our new local AIF method as LAIFold and LAIFnew respectively.
Subjects & Results
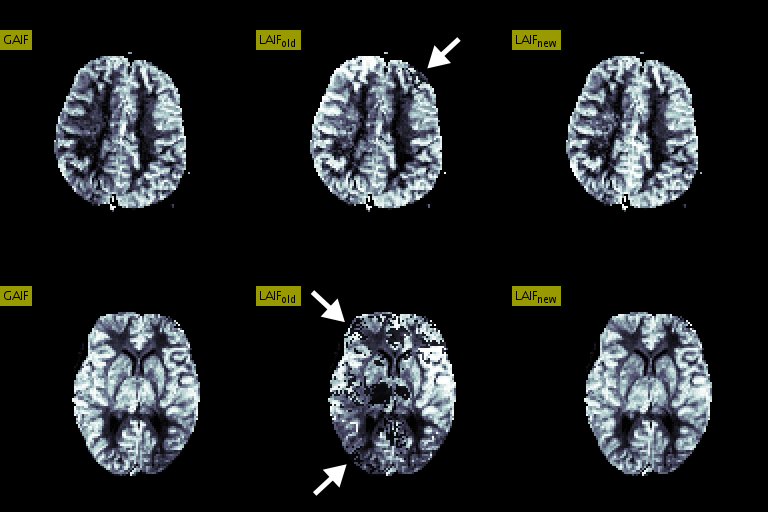
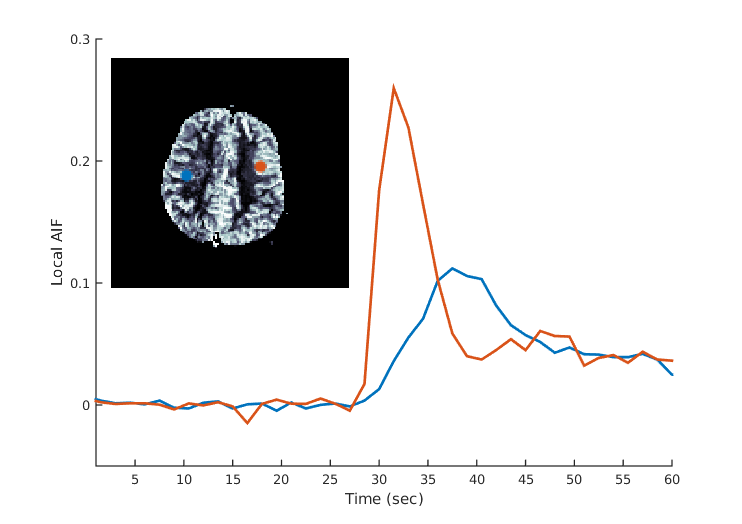
DSC-MRI data were acquired on a 1.5T Siemens scanner (TR=1500ms, 0.15 mmol/kg bolus of Gd-based contrast agent) from 5 patients with a number of cerebrovascular abnormalities. A comparison of CBF maps generated using LAIFold, LAIFnew as well as a conventional global AIF (GAIF) analysis is provided in Figure 3 for two illustrative cases. Here, we highlight examples of suboptimal AIF selections using LAIFold that lead to artefacts that are no longer apparent when applying LAIFnew. Figure 4 showcases the importance of accounting for potential AIF dispersion effects to minimize quantification errors.Discussion & Conclusion
Validation of any local AIF method is challenging due to the lack of an established gold standard1,5,11. However, we have demonstrated that relying on a single criterion to select locally optimal AIF voxels can result in perfusion quantification errors that in some instances yield clearly apparent artefacts.
Our proposed solution is an automatic multi-stage local AIF method that utilises local cluster based CTC analysis along with a priority-flooding transformation to robustly identify both locally optimal input functions and their corresponding arterial regions, showing comparatively improved perfusion maps that eliminated previously pronounced artefacts. Moreover, relative to GAIF results, these maps exhibited regions of increased CBF, consistent with a more accurate perfusion estimate due to the reduction in temporal dispersion errors.
Acknowledgements
No acknowledgement found.References
1. Calamante, F. Arterial input function in perfusion MRI: a comprehensive review. Progress in nuclear magnetic resonance spectroscopy, 2013;74:1-32.
2. Calamante, F., Gadian, D. G., & Connelly, A. Delay and dispersion effects in dynamic susceptibility contrast MRI: simulations using singular value decomposition. Magnetic resonance in medicine, 2000;44(3):466-473.
3. Calamante, F., Yim, P. J., & Cebral, J. R. Estimation of bolus dispersion effects in perfusion MRI using image-based computational fluid dynamics. Neuroimage, 2003;19(2):341-353.
4. Wu, O., Østergaard, L., Weisskoff, R. M., Benner, T., Rosen, B. R., & Sorensen, A. G. Tracer arrival timing‐insensitive technique for estimating flow in MR perfusion‐weighted imaging using singular value decomposition with a block‐circulant deconvolution matrix. Magnetic resonance in medicine, 2003;50(1):164-174.
5. Willats, L., Christensen, S., K Ma, H., A Donnan, G., Connelly, A., & Calamante, F. Validating a local Arterial Input Function method for improved perfusion quantification in stroke. Journal of Cerebral Blood Flow & Metabolism, 2011;31(11):2189-2198.
6. Christensen, S., Calamante, F., Hjort, N., Wu, O., Blankholm, A. D., Desmond, P., ... & Østergaard, L. Inferring origin of vascular supply from tracer arrival timing patterns using bolus tracking MRI. Journal of Magnetic Resonance Imaging, 2008;27(6):1371-1381.
7. Lorenz, C., Benner, T., Chen, P. J., Lopez, C. J., Ay, H., Zhu, M. W., ... & Nuutinen, J. Automated perfusion‐weighted MRI using localized arterial input functions. Journal of Magnetic Resonance Imaging, 2006;24(5):1133-1139.
8. Mouridsen, K., Christensen, S., Gyldensted, L., & Østergaard, L. Automatic selection of arterial input function using cluster analysis. Magnetic resonance in medicine, 2006;55(3):524-531.
9. Barnes, R., Lehman, C., & Mulla, D. Priority-flood: An optimal depression-filling and watershed-labeling algorithm for digital elevation models. Computers & Geosciences, 2014;62:117-127.
10. Sourbron, S., Dujardin, M., Makkat, S., & Luypaert, R. Pixel-by-pixel deconvolution of bolus-tracking data: optimization and implementation. Physics in medicine and biology, 2006;52(2):429.
11. Calamante, F., Mørup, M., & Hansen, L. K. Defining a local arterial input function for perfusion MRI using independent component analysis. Magnetic resonance in Medicine, 2004;52(4):789-797.
Figures
Figure 1. Identifying local vascular supply origins (local AIFs).
a) Arterial regions identified by voxel-wise gradient descent of BAT (Stage 1)
b) Filter out CTC voxels to discard 30% of curves with smallest CTC area and subsequently discard 25% of curves with largest roughness.
c) (Stage 2): For each region, partition the remaining CTCs using an iterative k-means cluster analysis, akin to the global AIF approach8, to efficiently isolate apparent arterial curves that are temporally similar. Specifically, the final partitioning with lowest first-moment is considered to be optimal and all resulting curves are normalised and classified as local AIFs.
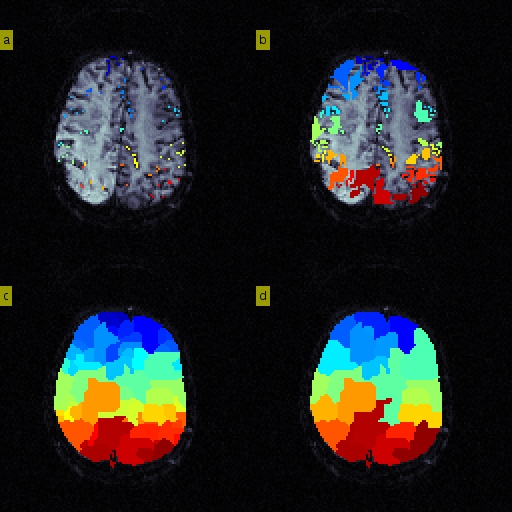
Figure 2. Priority-flooding to redefine arterial regions
Stage 3:
a) Initialise new arterial region origins to LAIF voxels identified in Stage 2. For each origin, compute the neighbouring voxel BAT gradients and store them in a priority queue that maintains the voxel with smallest local gradient at the head.
b) Iteratively visit the head of the queue and expand the corresponding arterial region, further adding unvisited neighbouring gradients. Here, we show flooding after 1000 iterations.
c) Segmentation after flooding is complete.
d) Arterial regions that occupy <5% of available voxels are absorbed into the neighbouring region with closest median BAT