2178
Robust non-contrast perfusion imaging of whole-lungs using multi-slice FAIR at 3T1Bioengineering, University of Texas at Dallas, Richardson, TX, United States, 2Radiology, UT Southwestern Medical Center, Dallas, TX, United States, 3Advanced Imaging Research Center, UT Southwestern Medical Center, Dallas, TX, United States
Synopsis
2D Flow Alternating Inversion Recovery (FAIR) has been applied to measure non-contrast pulmonary perfusion in research environments, but its lack of coverage limits its applicability for clinical perfusion evaluation, where whole-lung coverage is often necessary. In this study, we optimized the multi-slice FAIR technique, including background suppression for robust image quality and inflow saturation to minimize the blood volume contribution, to measure pulmonary perfusion across the whole-lung at 3T.
Introduction
Arterial spin labeling (ASL) can measure quantitative pulmonary perfusion noninvasively, without contrast, and could be beneficial in monitoring the development of chronic lung diseases. Flow Alternating Inversion Recovery (FAIR)-based ASL has been widely applied for pulmonary perfusion imaging1-3, but has some disadvantages, which if improved upon, could make FAIR a more useful clinical tool. FAIR images contain characteristic bright signal in large pulmonary vessels, which obstruct the visualization of underlying true tissue perfusion. Additionally, perfusion imaging using FAIR has so far been limited to a single slice, limiting its applicability for clinical perfusion evaluation. Since chronic pulmonary diseases heterogeneously affect the lung, assessment of their progression and treatment require whole-lung perfusion imaging. Therefore, the purpose of this study was to combine multi-slice FAIR for whole-lung coverage with inflow saturation to suppress signal from major pulmonary vasculature for improved visualization of perfusion, and to optimize background suppression pulses for robust image quality.Methods
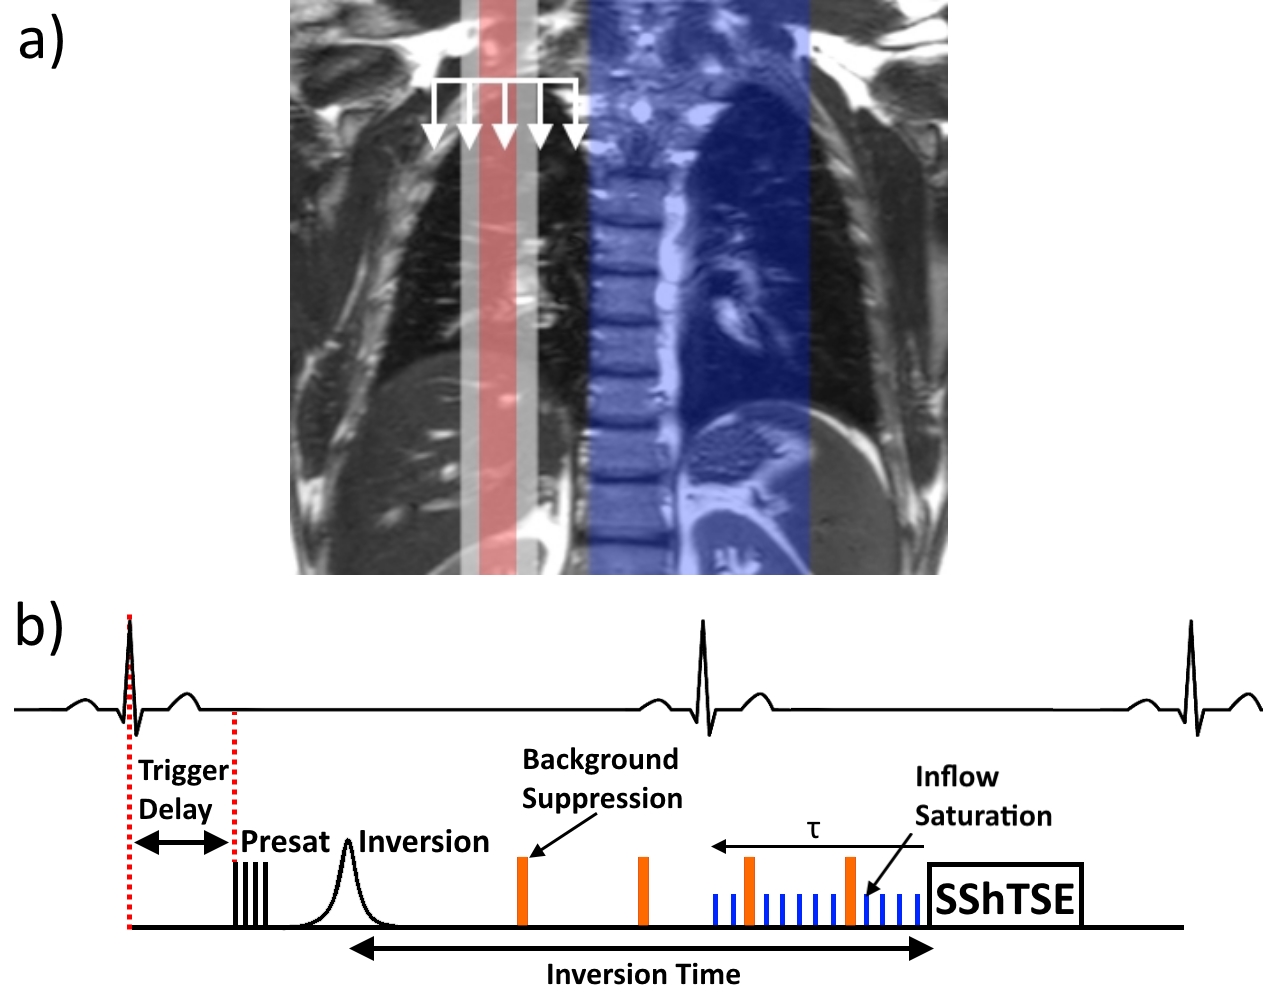
Sagittal multi-slice FAIR perfusion images were acquired in 3 normal volunteers on a 3T Philips Ingenia, following IRB approval and written informed consent. The FAIR sequence (Fig.1b) began with saturation of the imaging region, followed by labeling with a pair of selective and non-selective inversions using a hyperbolic secant pulse. A post-labeling delay of one cardiac cycle (R-R interval)3 was used to allow labeled blood to perfuse the lungs. A SShTSE acquisition was used to minimize the susceptibility artifacts due to B0 inhomogeneities in the lungs. The beginning of the sequence (saturation pulse) was ECG-triggered such that the acquisition happens during the diastolic phase of the following cardiac cycle. 5 slices were acquired to cover the entire right lung with 3 signal averages over 3 minutes of guided breathing. The repetition time was 6s to allow a normal subject breathing rate, slice thickness = 15mm, and resolution = 3x3mm2.
Background suppression
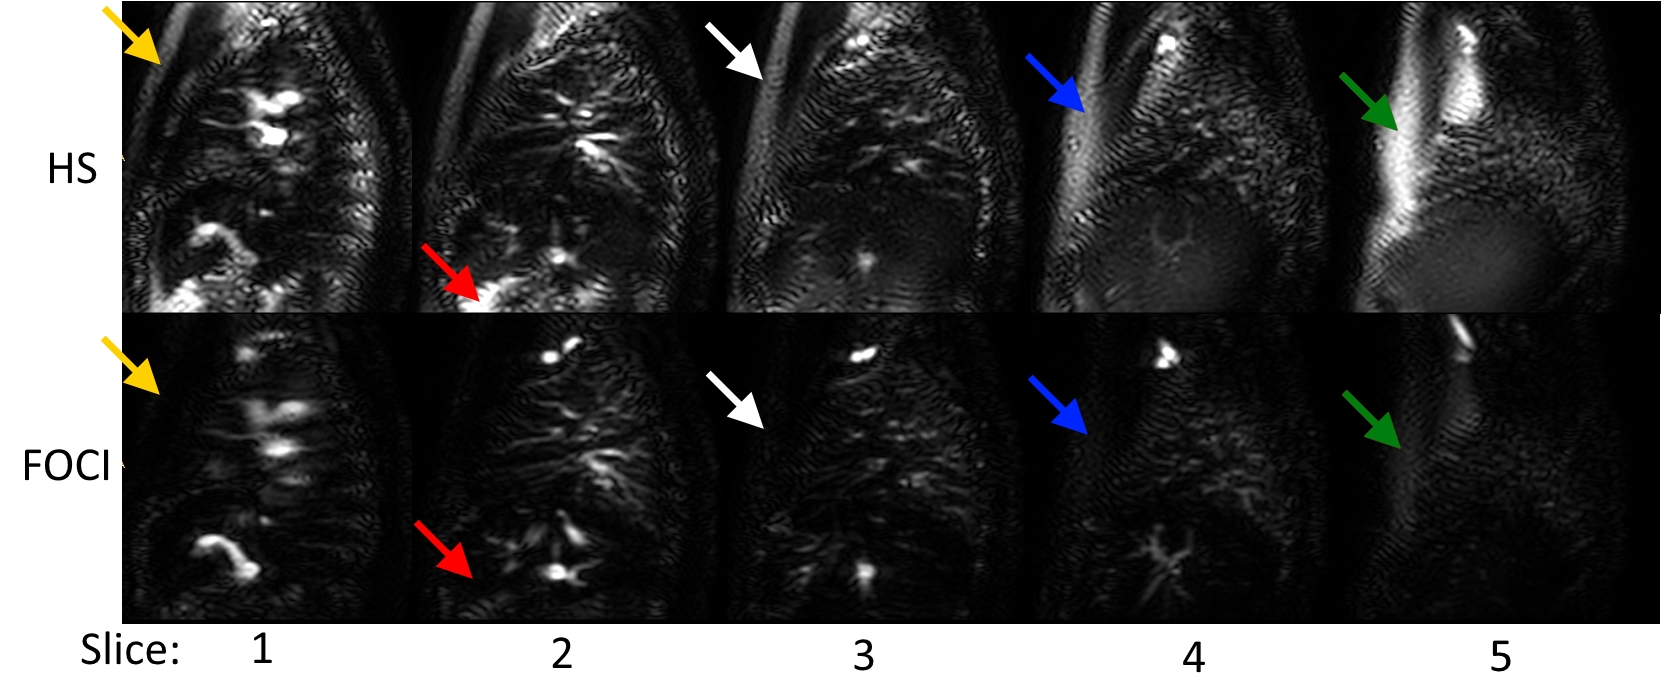
The hyperbolic secant (HS) pulse is commonly used for background suppression4, but the C-FOCI pulse has been shown to be more robust to B0 and B1 variations for fat suppression5. This should improve inversion efficiency in areas of increased off-resonance for efficient background suppression at 3T. Both HS and C-FOCI pulses were evaluated for background suppression using automatically calculated timings for the chosen inversion time6.
Inflow saturation
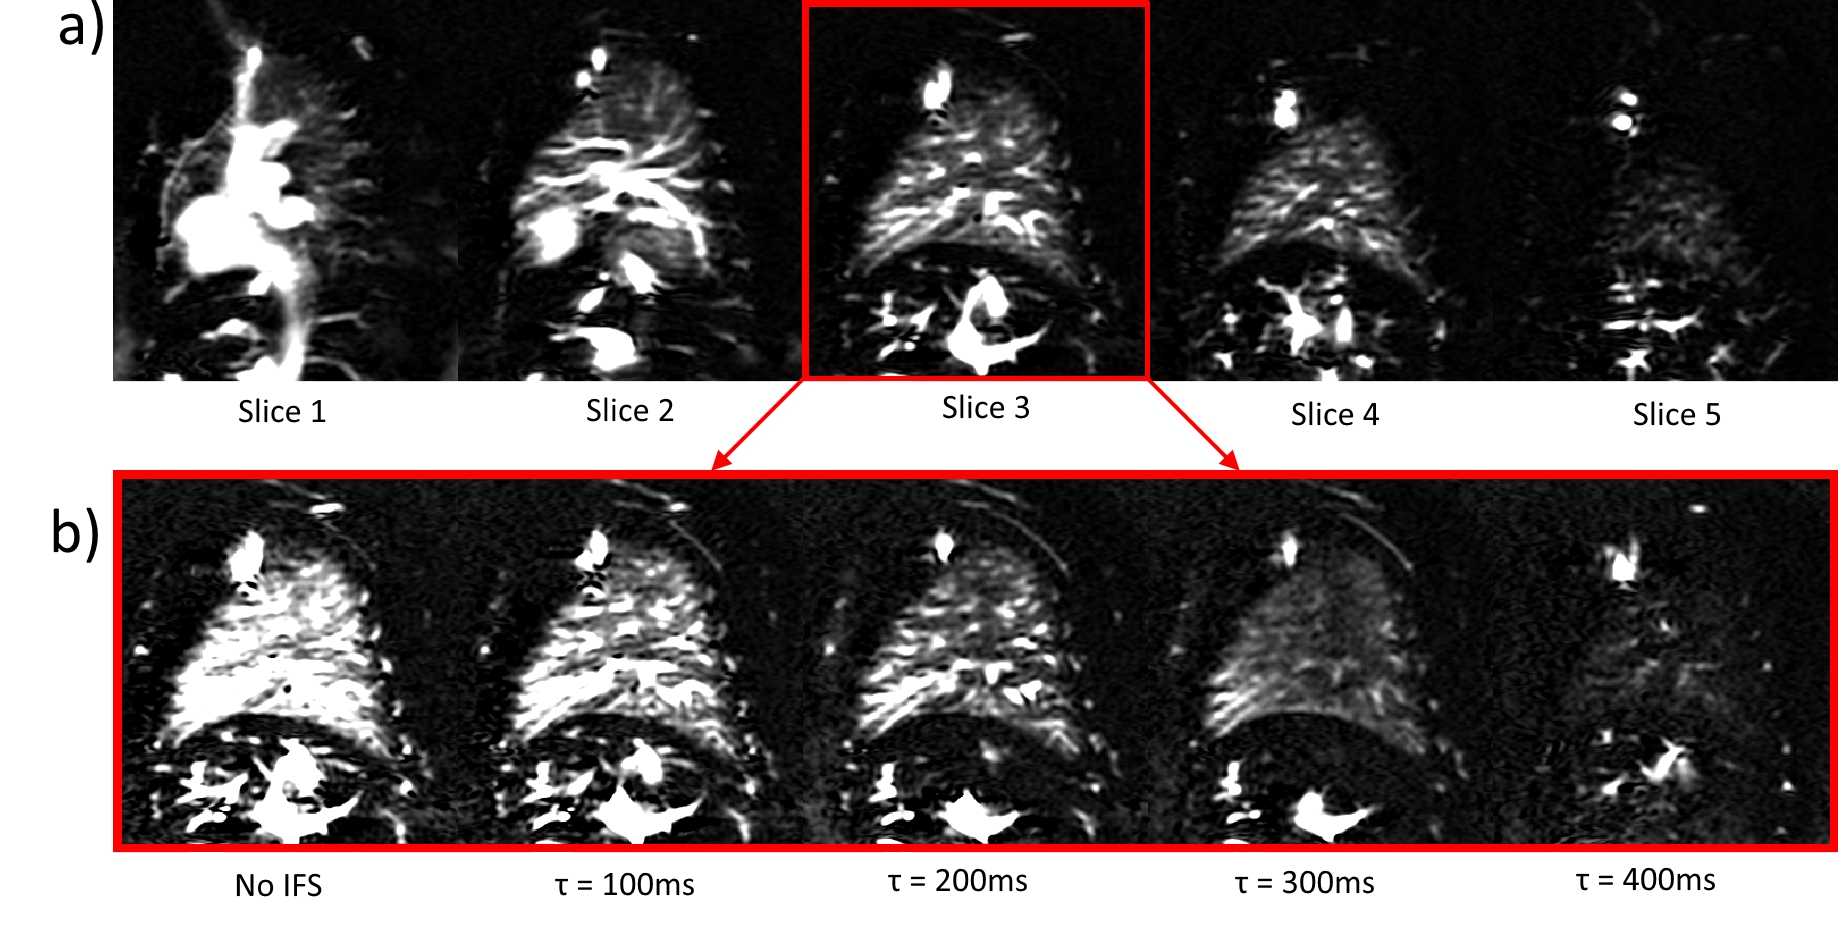
Inflow saturation was applied periodically towards the end of the post-labeling delay for duration τ (Fig.1B), to minimize the contribution of blood volume signal in the major pulmonary vasculature. This also destroys the tail end of the inflowing perfusion signal, resulting in a fixed-width labeled bolus7. To evaluate the effects of inflow saturation on the perfusion-weighted images, the duration of the inflow saturation period (τ) was varied from 0-400ms in 100ms increments.
Results
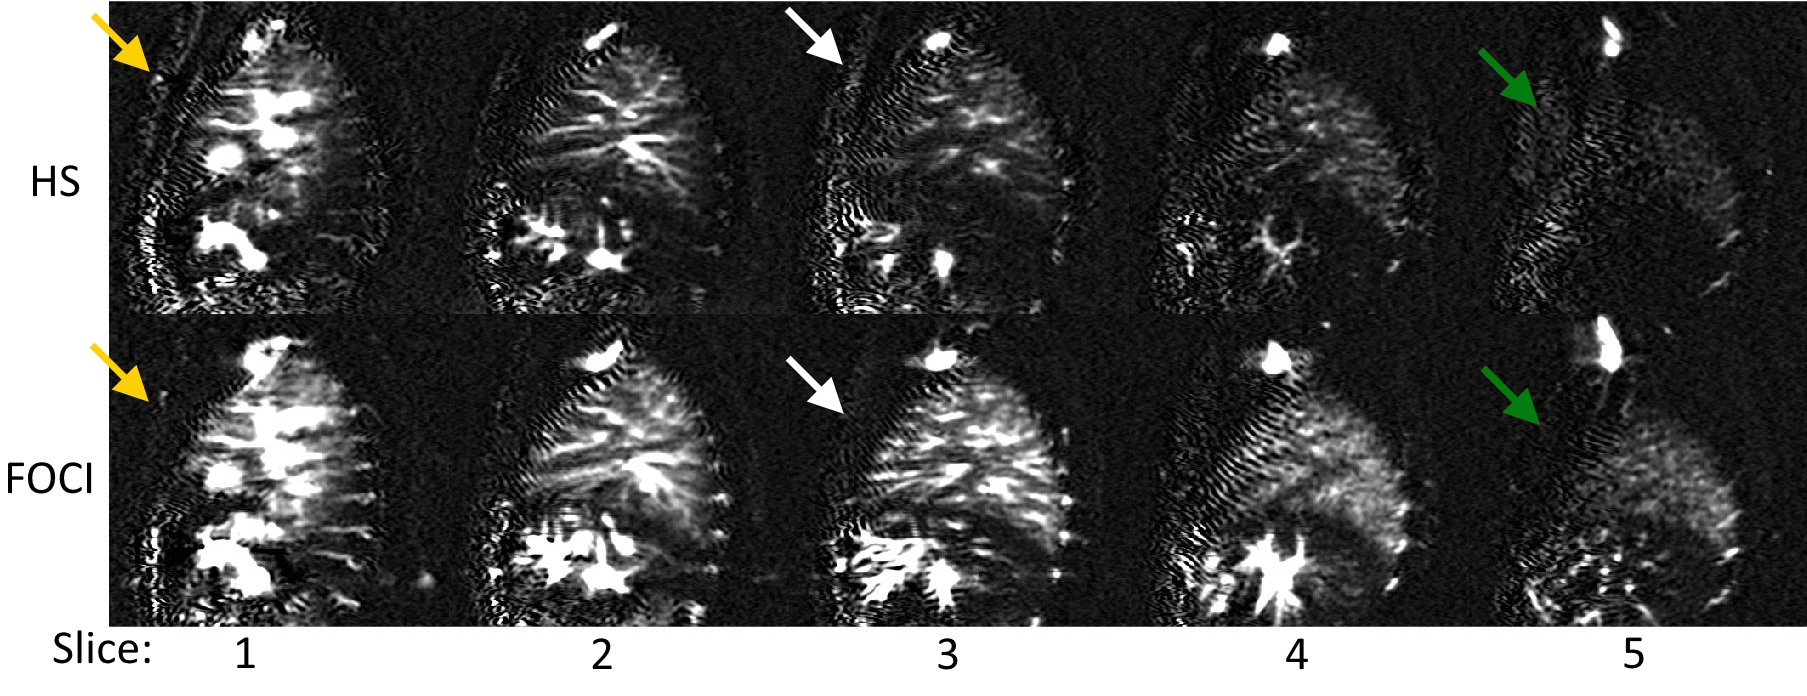
Figure 2 shows the control images across the lung with HS and FOCI background suppression pulses, showing more complete suppression in regions of increased off-resonance with FOCI. Figure 3 shows the subtracted perfusion-weighted images from the same scan, with FOCI providing improved SNR and reduced artifacts compared to HS. Large pulmonary vessels can be seen in each of these images, especially closer to the heart. Figure 4a shows perfusion-weighted images across the lung in another volunteer, with bright vascular signal obstructing the view of the underlying perfusion. Fig.4b shows the center slice with varied inflow saturation duration, τ, resulting in a range of reduction in the perfusion signal, starting from the larger vessels down to almost complete saturation of the tissue perfusion, as saturation pulses are applied earlier in the post-labeling delay. In this subject, the optimal τ was 300ms, where perfusion in the parenchyma is visible with minimal vascular signal.Discussion
Multi-slice FAIR images allowed for perfusion evaluation across the entire lung. Background suppression was improved in regions of increased off-resonance with the FOCI inversion pulse compared to the commonly used HS pulse. The range of inflow saturation period duration showed that an optimal perfusion bolus width can be found that suppresses major vessels, while still showing underlying tissue perfusion. Future work will include determining an optimized τ in normal volunteers, possibly based on heart rate. While a similar τ to that found in this study may provide sufficient vessel suppression in normal volunteers, this timing will need to be adjusted and optimized for different patient populations with varied arival times of inflowing blood. Future studies will quantify whole-lung perfusion using the modified equation for the fixed-width perfusion bolus7, and inflow saturation and FOCI background suppression will be applied for multi-slice FAIR across both lungs for complete pulmonary perfusion evaluation.Acknowledgements
No acknowledgement found.References
1. Henderson AC, Prisk GK, Levin DL, Hopkins SR, Buxton RB. Characterizing pulmonary blood flow distribution measured using arterial spin labeling. NMR Biomed. 2009;22(10):1025-1035.
2. Joshua S. Greer, Yue Zhang, Christopher Maroules, Orhan K. Oz, Ivan Pedrosa, Madhuranthakam AJ. Non-contrast Pulmonary Perfusion at 3T using FAIR with inflow saturation and background suppression. International Society for Magnetic Resonance in Medicine. 2016; Singapore.
3. Bolar DS, Levin DL, Hopkins SR, et al. Quantification of regional pulmonary blood flow using ASL-FAIRER. Magn Reson Med. 2006;55(6):1308-1317.
4. Garcia DM, Duhamel G, Alsop DC. Efficiency of inversion pulses for background suppressed arterial spin labeling. Magn Reson Med. 2005;54(2):366-372.
5. Xinzeng Wang, Joshua S. Greer, Ivan E. Dimitrov, Ananth J. Madhuranthakam. B0 and B1 Insensitive Robust Fat Suppression using Frequency Offset Corrected Inversion (FOCI). International Society for Magnetic Resonance in Medicine 2016; Singapore.
6. Maleki N, Dai W, Alsop DC. Optimization of background suppression for arterial spin labeling perfusion imaging. MAGMA. 2012;25(2):127-133.
7. Wong EC, Buxton RB, Frank LR. Quantitative imaging of perfusion using a single subtraction (QUIPSS and QUIPSS II). Magnetic resonance in medicine. 1998;39(5):702-708.
Figures