2176
Regional Oxygen Extraction Fraction Measurements in the Middle Cerebral Artery Territory using Selective Localised T2-Relaxation-Under-Spin-Tagging (SL-TRUST)1Wellcome Centre for Integrative Neuroimaging, FMRIB, University of Oxford, Oxford, United Kingdom
Synopsis
Regional measurements of brain tissue oxygen extraction fraction (OEF) are an important indicator of tissue physiology and disease. We present an improved Selective Localised T2-relaxation-under-spin-tagging (SL-TRUST) sequence for regional venous blood T2 measurements, decoded in the superior sagittal sinus, from which cerebral tissue OEF can be calculated. A spatially selective WET saturation scheme is used to saturate signal outside the region of interest, enabling OEF measurements in a hemisphere and in the middle cerebral artery (MCA) territory. Using a multi-TI inversion recovery sequence we calculate subject specific blood hematocrit in the sagittal sinus and thus improve our OEF calibration.
Introduction
Regional measurements of brain tissue oxygen extraction fraction (OEF) are an important indicator of tissue physiology and disease. Here we present further developments on the novel MR sequence, Selective Localised T2-relaxation-under-spin-tagging (SL-TRUST), to achieve spatially specific venous blood T2 measurements of cerebral tissue, decoded in the superior sagittal sinus (SSS) vein. Combined with a non-invasive measure of global venous blood T1 to estimate hematocrit (hct) in the SSS, we calculate regional tissue OEF values in a hemisphere and in the middle cerebral artery (MCA) territory. The MCA territory is an area particularly prone to stroke and therefore a regional OEF measure is desirable.Theory
Blood T1 and T2 are both dependent on blood hct and oxygenation, however blood T2 is more strongly dependent on oxygenation, and blood T1 is more strongly dependent on hct [1]. Assuming arterial blood to be fully oxygenated the relationship between venous blood T2 and tissue OEF is: $$\frac{1}{T_2} = A + B \cdot OEF + C \cdot OEF^{2}$$ where $$$A$$$, $$$B$$$, and $$$C$$$ are blood hct dependent coefficients [2]. A similar calibration exists between blood T1 and hct [3]: $$\frac{1}{T_1} = (0.70 \pm 0.11) \cdot hct + (0.27 \pm 0.05)$$
Many studies assume blood hematocrit to be uniform across subjects but this is a poor assumption, espeically in patient populations where hematocrit may be atypical [4]. By measuring both venous blood T1 and T2, we may improve on this assumption and estimate tissue OEF.
SL-TRUST is an MR sequence in which a global T2 weighting is applied and the venous blood T2-weighted signal is subsequently decoded in the SSS after a delay TI (Figure 1) [5,6]. In order to achieve localised T2 measurements, we insert a spatially selective WET saturation scheme [6,7]. These WET RF pulses are cosine modulated such that they saturate regions of tissue, straddling a region of interest. Thus, the venous blood signal measured in the SSS is spatially specific.
Global venous blood T1 measurements are achieved using a multi-TI inversion recovery sequence. For each inversion time global ("tag") and slice selective ("control") inversion pulses remove static tissue signal and thus minimize partial volume effects (Figure 2).
Method
Data from 12 healthy participants (age 24-46yrs; 9 males, 3 females) were acquired on a 3T Siemens Verio system (32 channel head receive coil), 5 of which included venous blood T1 measurements to calculate hct and improve T2 - OEF calibration. In a subset of 4 individuals we acquired repeat scans to assess reproducibility.
MR protocol: a) a global T2 measurement using conventional TRUST, b) two blood T2 measurements (hemispheric, and in a 50x60x70mm3 region within the MCA territory) using SL-TRUST (TR/TI = 4000/1200ms, $$$\tau_{CPMG} = 10 $$$ms , eTE = 0, 40, 80, 120, 160, 200ms), and c) a multi-TI inversion recovery to measure venous blood T1 (TR = 10s, initial TI = 100ms, $$$\Delta$$$TI = 550ms, 9 TI measurements). Total acquisition time: 20 minutes.
Following pairwise subtraction of tag and control images,
pixel intensities within the region of interest over the SSS were averaged and normalised (Figure 2). T1 and T2 values were obtained from an exponential fit in MATLAB.
Results
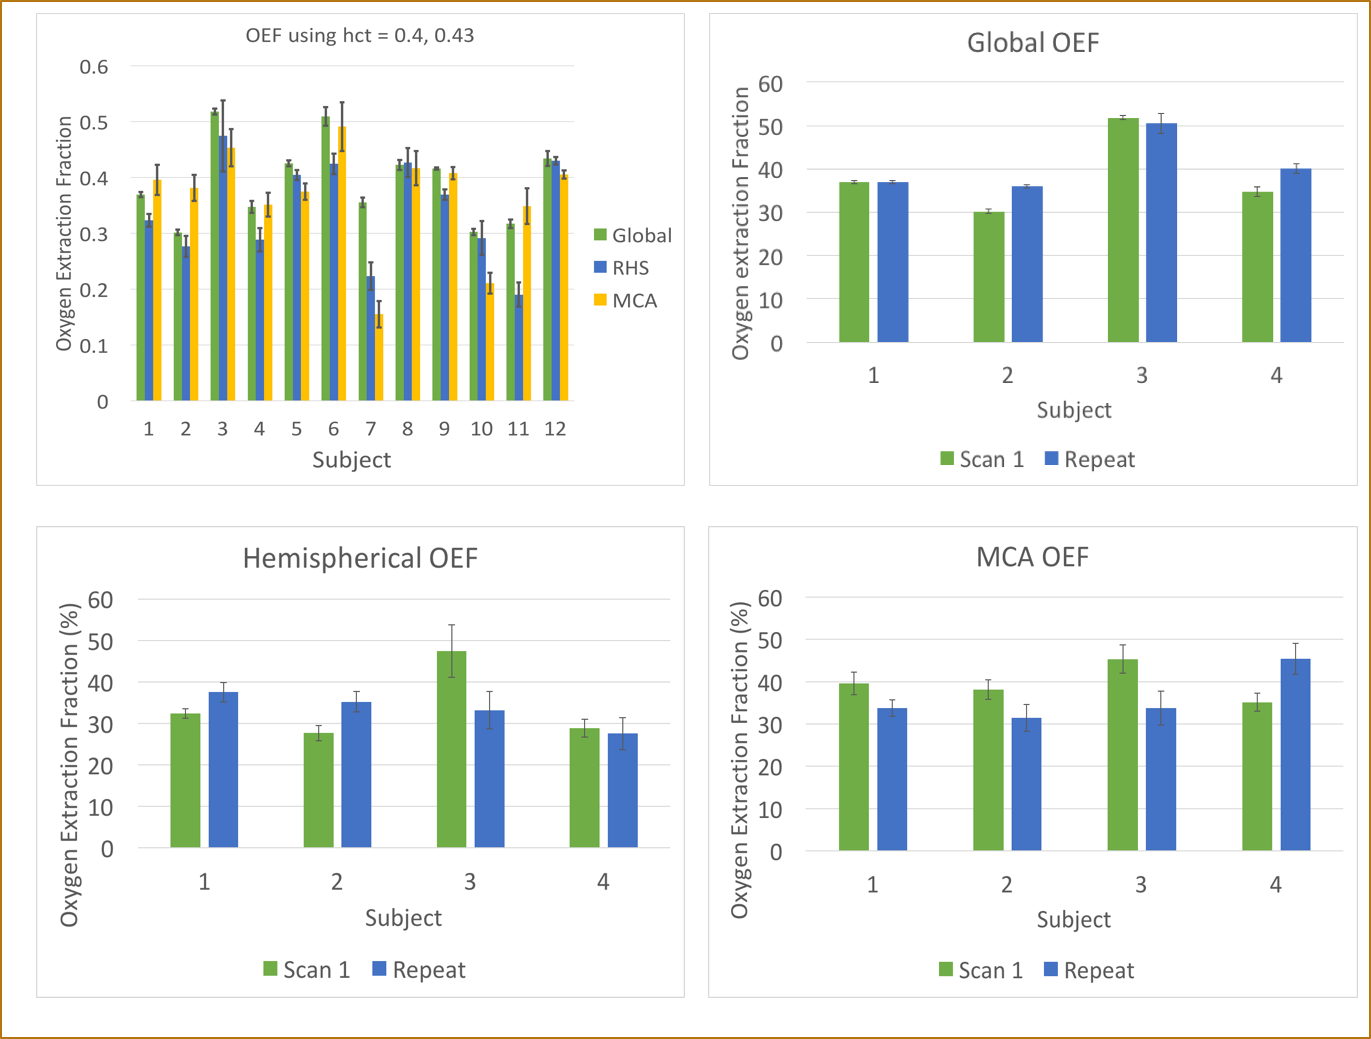
Pairwise subtraction, and the temporal signals for both T1 and T2 of a representative volunteer are shown in Figure 2. The values obtained in all volunteers, along with any repeat scans, are summarised in Table 1 and Figure 3. Prior to normalisation the average signal decrease between global and hemispheric measurements was 62%, and between global to MCA territory measurements was 80%, indicating how much of the venous blood signal was removed via the WET saturation. Cases for which subject specific hematocrit was calculated using a T1 measurement are shown in Table 2, along with the calculated OEF values.
Our calculated hematocrit range was 0.344-0.459, (mean: 0.405) which matches literature values well [8]. Our average OEF values of 39.3 ± 0.9%, 33.5 ± 2.0%, and 35.6 ± 2.5% for global, hemispheric, and the MCA territory respectively, match expected physiological values [2].
Conclusion
We have demonstrated an improved method for acquiring spatially localised OEF values in cerebral tissue using SL-TRUST [6]. Including a non-invasive measure of hematocrit using blood T1 improves the applicability of our method in patient groups, where hematocrit may be atypical.
We now look to verify the sequence and assess sensitivity to changes in OEF in patients. Existing limitations of the method include low SNR and thus variability in T2. As well as improving the SNR and repeatability of our T2 measurement, current work involves improving our T1 acqustition using a Look-Locker acquisition approach [8,9].
Acknowledgements
This work was supported by funding from the Engineering and Physical Sciences Research Council (EPSRC) and Medical Research Council (MRC) [grant number EP/L016052/1], the Dunhill Medical Trust and the Royal Academy of Engineering.References
[1] Hales, P. W., Kirkham, F. J., & Clark, C. A. A general model to calculate the spin-lattice (T1) relaxation time of blood, accounting for haematocrit, oxygen saturation and magnetic field strength. Journal of Cerebral Blood Flow & Metabolism, 36(2), 370-374, 2016.
[2] Xavier Golay, M Johanna Silvennoinen, Jinyuan Zhou, Chekesha S Clingman, Risto A Kauppinen, James J Pekar, and Peter van Zij. Measurement of tissue oxygen extraction ratios from venous blood t2: increased precision and validation of principle. Magnetic resonance in medicine, 46(2):282–291, 2001.
[3] Shimada, K., Nagasaka, T., Shidahara, M., Machida, Y., & Tamura, H. In vivo measurement of longitudinal relaxation time of human blood by inversion-recovery fast gradient-echo MR imaging at 3T. Magnetic Resonance in Medical Sciences, 11(4), 265-271, 2012.
[4] Thomas Christen, Jia Guo, Wendy Wei Ni, Michael Moseley, Greg Zaharchuk. Measuring blood oxygenation and hematocrit with a combined T2 and T1 approach: Initial experience in humans. In: Proceedings of the 25th Annual ISMRM Scientific Meeting, Honolulu, Hawaii, ISMRM, 2017.
[5] Hanzhang Lu and Yulin Ge. Quantitative evaluation of oxygenation in venous vessels using t2- relaxation-under-spin-tagging mri. Magnetic resonance in medicine, 60(2):357–363, 2008.
[6] Caitlin O'Brien, Thomas Okell and Peter Jezzard. Spatially localized measurements of oxygen extraction fraction using modified T2-relaxation-under-spin-tagging (SL-TRUST). In: Proceedings of the 25th Annual ISMRM Scientific Meeting, Honolulu, Hawaii, ISMRM, 2017.
[7] Gallichan D. Measuring cerebral blood flow using arterial spin labelling with magnetic resoance imaging (unpublished doctoral thesis). University of Oxford, United Kingdom, 2007.
[8] Marta Varela, Joseph V Hajnal, Esben T Petersen, Xavier Golay, Nazakat Merchant, and David J Larkman. A method for rapid in vivo measurement of blood t1. NMR in biomedicine, 24(1):80–88, 2011.
[9] Wen-Chau Wu, Varsha Jain, Cheng Li, Mariel Giannetta, Hallam Hurt, Felix W Wehrli, and Danny JJ Wang. In vivo venous blood t1 measurement using inversion recovery true-fisp in children and adults. Magnetic resonance in medicine, 64(4):1140–1147, 2010.
[10] Walsh, D. O., Gmitro, A. F., & Marcellin, M. W. Adaptive reconstruction of phased array MR imagery. Magnetic Resonance in Medicine, 43(5), 682-690, 2000.
Figures
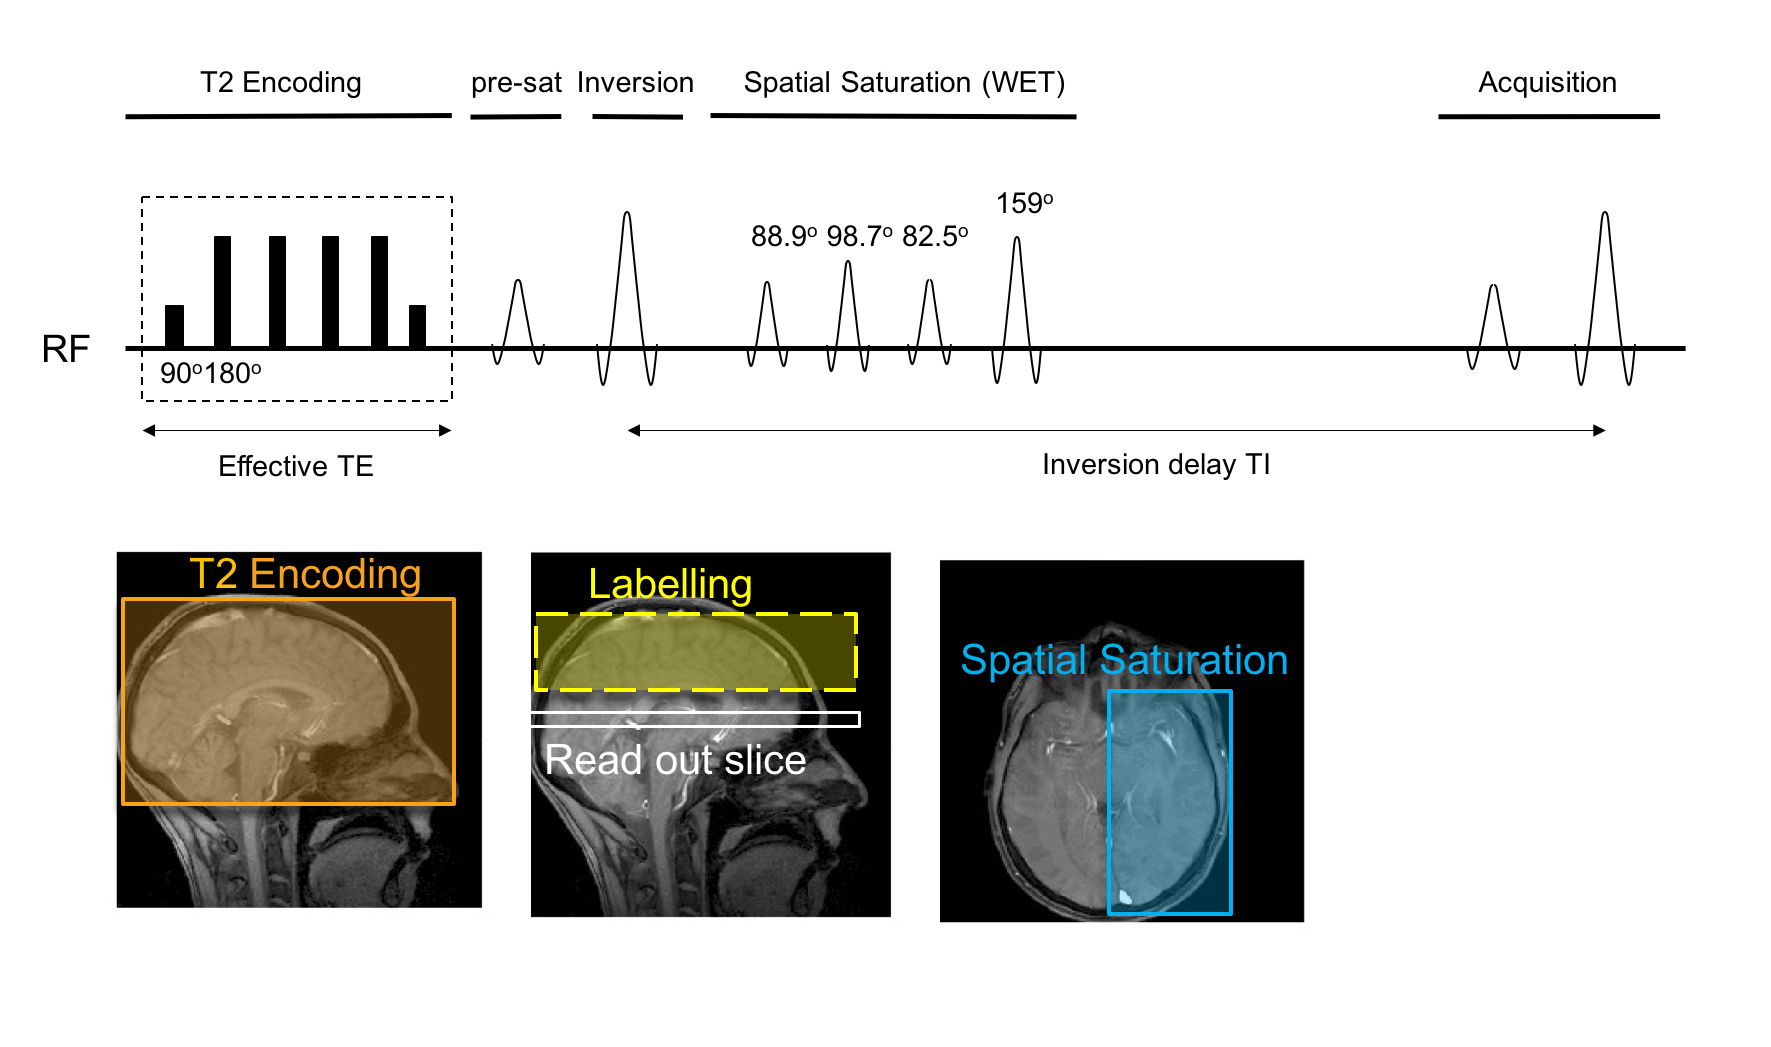
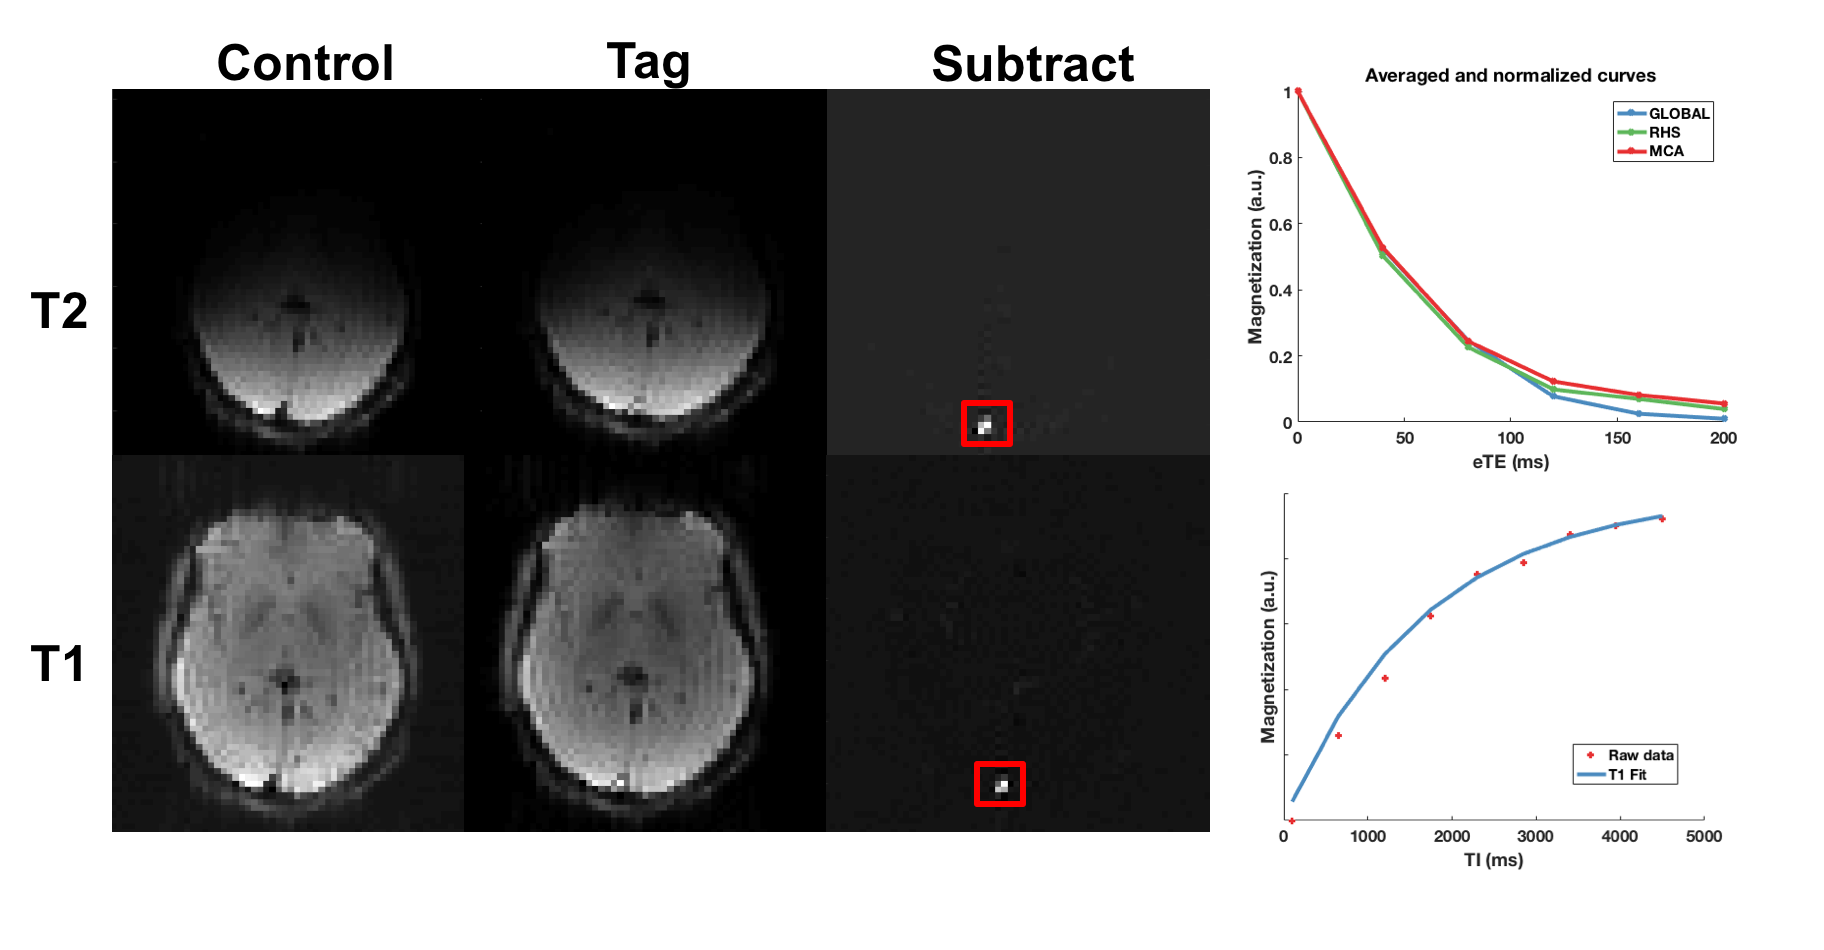
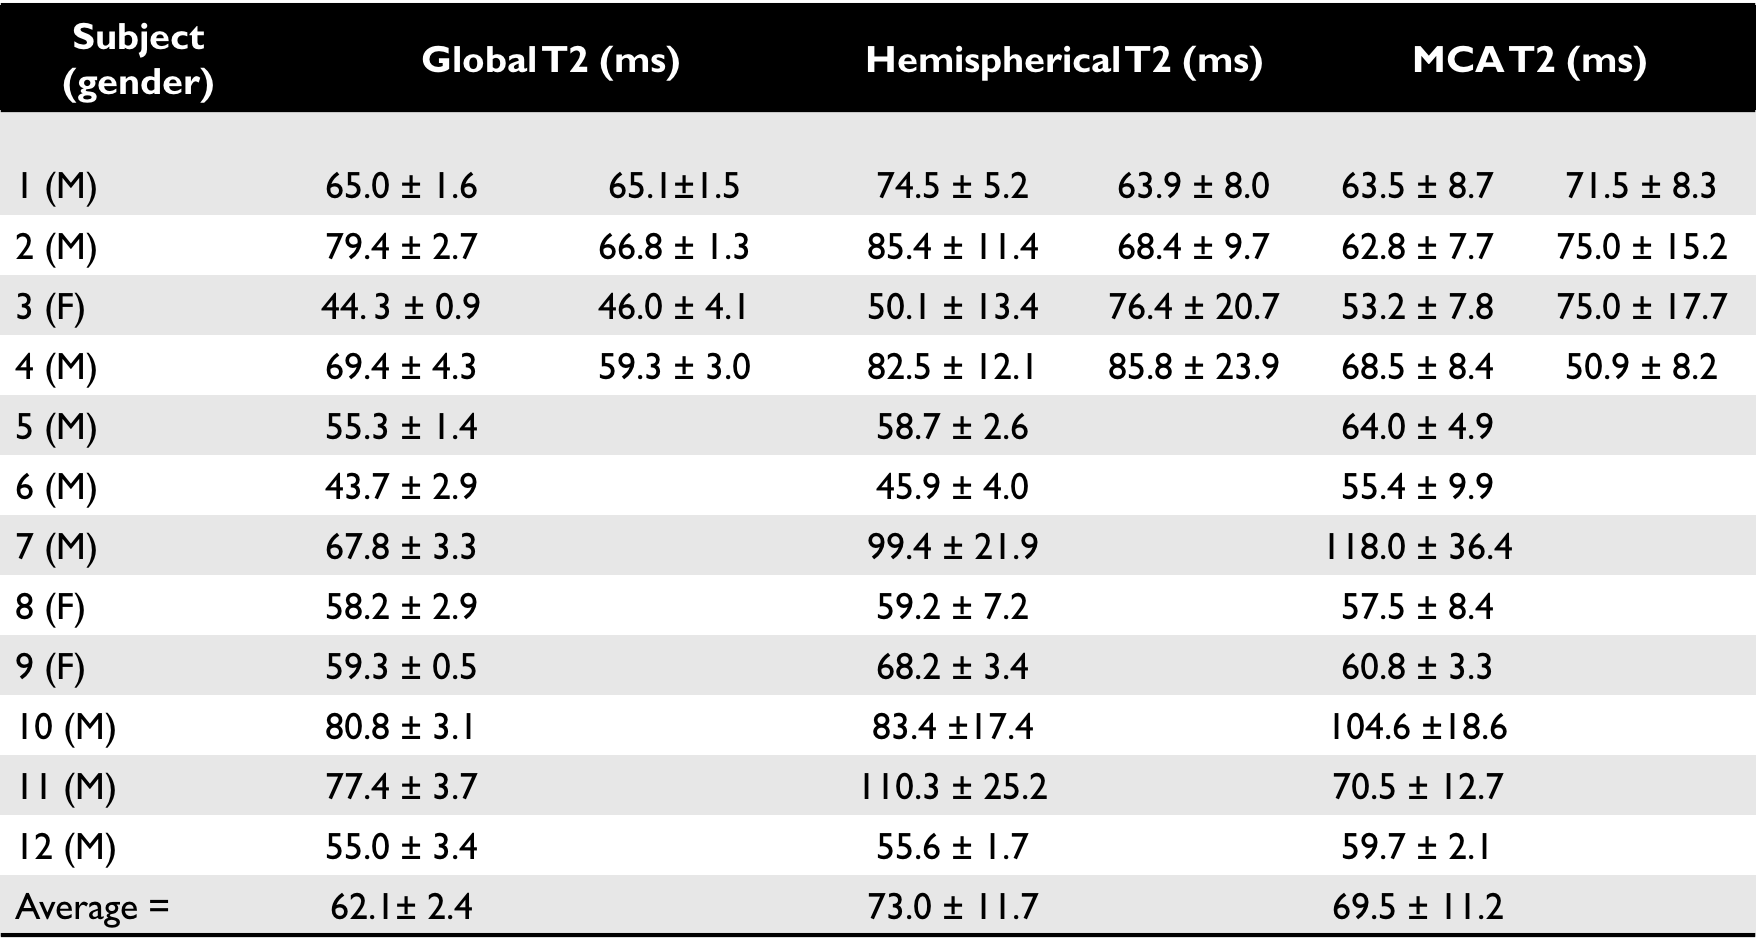
Table 1: T2 values for all healthy volunteers, including repeat scans to assess reproducibility in a subset of subjects. Accounting for hematocrit and using literature values of 0.4 and 0.43 for females and males respectively, the average OEF across all subjects is: global = 39.3 ± 0.07%, hemispherical = 34.5 ± 1.9%, and MCA = 36.6 ± 2.0%. Errors are calculated using the residuals of the fit and adding errors in quadrature. Discussion of repeat scans and visual representation of the values can be found in Figure 3.
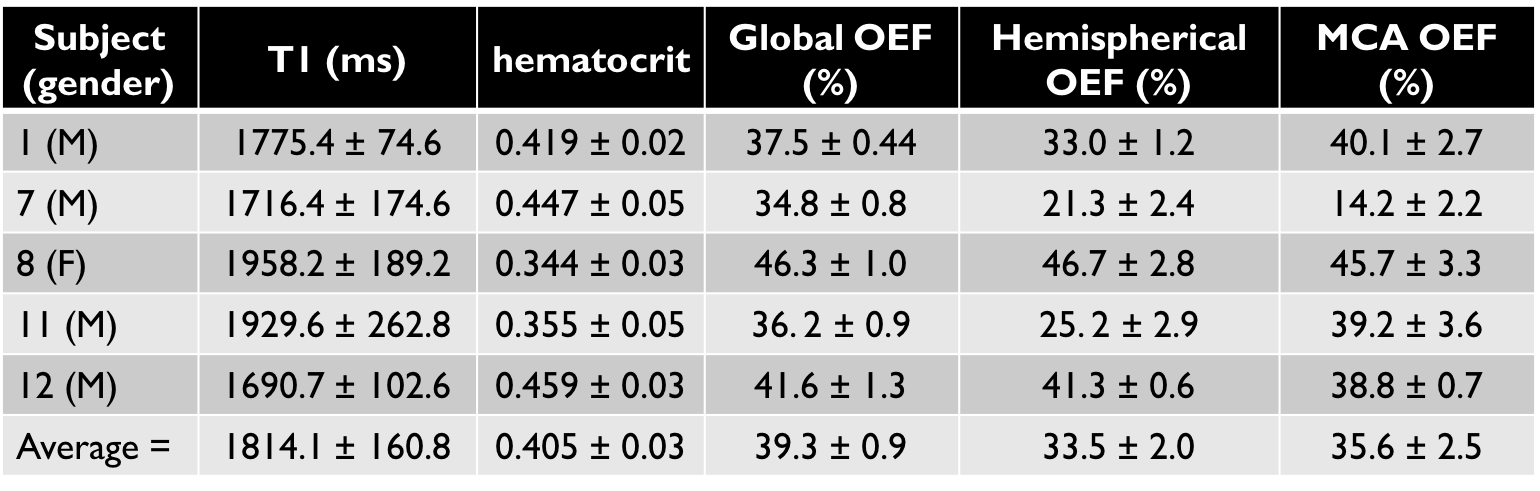
Table 2: Whole brain venous blood T1, the calculated estimate for hematocrit, and the corresponding values for OEF for a subset of 5 subjects (subject numbers correspond to the subject numbers in Table 1). In vivo venous blood T1 values have been shown to be longer than literature in vitro values, thus ours are in line with expected values [4]. Both the hemispherical and MCA average OEF values lie slightly outside the error range for the global TRUST value, however are in good agreement with each other.