2175
Pushing the Limits of ASL Imaging for the Lifespan Human Connectome Projects1Center for Magnetic Resonance Research, School of Medicine, University of Minnesota, Minneapolis, MN, United States, 2Laboratory of FMRI Technology (LOFT), Mark & Mary Stevens Neuroimaging and Informatics Institute, Keck School of Medicine, University of Southern California (USC), Los Angeles, CA, United States, 3Institute of Biomedical Engineering, University of Oxford, Headington, Oxford, United Kingdom
Synopsis
Arterial spin labeling (ASL) imaging is included in the Lifespan Human Connectome Projects (HCPs) in order to investigate the evolution of cerebral blood flow (CBF) in children and elderly populations. To push the limits of ASL imaging for the Lifespan HCPs, we optimized and evaluated high-resolution 2D slice accelerated protocols for multi-delay PCASL imaging. The results suggest that high quality arterial transit time (ATT) and CBF maps with a 2.5 mm resolution can be reliably achieved in about 5.5 minutes.
Purpose
Arterial spin labeling (ASL) 1 is a non-contrast enhanced perfusion imaging method, which can provide quantitative measurements of cerebral blood flow (CBF) as a surrogate marker of brain metabolism and function. CBF is an appealing complement to structural and functional connectivity obtained with diffusion and resting state BOLD fMRI. ASL imaging was proposed for the Lifespan Human Connectome Projects (HCPs) to investigate the evolution of CBF in children and elderly populations. To improve the ability to assess subtle perfusion changes, due to either pathophysiology or development, in thin or atrophic cortical regions, as well as in small subcortical structures, high-resolution ASL imaging is desired to reduce partial volume effects on CBF measurements. Furthermore, a high-resolution (e.g., 2.5 mm) protocol, consistent with the spatial scale of the traditional connectome imaging data, was preferred to facilitate surface analyses. We previously evaluated lower resolution (3.5 mm) protocols and found that, compared to 3D GRASE, 2D multi-band (MB) EPI 2 was more optimal for multi-delay PCASL imaging, especially when the image acquisition time is limited and high spatial resolution is desired 3. To push the limits of ASL imaging for the lifespan HCPs, we optimized and evaluated a high-resolution 2D MB-EPI protocol for multi-delay PCASL imaging, limited to an ~ 5.5 minute total acquisition time.Methods
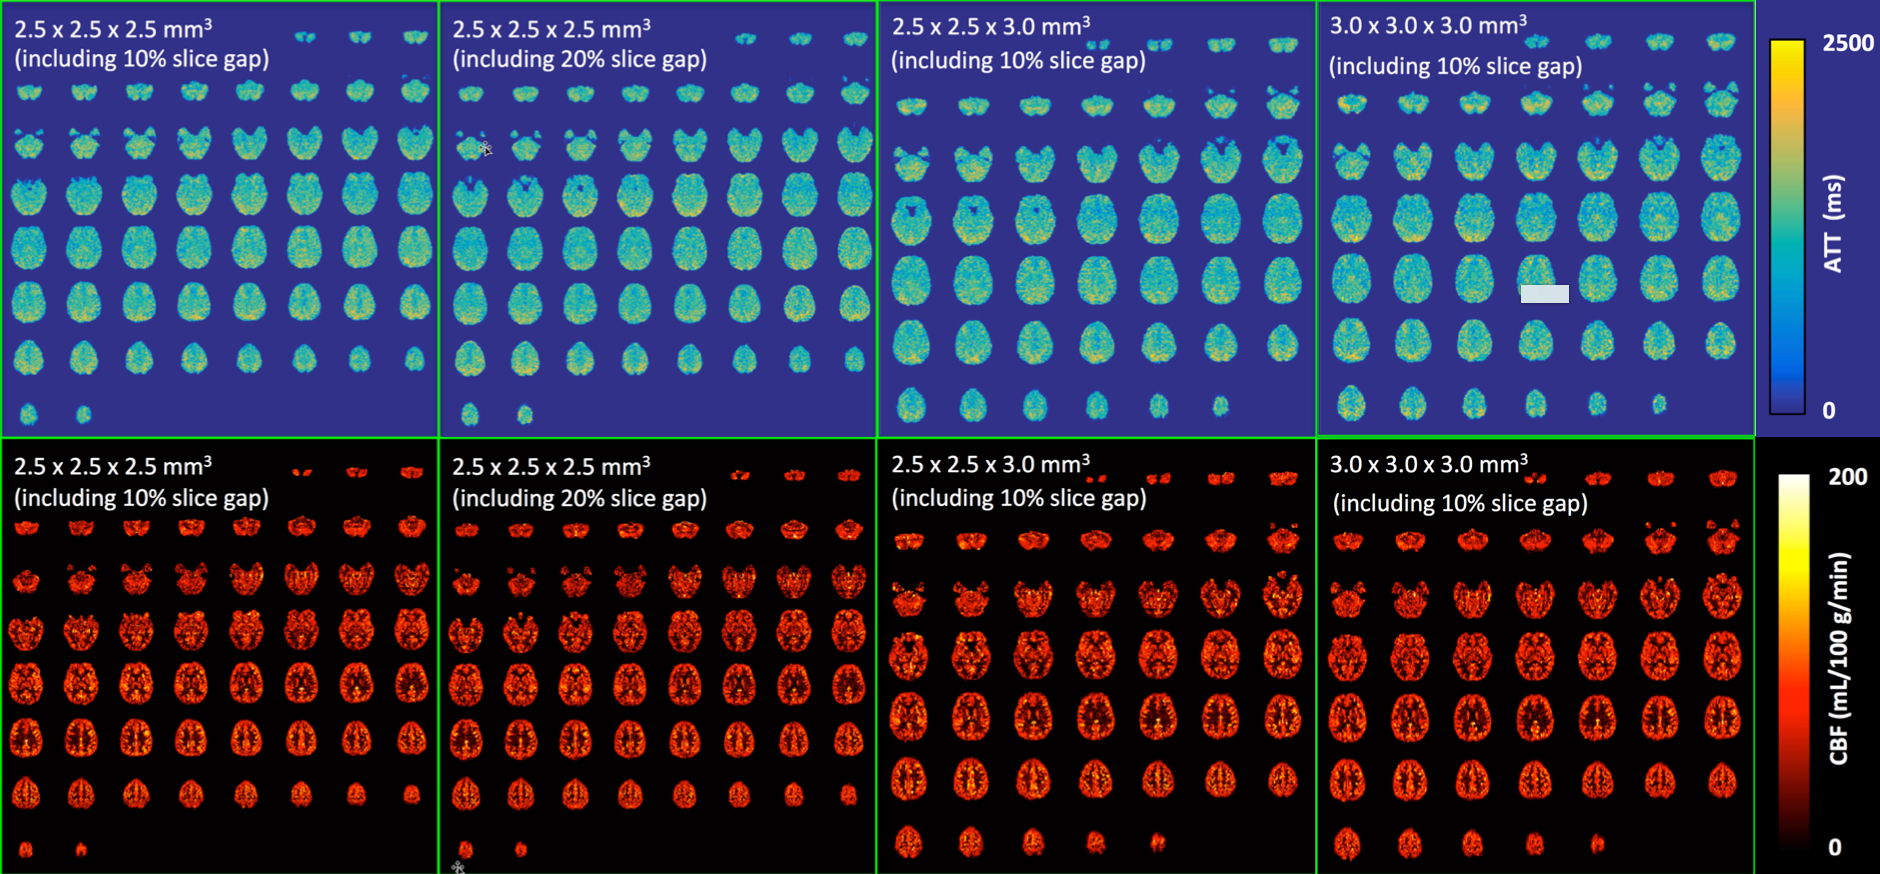
Healthy volunteers were scanned on a Siemens 3T Prisma MRI scanner using a 32-channel head coil under an IRB approved protocol with written informed consent. An initial exploratory evaluation of a high-resolution 2D MB-EPI multi-delay PCASL acquisition was performed using four different resolutions (Figure 1) with the following common parameters: partial Fourier = 6/8; slice acquisition order = sequential and ascending; multi-band acceleration factor = 6; labeling duration = 1.5 s; five post-bolus delays (PLDs) = {0.2, 0.7, 1.2, 1.7, 2.2} s, number of label and control images for five PLDs = {10, 10, 10, 20, 30}; number of fully relaxed M0 images acquired at the end = 2; and total acquisition time = ~ 5.5 mins. The minimized TR and TE values were always applied across the different PLDs and resolutions. A total of 60 and 48 image slices were used for the acquisitions using a 2.5 and 3.0 mm nominal slice thickness, respectively. To investigate the reliability of multi-delay PCASL imaging using a 2.5 x 2.5 x 2.5 (including 10% slice gap) mm3 resolution with an ~ 5.5 minute acquisition time, a separate study was performed to triple the number of label and control images for each PLD with an ~ 16.5 minute acquisition time. The ATT and CBF maps using data acquired with ~ 5.5 minutes were compared to those with ~ 16.5 minutes. To facilitate image distortion correction due to an inhomogeneous B0 field, spin echo EPI acquisitions with readouts matching those of the PCASL acquisitions were acquired along with ones using the reverse PE direction.
Post-processing was performed with the FSL toolbox and SPM. The ATT estimation and CBF quantification were achieved using the single-blood compartment model 4 and the Oxford's ASL tool of the FSL toolbox 5. Statistical analyses were performed using Microsoft Excel and the GraphPad.
Results and Discussion
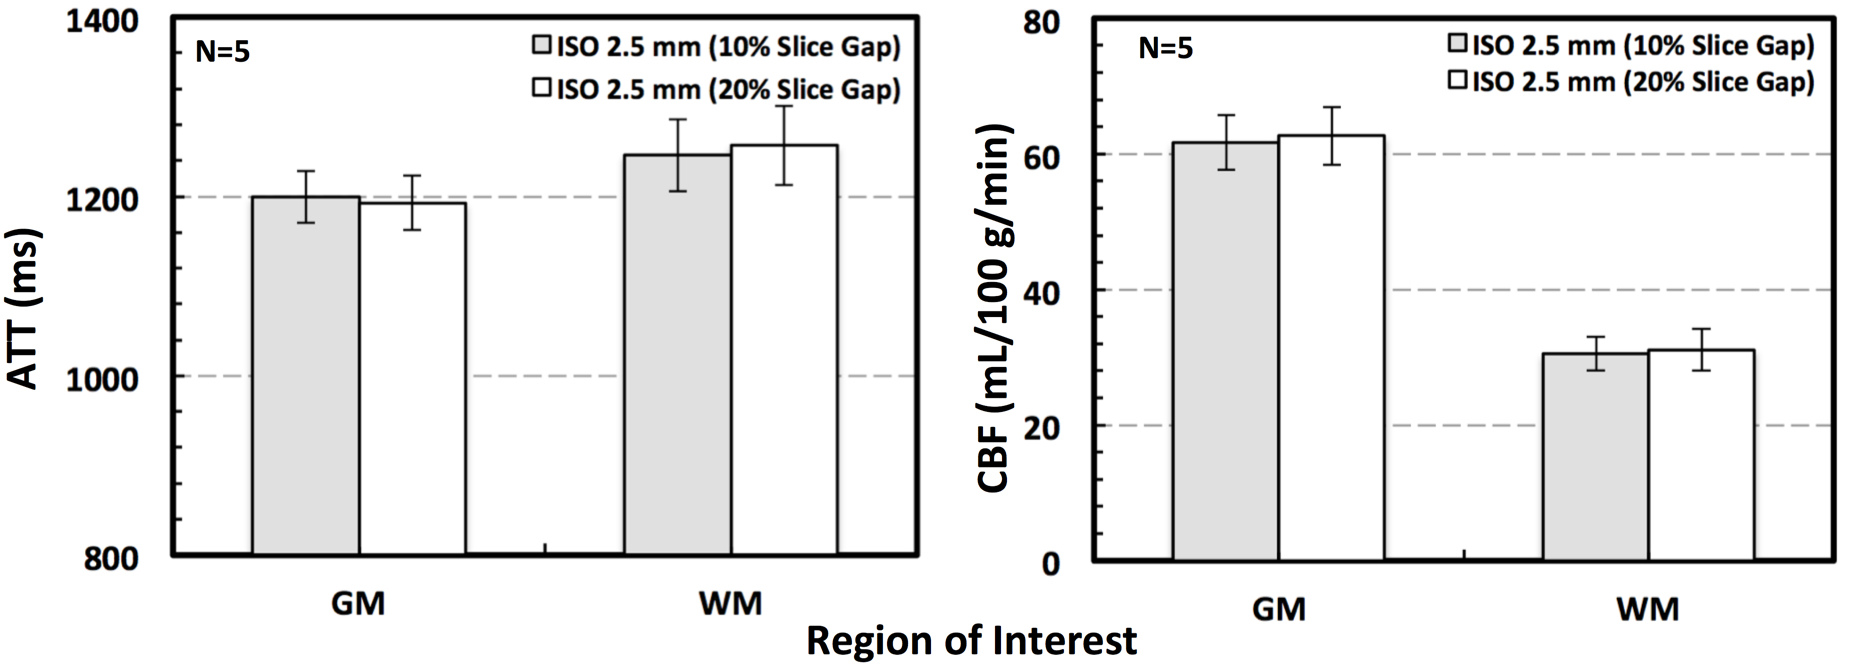
High quality PCASL imaging results were successfully obtained for all evaluated resolutions using an ~ 5.5 minute acquisition time. Figure 1 shows the ATT and CBF maps from one subject. In particular, the analyses of gray and white matter ATT and CBF found no significant differences between data acquired with the same 2.5 mm resolution but using different slice gaps (Figure 2).
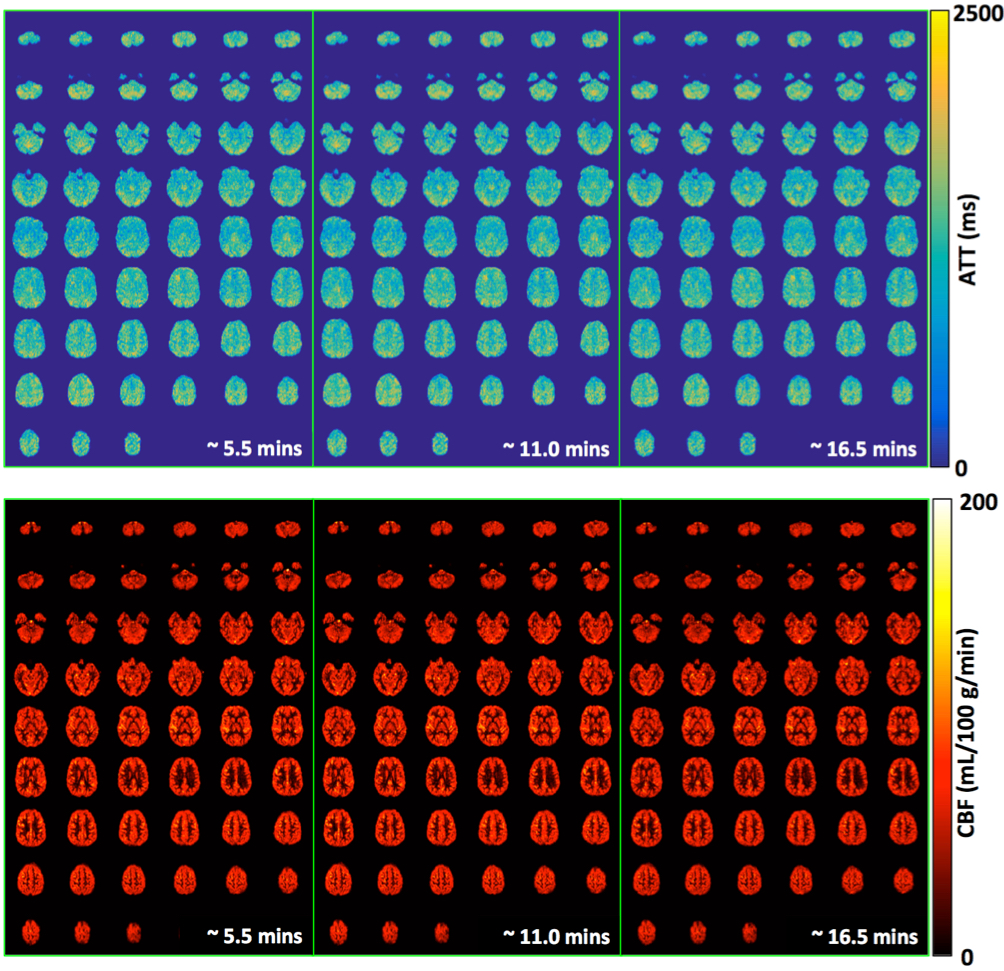
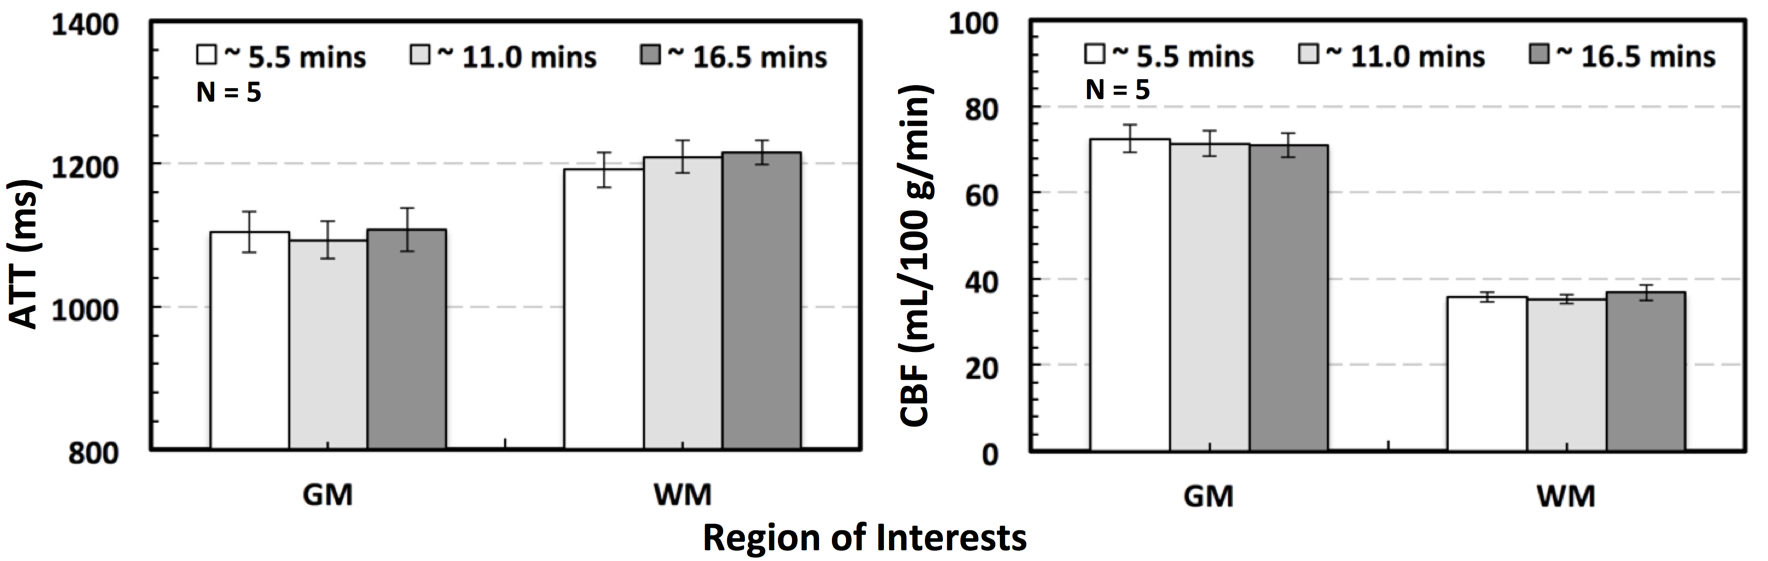
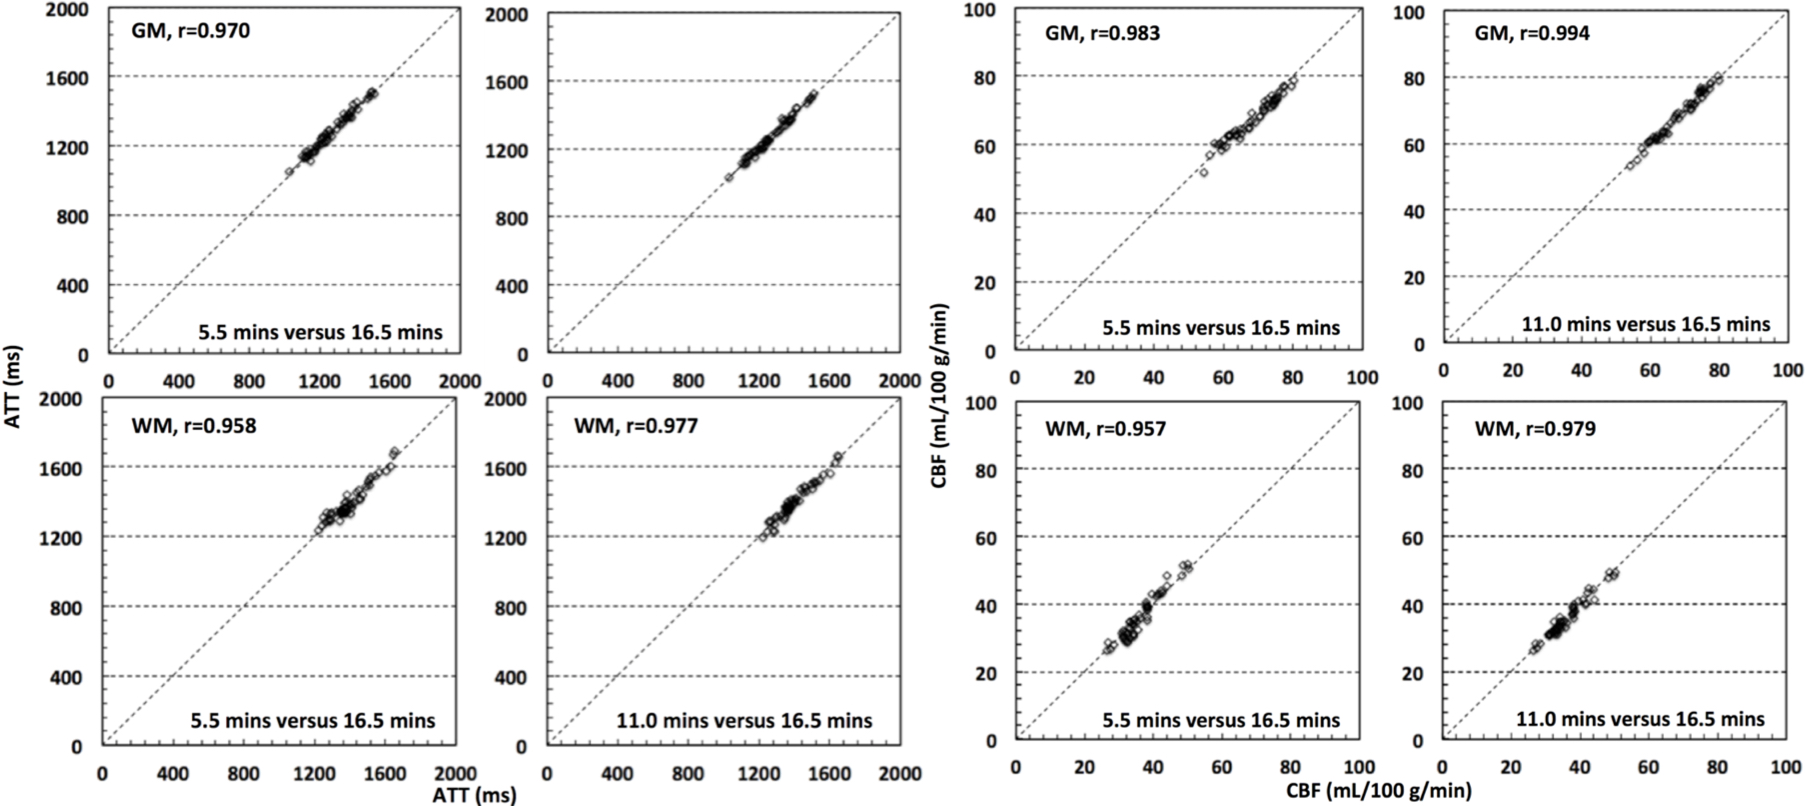
The ATT and CBF maps from one subject using data with ~ 5.5, 11.0 and 16.5 minute acquisition time are shown in Figure 3. Statistical analyses using two-tailed paired t tests did not find significant differences between the measurements using data with ~ 5.5 and ~ 16.5 minute acquisition time in terms of whole brain grey and white matter ATT and CBF (Figure 4). Further analyses showed that the slice-wise ATT and CBF measurements using data with the ~ 5.5 minute acquisition time were significantly correlated to those with the ~ 16.5 minute acquisition time in both gray and white matters. The slice-wise measurements of ATT and CBF from one typical subject are presented in Figure 5.
Conclusions
High quality whole-brain ATT and CBF maps with a 2.5 mm resolution can be reliably achieved within 5.5 minutes using a 2D MB-EPI multi-delay PCASL acquisition that is currently included in the lifespan HCP protocol.Acknowledgements
P41 EB015894, P30 NS076408, Human Connectome Project (1U54 MH091657), and UL1TR000114. This research work is also supported by the University of Minnesota Foundation. The content is solely the responsibility of the authors and does not necessarily represent the official views of the National Institutes of Health.References
1. Detre JA, Leigh JS, Williams DS, Koretsky AP. Perfusion imaging. Magn Reson Med. 1992;23(1):37-45.
2. Li X, Wang D, Auerbach EJ, Moeller S, Ugurbil K, Metzger GJ. Theoretical and experimental evaluation of multi-band EPI for high-resolution whole brain pCASL Imaging. Neuroimage. 2015;106:170-181.
3. Li X., Shao X., Wang D., Ramanna S., Moeller S., Ugurbil K., Yacoub E. Wang DJ. Evaluation of 3D GRASE and 2D MB-EPI for Multi-Delay PCASL Imaging. In: Proceedings of Annual Meeting Annual Meeting & Exhibition 2017: 3627.
4. Alsop DC, Detre JA, Golay X, et al. Recommended implementation of arterial spin-labeled perfusion MRI for clinical applications: A consensus of the ISMRM perfusion study group and the European consortium for ASL in dementia. Magn Reson Med. 2015;73(1):102-116.
5. Chappell MA, MacIntosh BJ, Donahue MJ, Gunther M, Jezzard P, Woolrich MW. Separation of macrovascular signal in multi-inversion time arterial spin labelling MRI. Magn Reson Med. 2010;63(5):1357-1365.
Figures