2174
Investigating Cerebrovascular Reactivity Using Pseudo-continuous ASL and Turbo QUASAR ASL at Varying Blood Flow Conditions1Institute of Biomedical Engineering, University of Oxford, Oxford, United Kingdom, 2Department of Radiology and Nuclear Medicine, Academic Medical Center, Amsterdam, Netherlands, 3Danish Research Centre for Magnetic Resonance, Copenhagen, Denmark, 4Department of Radiology, University Medical Center Utrecht, Utrecht, Netherlands, 5Rochester Institute of Technology, Rochester, NY, United States, 6Department of Haematology, Academic Medical Center, Amsterdam, Netherlands, 7Department of Biomedical Engineering and Physics, Academic Medical Center, Amsterdam, Netherlands
Synopsis
CVR has become an important biomarker to assess cerebrovascular health, and ASL is a non-invasive technique to quantify CVR. This work compared the CVR measurement from PCASL and Turbo QUASAR ASL at varying blood flow conditions induced by acetazolamide. Results showed that both ASL techniques were sensitive to CVR and that significant changes of ATT were detected by Turbo QUASAR ASL. The differences in CVR (higher in PCASL) may be due to the different sensitivity to ATT of the two ASL methods.
Introduction
Cerebrovascular reactivity (CVR) has become an important biomarker to assess cerebrovascular health, and its precise quantification relies on CBF estimation [1]. Arterial spin labeling (ASL) MRI is a non-invasive technique to quantify CBF, and single-PLD PCASL has been recommended as the standard implementation for CBF quantification [2]. Despite the wide application of single-PLD PCASL, the technique is potentially limited by sensitivity to arterial transit time (ATT) and signal artefacts from arterial blood, which restricts its application in neuroimaging studies of changing blood flow conditions such as those induced by acetazolamide. Turbo QUASAR ASL is an alternative, multi-PLD PASL sequence, with a similar SNR to PCASL and full brain coverage, which can control for ATT and the appearance of an arterial component [3].
Here, we investigate CVR measurements from PCASL and Turbo QUASAR ASL in the same individuals under normal and fast flow (induced by acetazolamide) conditions by comparing the estimated CBF and ATT. Results show that both ASL techniques detected CBF based CVR but demonstrated regional differences.
Methods
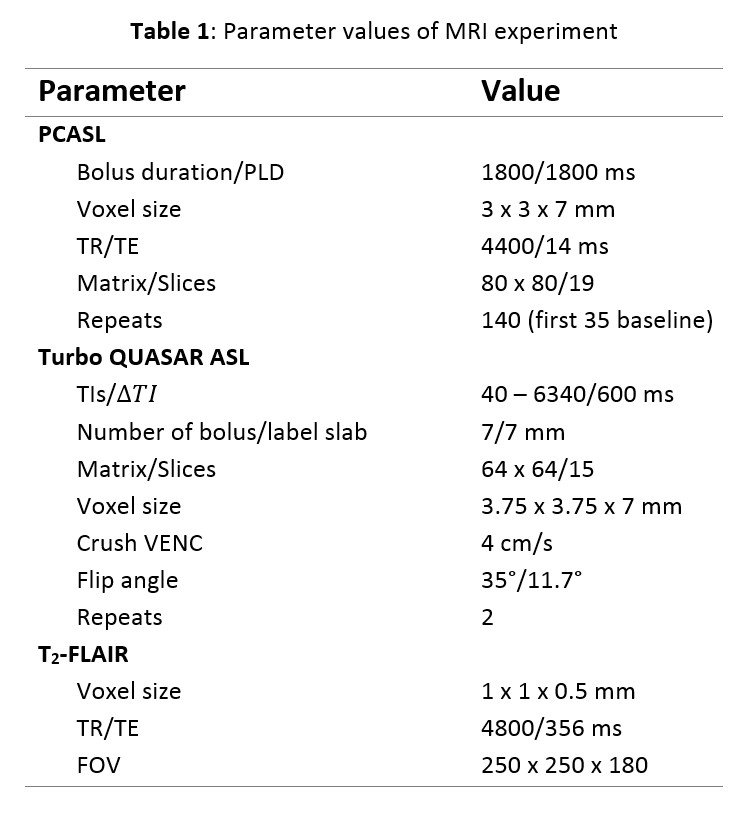
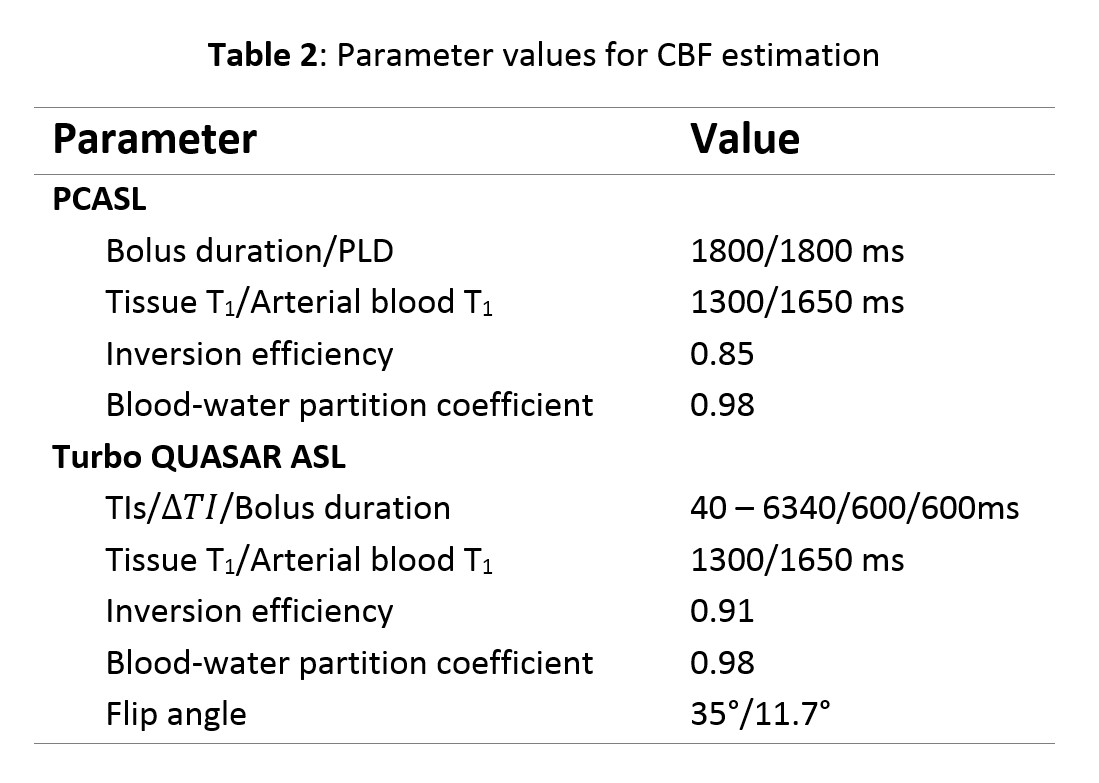
PCASL, M0, Turbo QUASAR ASL, and T2-FLAIR data were collected from eleven healthy control subjects using the parameters listed in Table 1. The T2-FLAIR image was acquired first and followed by a baseline Turbo QUASAR ASL and PCASL scan. Acetazolamide was injected at repeat 35 of PCASL. After the PCASL scan, another Turbo QUASAR ASL was performed. CBF quantification from PCASL data was performed using the spatially regularized variational Bayes method implemented in BASIL [4][5], and voxel-wise calibration including a correction for the short TR [2]. For CBF quantification from Turbo QUASAR ASL, a kinetic model was derived based on the existing kinetic model for QUASAR ASL [6]. Specifically, the arterial input function (AIF) of the single bolus ASL experiment was replaced by the summation of all AIF of the multiple boluses in Turbo QUASAR ASL while the other operations of the kinetic model remained the same. Both CBF and ATT were estimated from Turbo QUASAR ASL using the kinetic model within a modified version of BASIL and the averaged tissue (crushed) signal of the ASL difference image; a calibration image was obtained by fitting a saturation recovery model to the control data of Turbo QUASAR ASL using the similar technique employed in QUASAR ASL [7] with the parameters in Table 2. CVR of the two ASL techniques was computed by dividing the CBF differences between the two conditions by the baseline CBF.
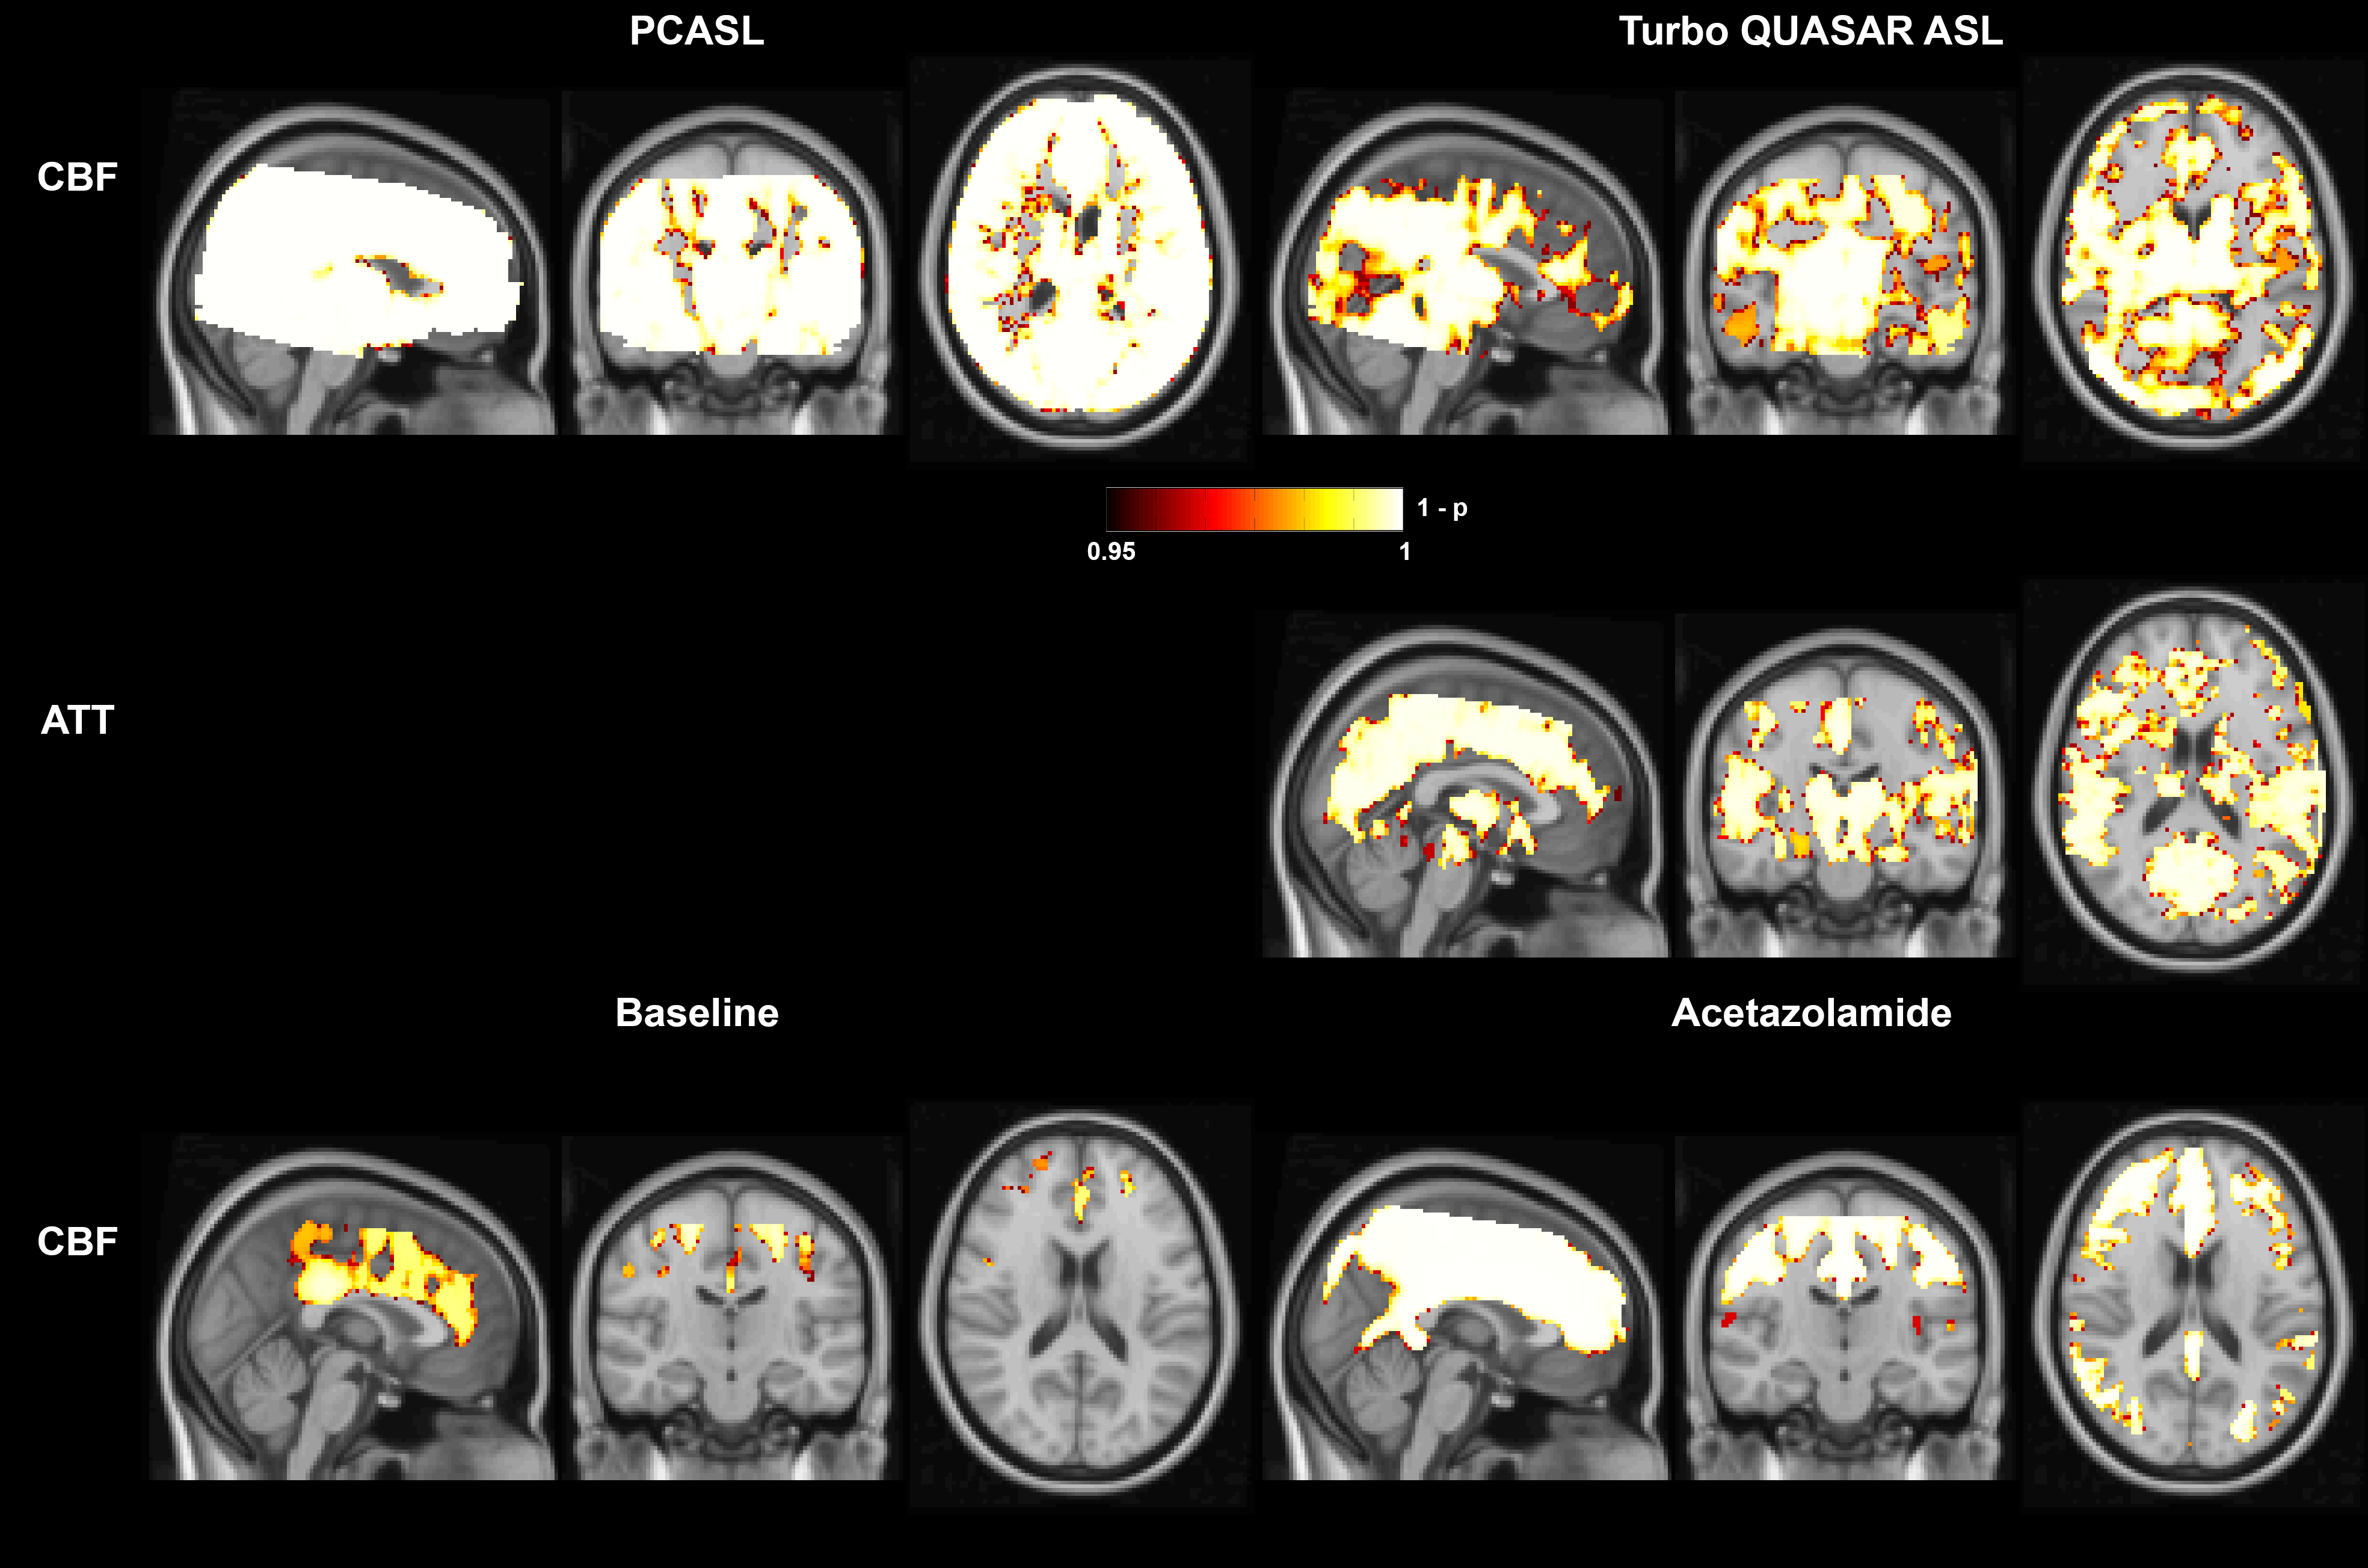
A Two-tailed Wilcoxon rank sum test was conducted to compare the estimated CBF and ATT between baseline and acetazolamide and between PCASL and Turbo QUASAR ASL. To investigate regional CBF and ATT differences, a non-parametric paired t-test was conducted (5000 permutations) on the CBF transformed to the standard space (MNI152 2mm). The first t-test compared the voxel-wise CBF and ATT differences after the administration of acetazolamide. The second t-test compared voxel-wise CBF between the two ASL techniques at baseline or acetazolamide condition.
Results
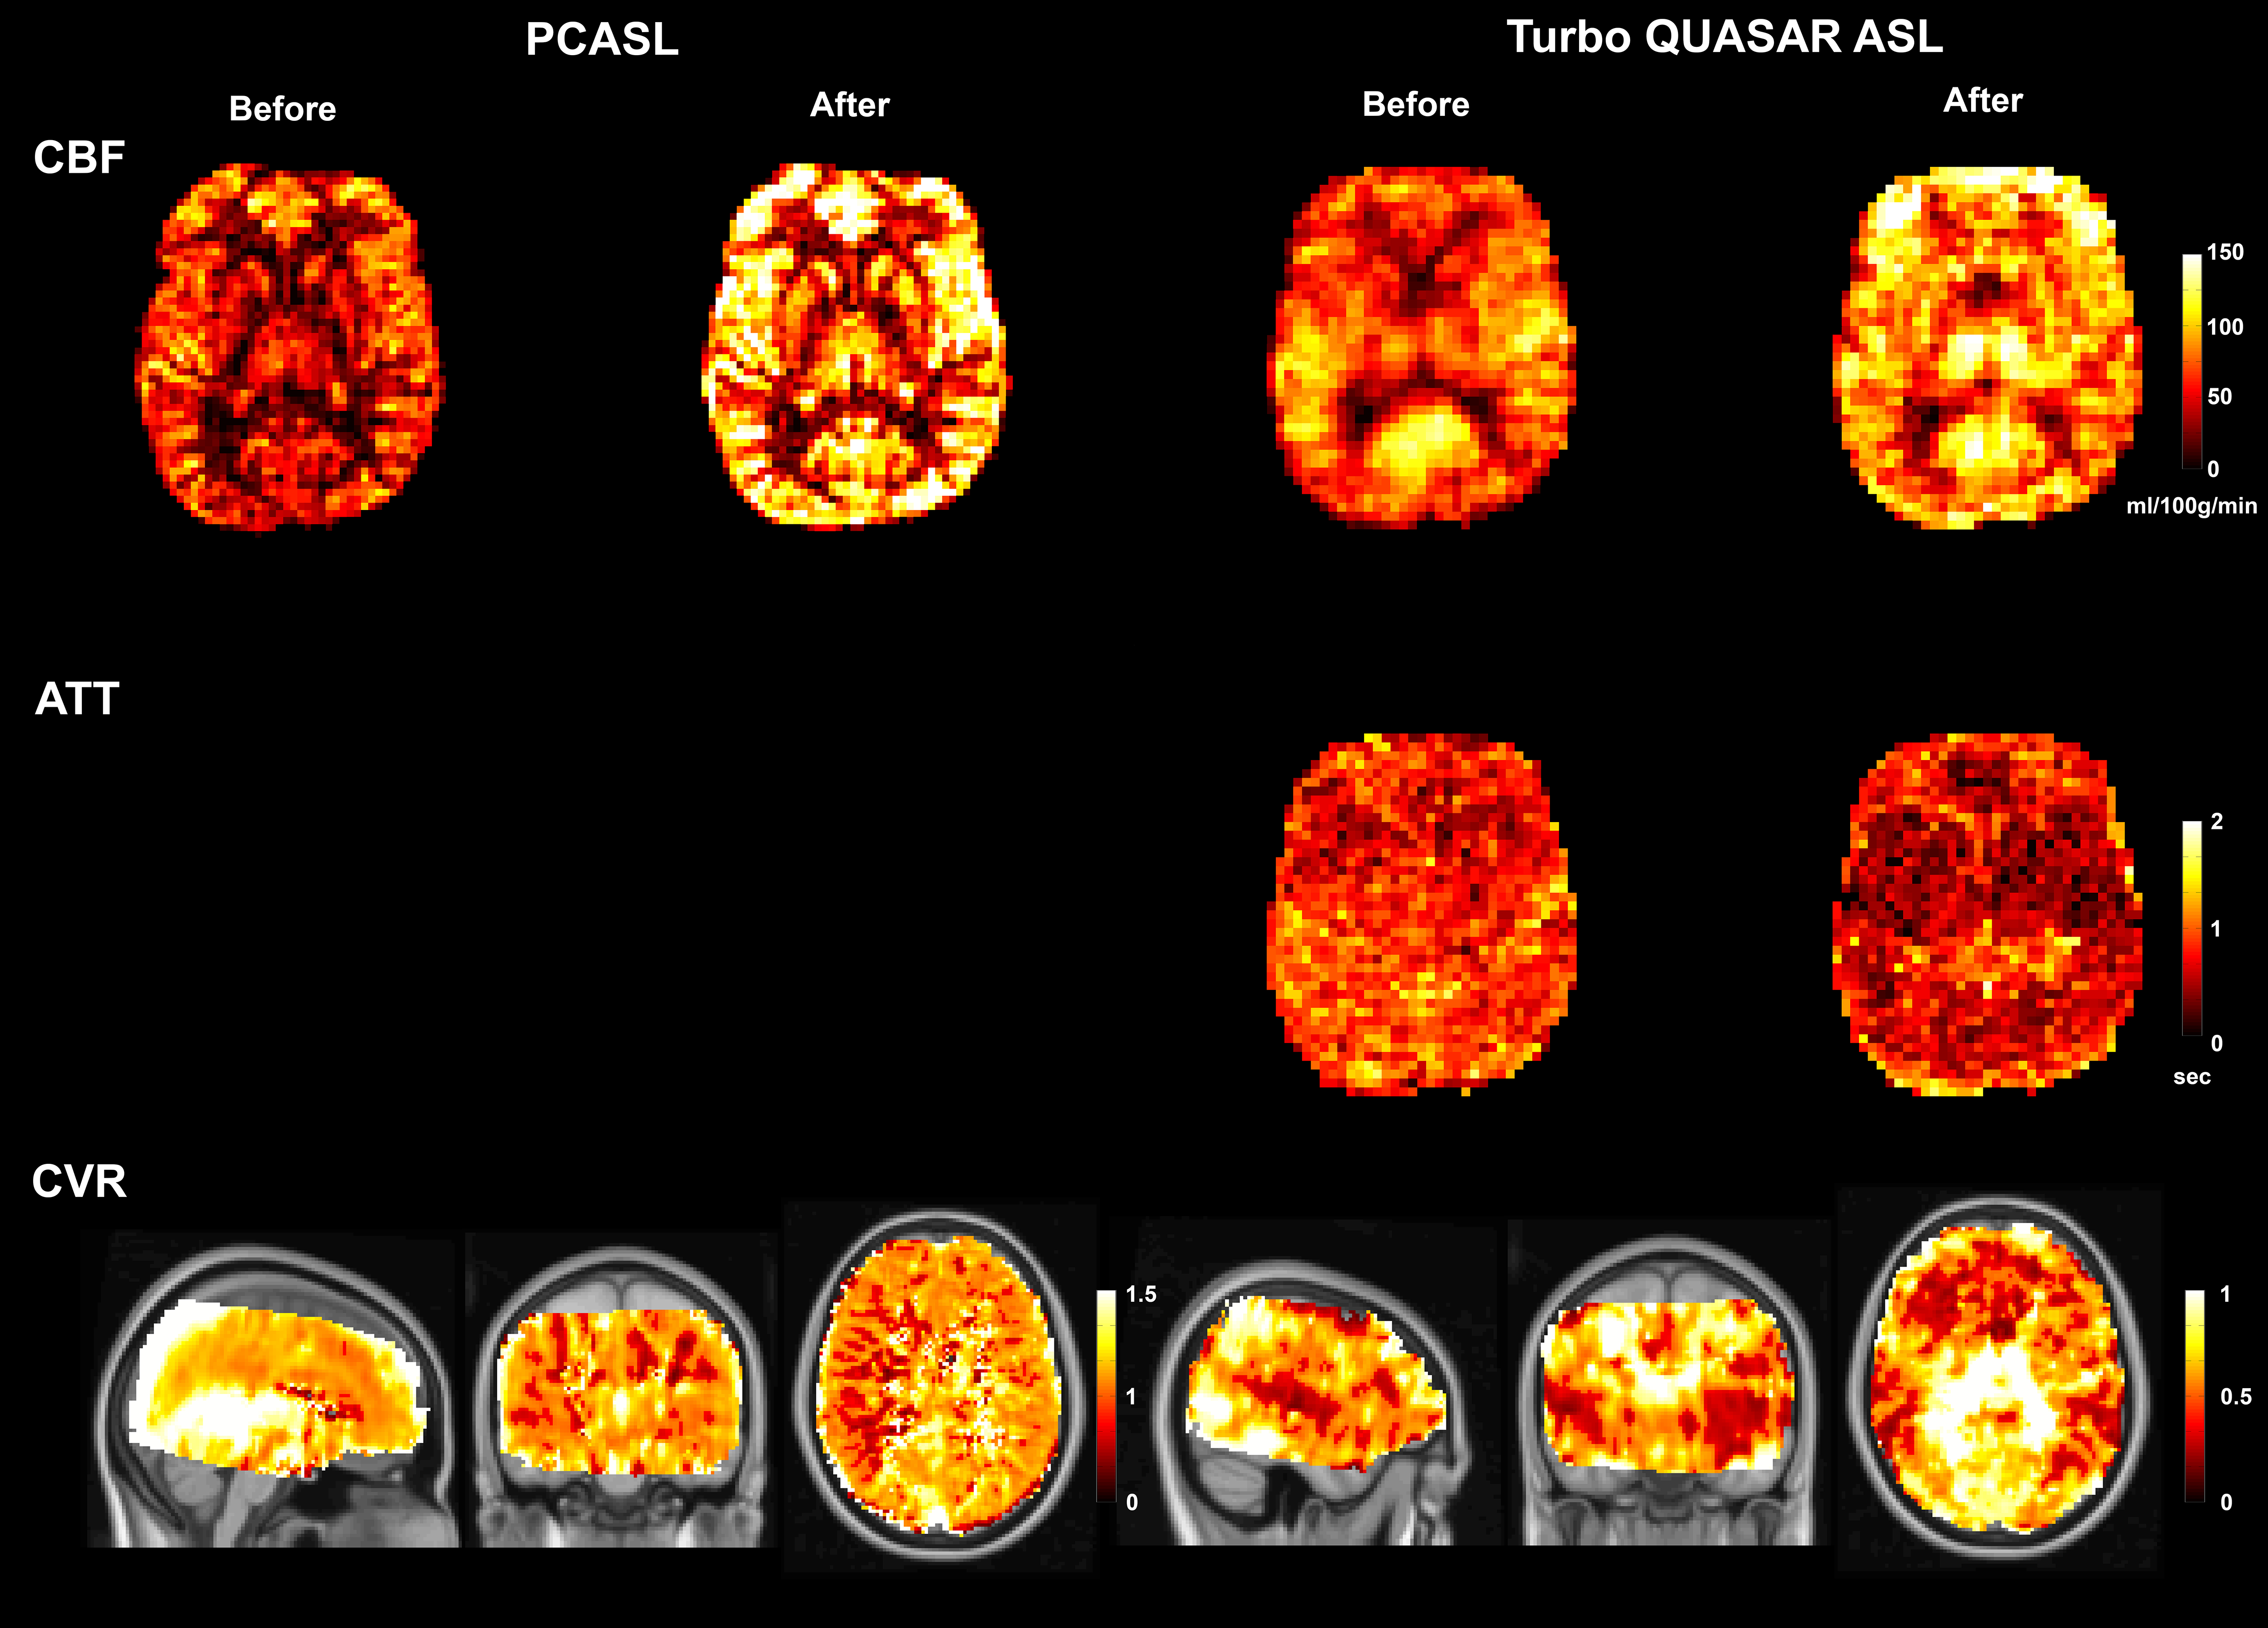
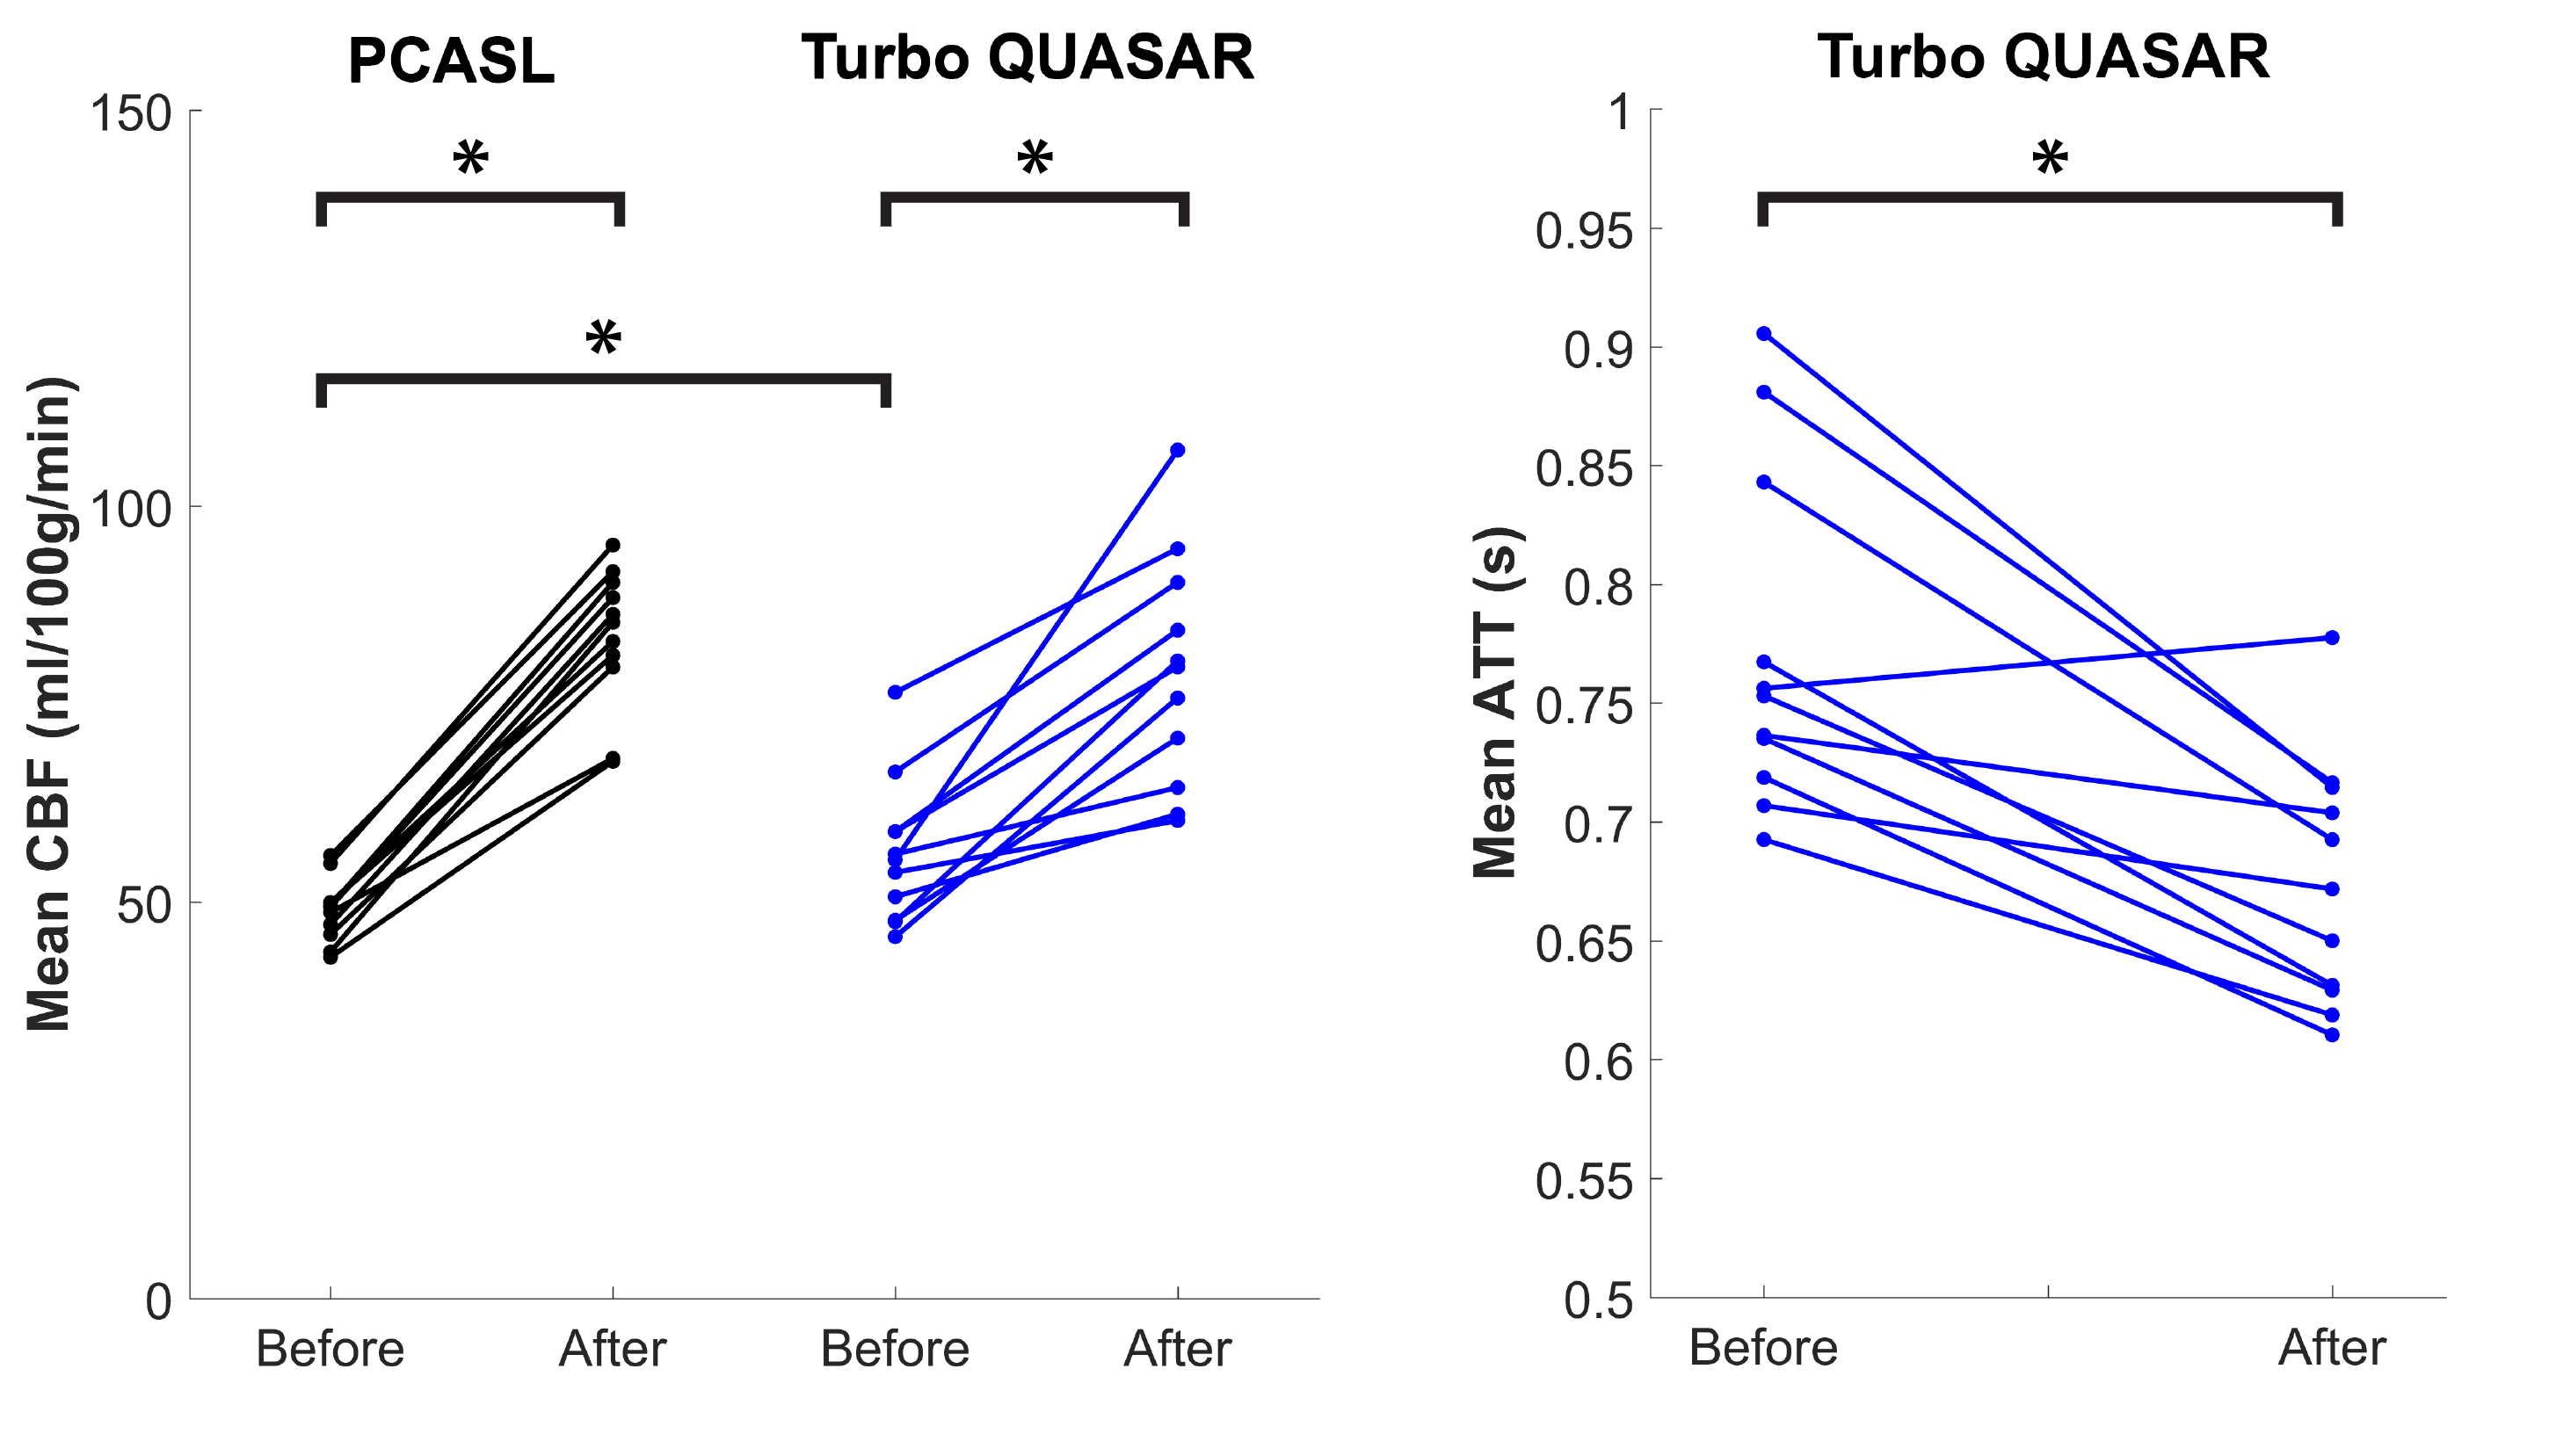
Figure 1 shows the estimated CBF, ATT, and mean CVR of PCASL and Turbo QUASAR at baseline and after acetazolamide administration. Figure 2 shows the mean CBF and ATT of each condition and non-parametric test results. Figure 3 shows the voxel-wise CBF and ATT comparison of the paired t-test.Discussion
The findings of this work are threefold: (1) both PCASL and Turbo QUASAR ASL were sufficiently sensitive to detect changes in CBF induced by acetazolamide; (2) mean CVR from PCASL was higher than Turbo QUASAR ASL in nearly all regions; (3) CBF differences between the two ASL techniques appeared to occur at the top of the brain. The t-test showed that significant spatial differences in CBF existed toward the top of the brain with prolonged ATT (Figure 3). This implies that in this population single-PLD PCASL may not be fully controling for the effects of delayed ATT. An additional source of variation not explored in this study is the effects of varying flow speed in the labeled arteries on estimated CBF. PCASL labeling efficiency is known to be sensitive to flow velocity and this could contribute to variations seen here post acetazolamide, which may translate into the differences in mean CVR. In principle, Turbo QUASAR ASL achieves a near continuous label duration via multiple pulsed ASL label applications. However, under sufficiently high flow conditions this may no longer be true, potentially also making this technique sensitive to high flow conditions.Acknowledgements
This work was supported by the following grants and institutions: EPSRC (EP/P012361/1), Dutch foundation “Fonds Nuts Ohra” grant no. 1303-055, Guarantors of Brain (UK), and EU COST Action BM1103. The authors would like to thank Martin Craig for technical support for this study.References
[1] S. Halani, J. B. Kwinta, A. M. Golestani, Y. B. Khatamian, and J. J. Chen, “Comparing cerebrovascular reactivity measured using BOLD and cerebral blood flow MRI: The effect of basal vascular tension on vasodilatory and vasoconstrictive reactivity,” Neuroimage, vol. 110, pp. 110–123, 2015.
[2] D. C. Alsop et al., “Recommended implementation of arterial spin-labeled perfusion MRI for clinical applications: A consensus of the ISMRM perfusion study group and the European consortium for ASL in dementia,” Magnetic Resonance in Medicine, 2014.
[3] E. T. Petersen, J. B. De Vis, C. a. T. van den Berg, and J. Hendrikse, “Turbo-QUASAR: a signal-to-noise optimal arterial spin labeling and sampling strategy,” Proc. Intl. Soc. Mag. Reson. Med. 21 2146., vol. 60, no. 6, p. 2146, 2013.
[4] A. R. Groves, M. A. Chappell, and M. W. Woolrich, “Combined spatial and non-spatial prior for inference on MRI time-series,” Neuroimage, vol. 45, no. 3, pp. 795–809, 2009.
[5] M. A. Chappell, A. R. Groves, B. Whitcher, and M. W. Woolrich, “Variational Bayesian Inference for a Nonlinear Forward Model,” IEEE Trans. Signal Process., vol. 57, no. 1, pp. 223–236, 2009.
[6] R. B. Buxton, L. R. Frank, E. C. Wong, B. Siewert, S. Warach, and R. R. Edelman, “A general kinetic model for quantitative perfusion imaging with arterial spin labeling.,” Magn. Reson. Med., vol. 40, pp. 383–396, 1998.
[7] M. A. Chappell, M. W. Woolrich, E. T. Petersen, X. Golay, and S. J. Payne, “Comparing model-based and model-free analysis methods for QUASAR arterial spin labeling perfusion quantification,” Magn. Reson. Med., vol. 69, pp. 1466–1475, 2013.
Figures