2172
Evaluation of the Suitability of Hadamard Encoding Schemes for Pseudo-Continuous Arterial Spin Labelling1Department of Neuroimaging, King's College London, London, United Kingdom, 2GE Healthcare, Calgary, Canada
Synopsis
Multi delay Arterial Spin Labelling offers the advantage of measuring neurophysiological properties such as arterial transit delay which can be used to hep improve cerebral blood flow estimation. Hadamard encoding pCASL is a method with improved temporal resolution and SNR compared to sequential multi delay methods. This work presents the findings of an evaluation of three different Hadamard encoded schemes for perfusion and transit delay estimation. All schemes were comparable with regards to perfusion estimation however showed some interesting regional differences in TD estimation.
Introduction
This work aims to compare the results of three different Hadamard labelling schemes for the quantification of cerebral blood flow (CBF) and transit delay (TD) with 3D pseudo-continuous Arterial Spin Labelling (3D pCASL) 1. The three Hadamard schemes were: exponential/T1 adjusted 2 weighting (HAD EXP), linear weighted schemes (HAD LIN) and a novel pseudo-exponential/linear scheme (HAD P-EXP). We also optimised these sequences for appropriate PLD coverage, acquisition time and resolution, adaptable to clinical and research applications.Methods
This study was approved by KCL Ethics. We employed a GE 3T MR750 scanner in 7 healthy male volunteers. T2-weighted fast spin echo images were acquired for tissue segmentation and co-registration of perfusion images. All pCASL images (employing a 3D-FSE stack-of-spirals readout) were acquired twice, for assessment of repeatability.
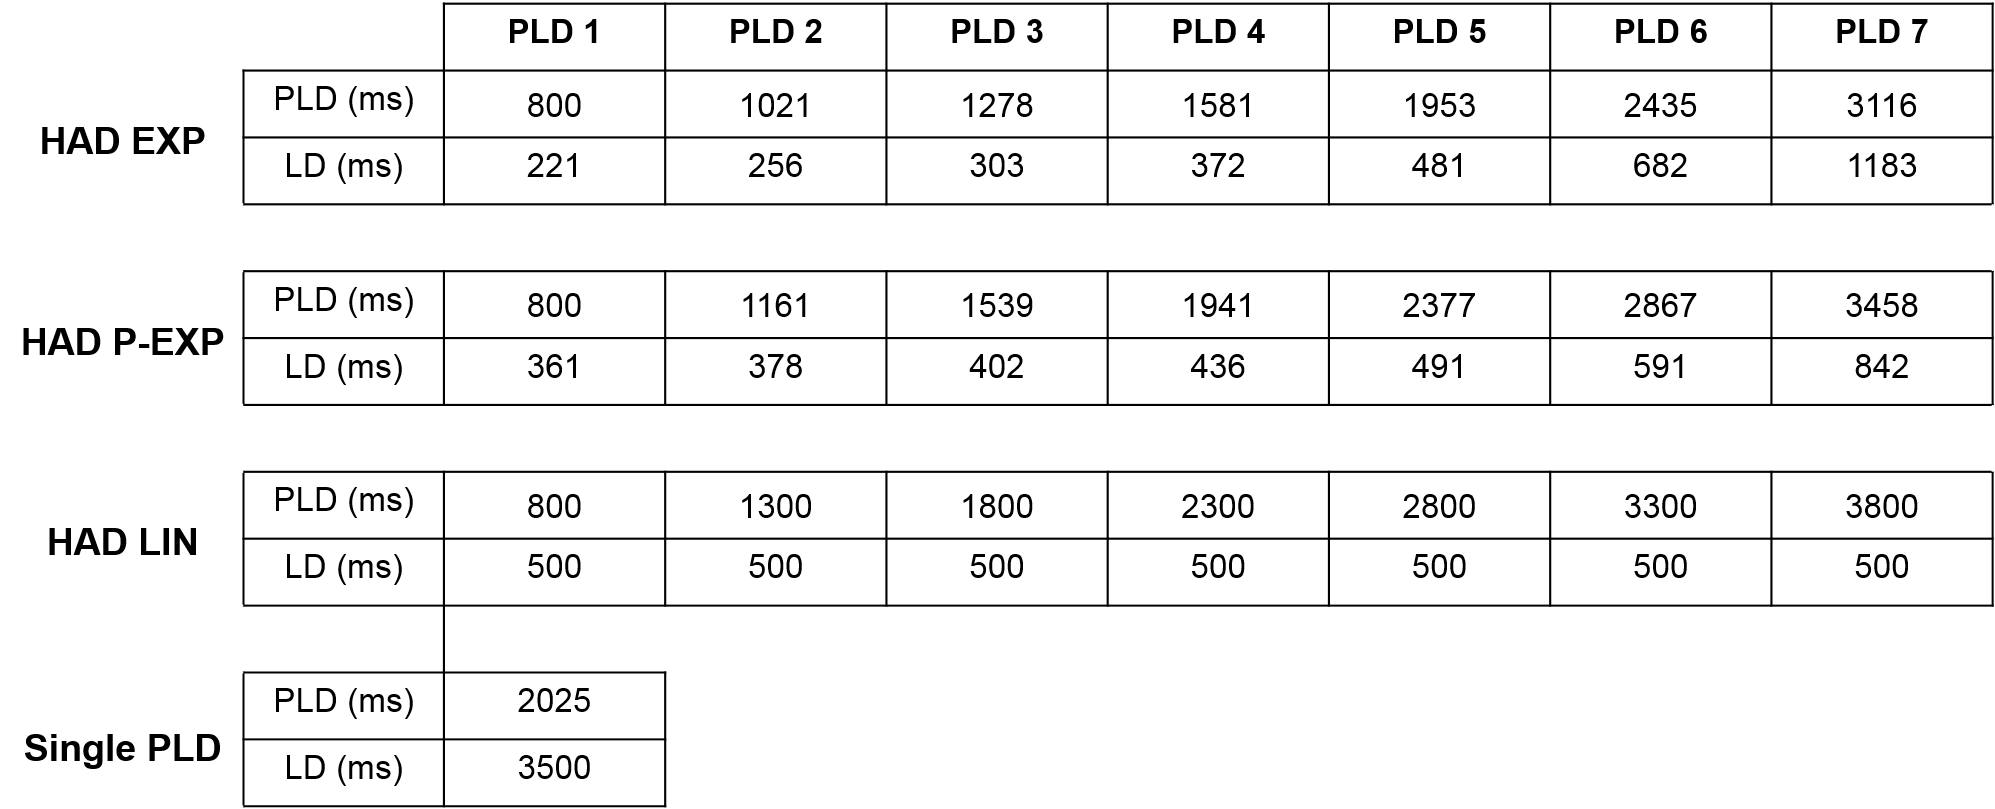
For reference, a single-PLD pCASL sequence with 10 spiral-arms, 600 points, in plane resolution 2.96x2.96mm2, Dz=3mm, 54 slices TE/TR=11.8/7325ms, NEX=2, TA=5:22mins was acquired. The three 7-delay Hadamard sequences used identical readout parameters: 6 spiral-arms, 560 points, in plane resolution 4.06x4.06mm2, Dz=4mm, 40 slices, TE/TR=10.9/5844ms, NEX=1, TA=5:35min and total labelling duration of 3500ms. LD and PLD times are shown in Table-1. All pCASL data were acquired with background suppression. A proton density (PD) image with identical readout, was obtained for CBF quantification.
Single-PLD CBF images were calculated using the single-compartment Buxton model. Methods similar to Dai et al.,1 were used to quantify CBF for the 7-delay Hadamard series using voxel-wise correction for TD. TD maps were quantified online using the scanner software.
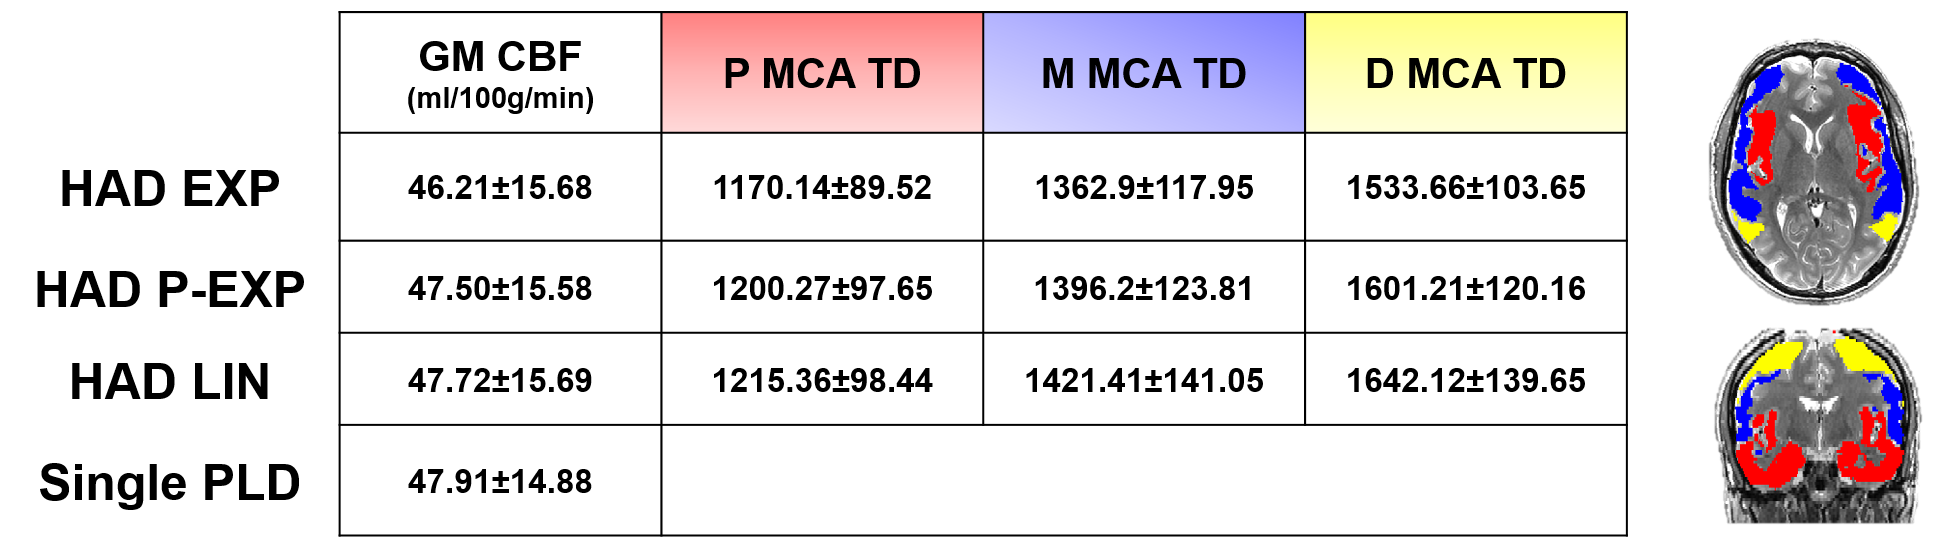
PD images were co-registered to the T2-weighted images, and transformations applied to the CBF and TD maps as well as the perfusion-difference images. T2 images were skull stripped and segmented using FSL, to produce subject specific grey matter (GM) masks. Mean GM CBF estimates were extracted (3dmaskave-AFNI) for each subject. Repeated scans were included and mean values were averaged over all subjects. TD times were extracted from three cortical GM ROIs that covered tissue supplied by the proximal, middle and distal middle cerebral arteries3. Differences were tested using paired t-tests.
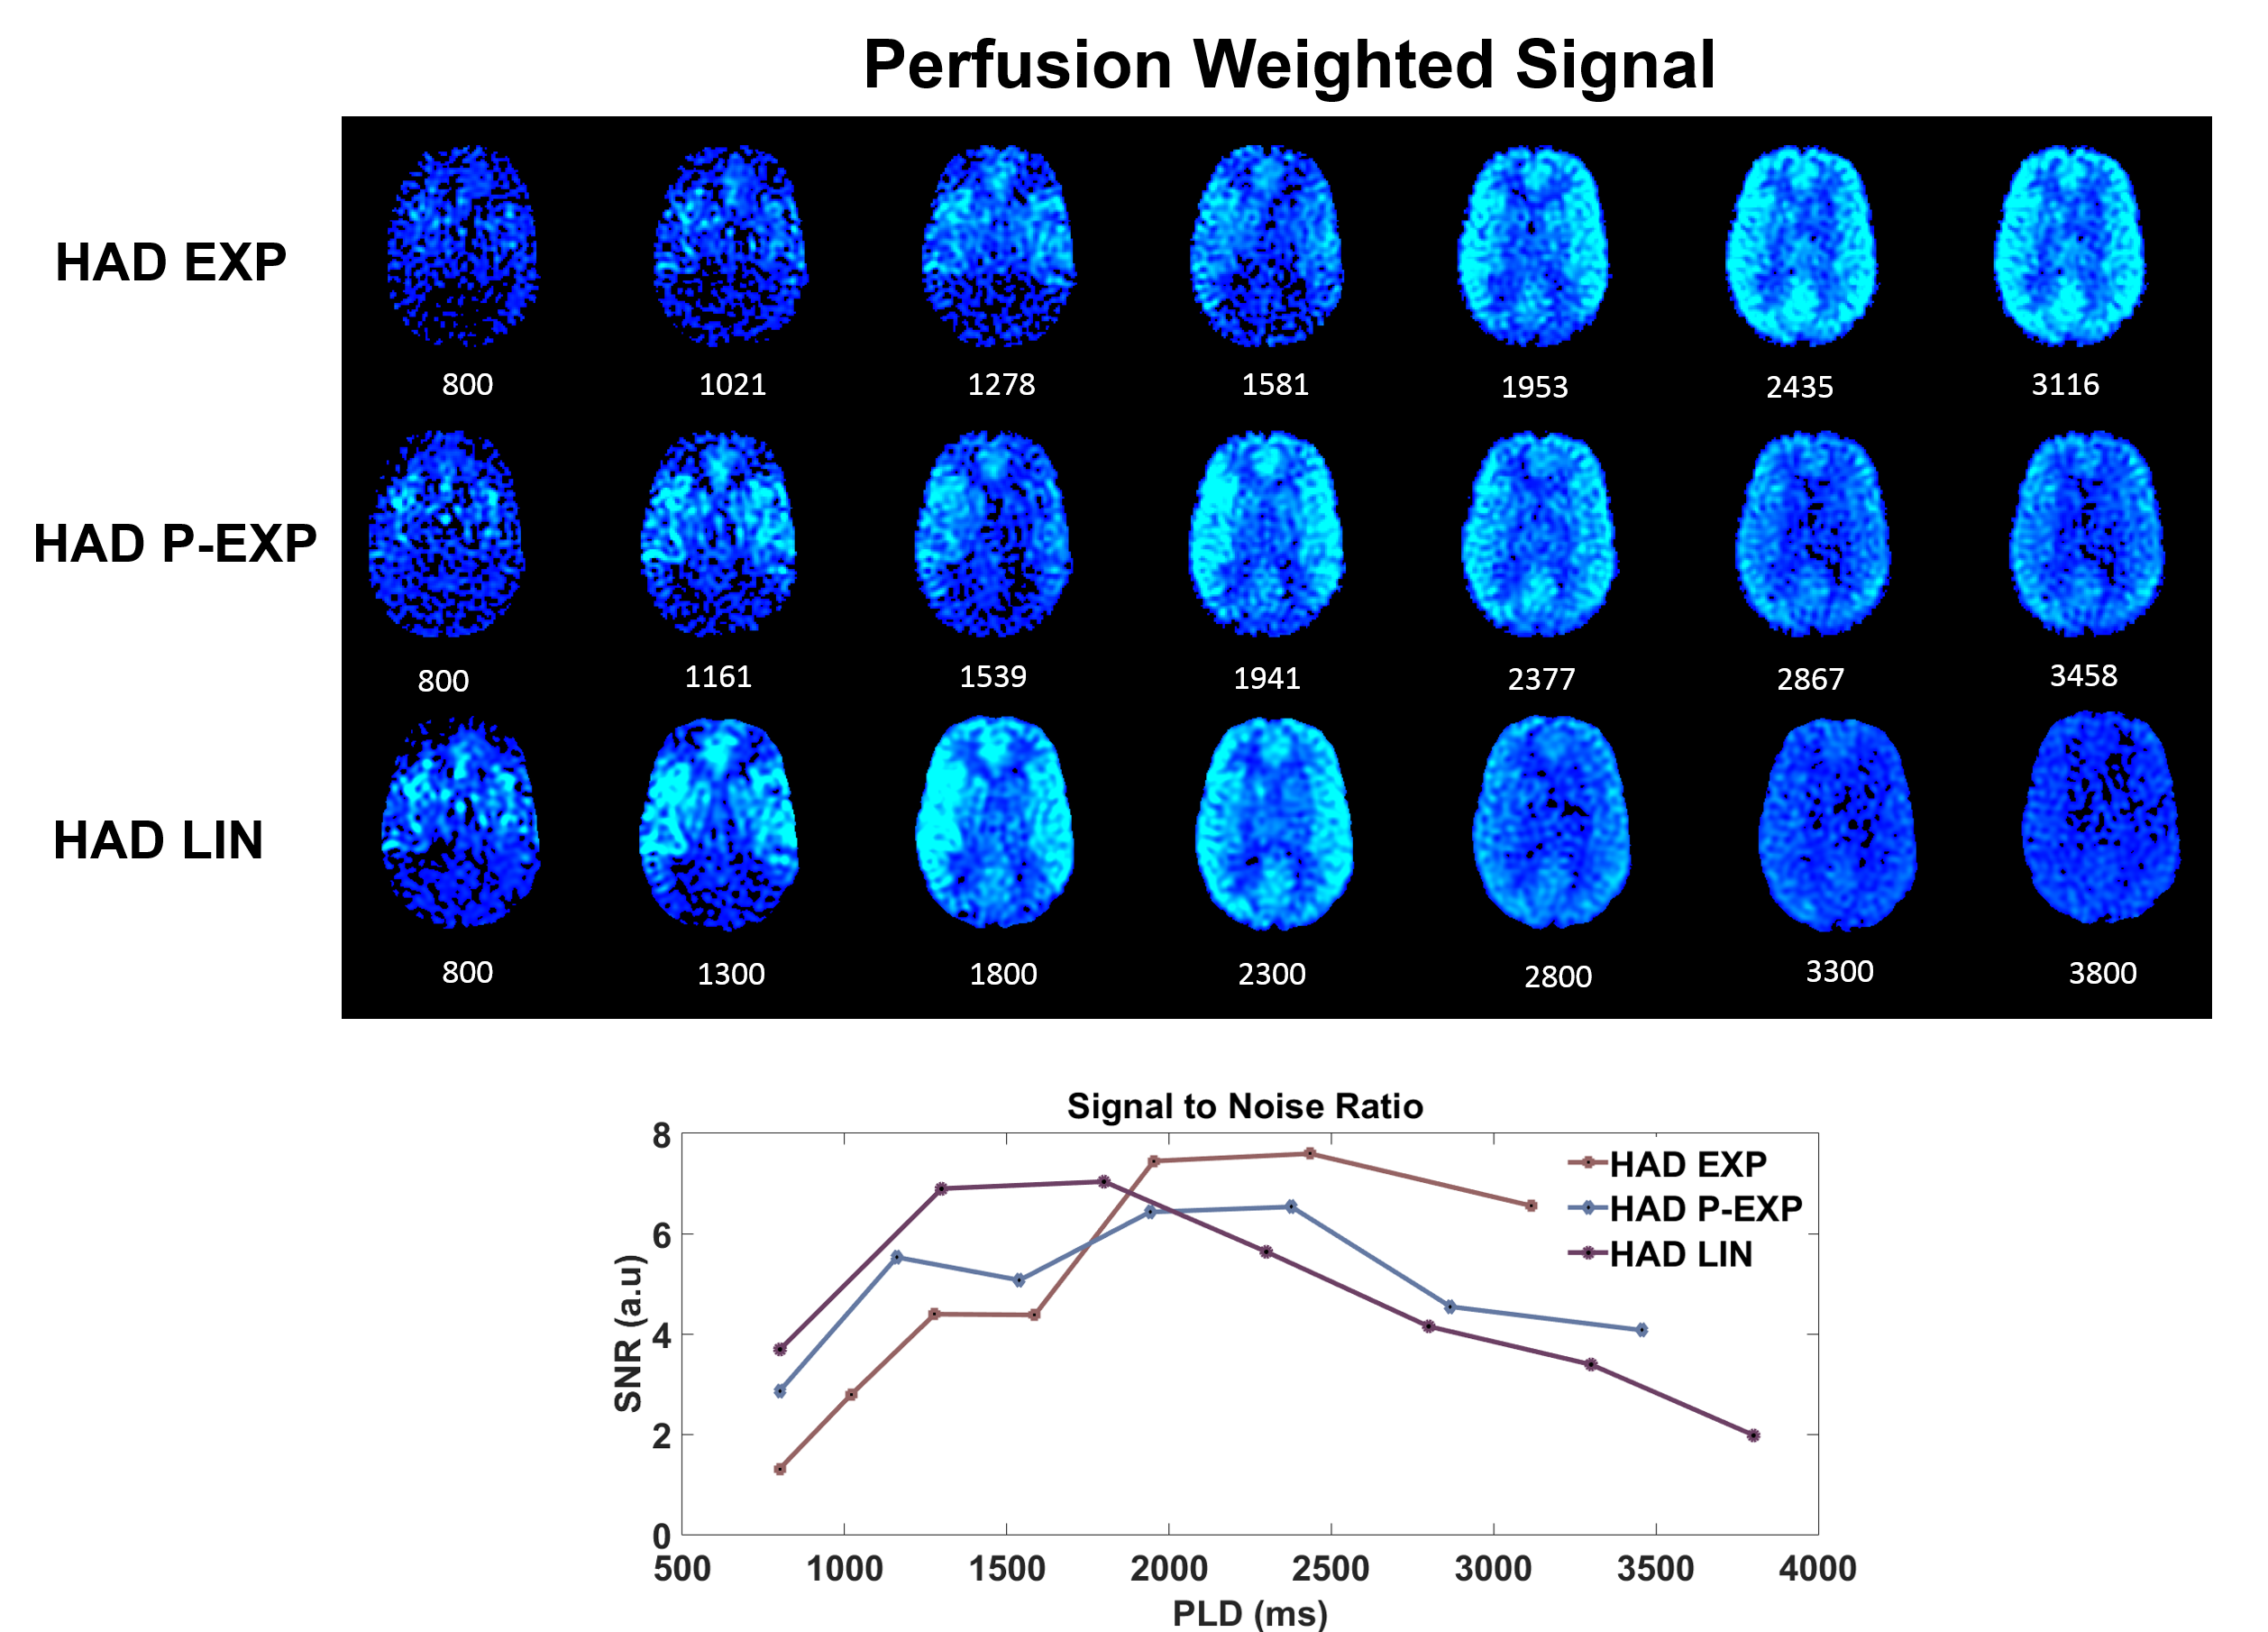
Signal to noise ratio was calculated as (GM signal/SD noise*0.655) for all three Hadamard sequences by extracting GM signal using GM masks and a spherical ROI placed outside the brain in an artefact-free region, respectively. SNR for each PLD was averaged across subjects and repeated scans were also included in this calculation.
Nine cortical GM vascular flow territories from Mutsaerts et al.,3 were used as ROIs to analyse CBF repeatability. CBF values from the territories were extracted from scan 1 and 2 of each pCASL sequence and shown using Bland-Altman plots4. Coefficient of repeatability (CR) was calculated for each sequence.
Results
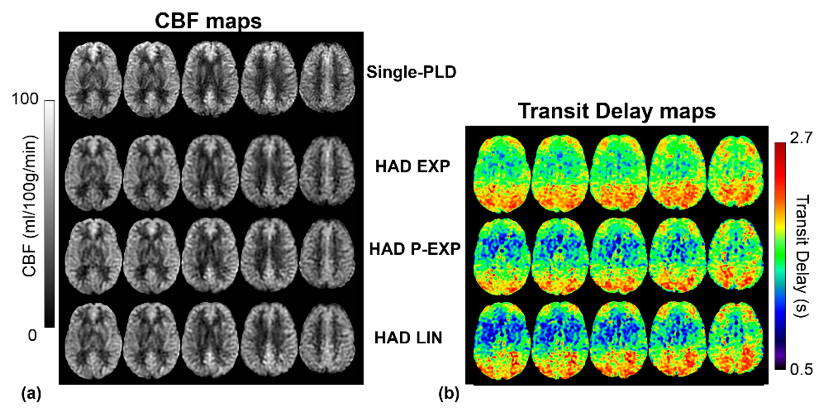
There were no significant differences between any of the mean CBF estimates (Table-2). There was a trend towards higher CBF values using single-PLD and lower with HAD-EXP.
Regional TD estimates, differed significantly. For the proximal MCA there were differences between the HAD EXP - HAD LIN (-45.22ms, p<0.001). The middle MCA region differed between HAD EXP - HAD LIN (-58.51ms, p<0.01). The distal MCA differed between the HAD EXP -HAD P-EXP (-67.54ms, p<0.01) and HAD EXP –HAD LIN (-108.46ms, p<0.001). In this distal region differences in TD were also seen between the HAD P-EXP –HAD LIN (-40.91ms, p<0.05).
The average SNR sum of all PLD SNR values did not differ. As highlighted in Figure-2, the HAD EXP sequence has higher tissue signal in latter PLDs, whereas HAD LIN in earlier PLDs. HAD P-EXP displays more signal balance throughout the PLD range.
The coefficient of repeatability, CR, was calculated for each pCASL sequence. CR was highest for single delay, 13.31, and lowest for HAD LIN, 10.89, with HAD EXP and P-EXP, 11.74 and 11.37, respectively.
Discussion
We have shown that multi-PLD pCASL with Hadamard encoding can be implemented in a clinically acceptable time with good spatial resolution. All Hadamard schemes showed slightly lower GM CBF estimates compared to single-PLD. This reduction was not significant and could be driven by partial volume effects. Using three vascular flow territories we found significant differences between the TD values measured with the Hadamard schemes. Exponential weighted schemes displayed lowest TD values in all regions, with greatest differences in distal regions. Neither single-PLD nor any multi-PLD combination showed good repeatability, however the best was obtained using the linear combination.Conclusion
Any of the schemes evaluated in this work can be executed in a clinically acceptable time; and may be employed to assess resting CBF without significant loss of accuracy. Pseudo-exponential weighting is recommended when investigating small differences in perfusion due to its better balanced distribution of SNR. The linear combination is recommended for repeated measures designs due to its higher repeatability.Acknowledgements
I would like to acknowledge my funders and collaborators at Unilever, UK and the ESPRC Centre for Doctoral Training at King's College London, St Thomas' Hospital.References
1. Dai, W., et al. (2013). "Volumetric measurement of perfusion and arterial transit delay using Hadamard encoded continuous arterial spin labelling." Magnetic Resonance in Medicine 69(4): 1014-1022.
2. Teeuwisse, W. M., et al. (2014) "Time encoded pseudo continuous arterial spin labelling: basic properties and timing strategies for human applications." Magnetic Resonance in Medicine 72(6): 1712-1722.
3. Mutsaerts, H. J. M. M., et al (2015) "Cerebral Perfsusion Measurements in Elderly with Hypertension using Arterial Spin Labelling." PLoS One 10:1-13
4. Bland , J. M. and Altman, D. G. (1986) "Statistical methods for assessing agreement between two methods of clinical measurement." Lancet, 1(8746):307-310
Figures