2170
Simultaneous Acquisition of ASL, BOLD effect, Phase and QSM for Functional Multi-Parametric Brain Studies1Center for Functional and Metabolic Mapping, Robarts Research Institute, Western University, London, ON, Canada, 2Medical Biophysics, Western University, London, ON, Canada
Synopsis
A 2D-GRE-EPI based sequence combined with the PICORE magnetization preparation technique was used to acquire functional Arterial Spin Labeling (ASL) perfusion data at high field (7T). BOLD and Cerebral Blood Flow (CBF) changes along with phase and susceptibility maps (QSM) are obtained and assessed from this scan. Using a pre-determined general linear model (GLM), a strong correlation between the change in these parameters in the activated region (visual cortex) has been found showing that this multi-parametric acquisition may help in resolving the multi-factorial BOLD signal for functional brain studies.
INTRODUCTION
By offering a direct quantitative measurement of the cerebral blood flow (CBF), arterial spin labelling (ASL) perfusion magnetic resonance imaging (MRI) is increasingly used for imaging of task-related brain activation; and might be considered as an alternative to blood oxygen level-dependent (BOLD) functional MRI (fMRI) used as a marker for neural activation1. The quantitative aspect of a functional task can further be analysed by including MR signal phase to obtain quantitative susceptibility mapping (QSM) data, which quantify venous oxygen saturation levels via tissue susceptibility measurements (Δχ) 2. The study assessed the feasibility of the simultaneously acquired functional ASL (fASL), fMRI, phase and QSM high field data for multi-parametric brain studies3.MATERIALS AND METHODS
Functional ASL data from four healthy volunteers were acquired on a 7T head-only Siemens system equipped with multi-transmit capabilities, using a 2D EPI-based Pulsed ASL (PASL) sequence combined with the PICORE Q2TIPS scheme for the blood labeling4. The acquisition parameters were (TE/TR=9.5ms/3500ms, TI1/TI2=700/1800ms, flip-angle=60o, 10 slices with voxel size=2.5x2.5x2.5mm3, 20% inter-slice distance, and 70 repetitions during a 35-second block design of visual stimuli with a concentric checkerboard (flickering at 8Hz), presented on a grey background. The imaging slab was oblique-axially oriented at -26o±4o to achieve good coverage of the visual cortex region. Both magnitude and phase images were collected from the raw data. Phase images from each coil were combined using the coil receive sensitivity (B1-) profiles5.
Perfusion images were generated from the tag-control difference data by averaging all the resting and active time points (TPs)6. Similarly, the pre-processing of magnitude data (including individual tag and control data) was carried out in FMRI Expert Analysis Tool (FEAT) of FSL, by using the BOLD effect and activation perfusion signal regressors7,8. The original phase images were unwrapped9, demeaned, then the centre of k-space zeroed to adjust for any constant phase drift introduced between time points (TPs). Motion correction parameters from the magnitude data were then applied to the demeaned phase. The ‘resting’ (excluding the undershoot TPs) and ‘active’ TPs were identified (avoiding the transitional TPs) and then averaged in phase, respectively. ‘Active’ and ‘resting’ phase difference (φdiff) was utilised to measure Δχ values in draining veins10. The draining vein contours were manually drawn to measure the mean of Δχ (or Δχv).
RESULTS and DISCUSSIONS
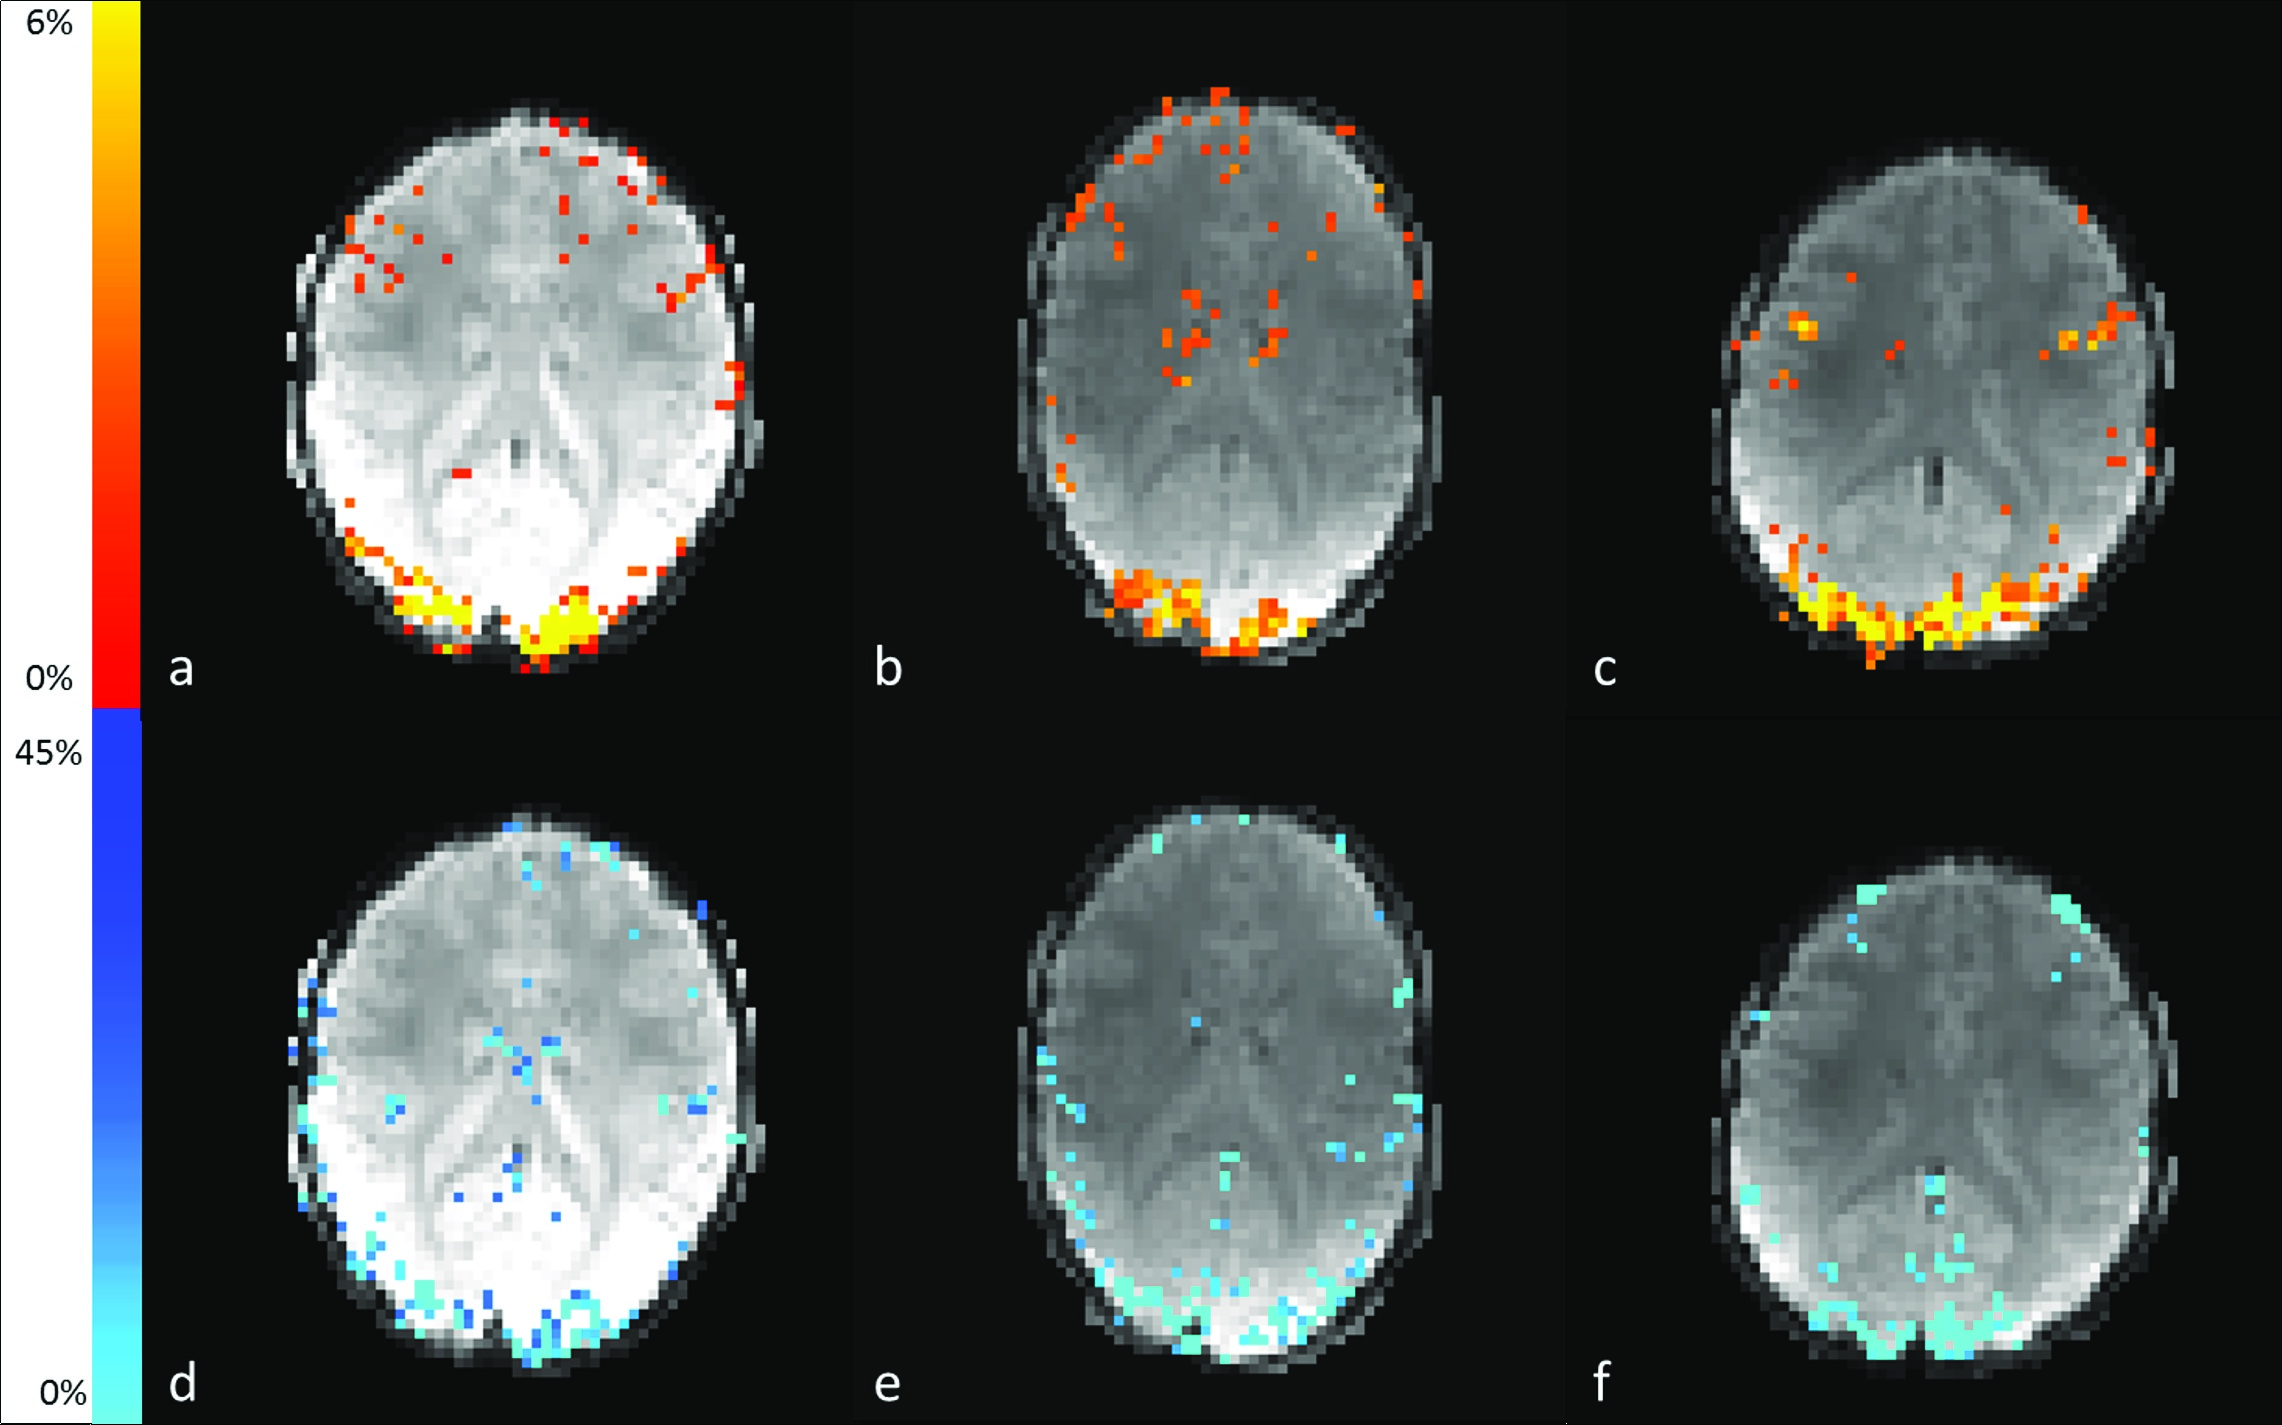
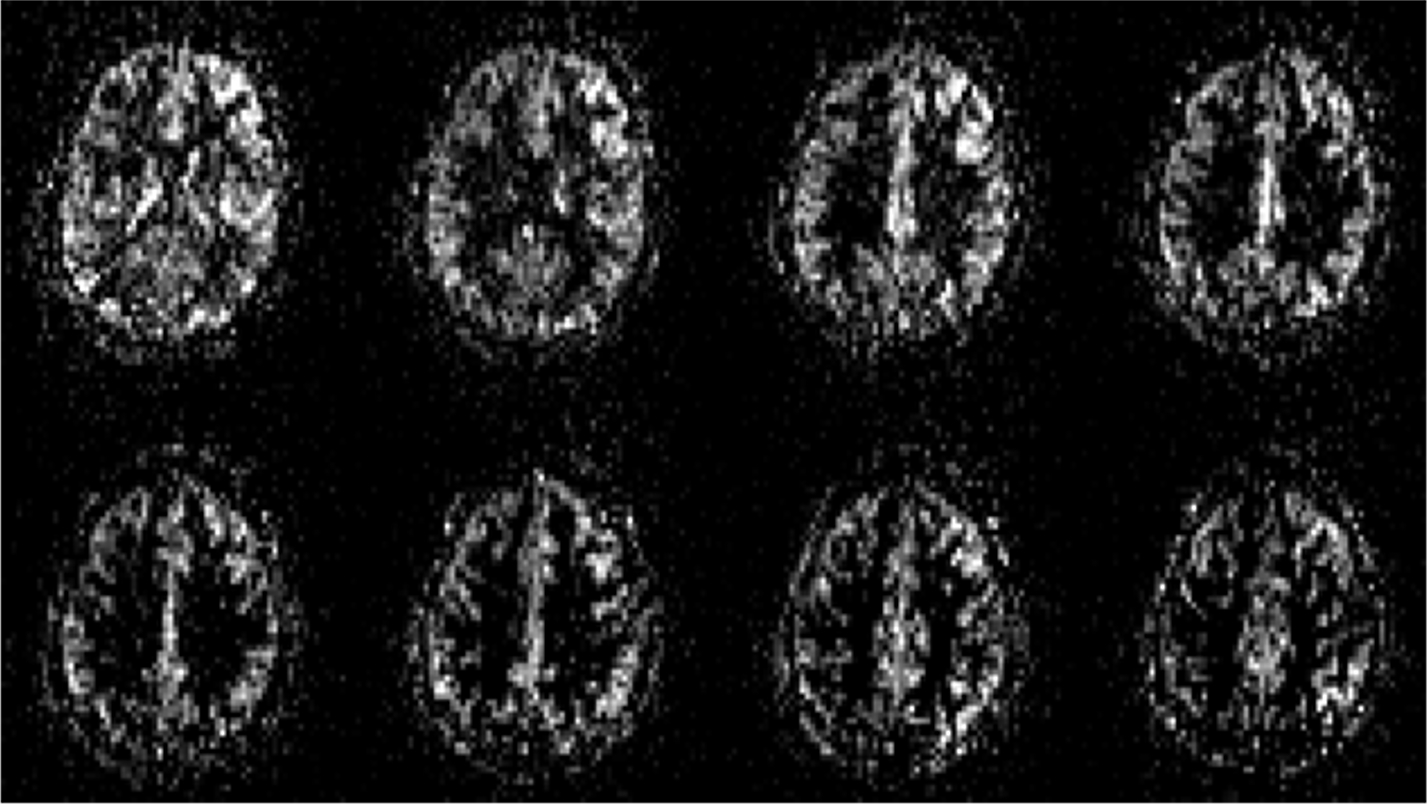
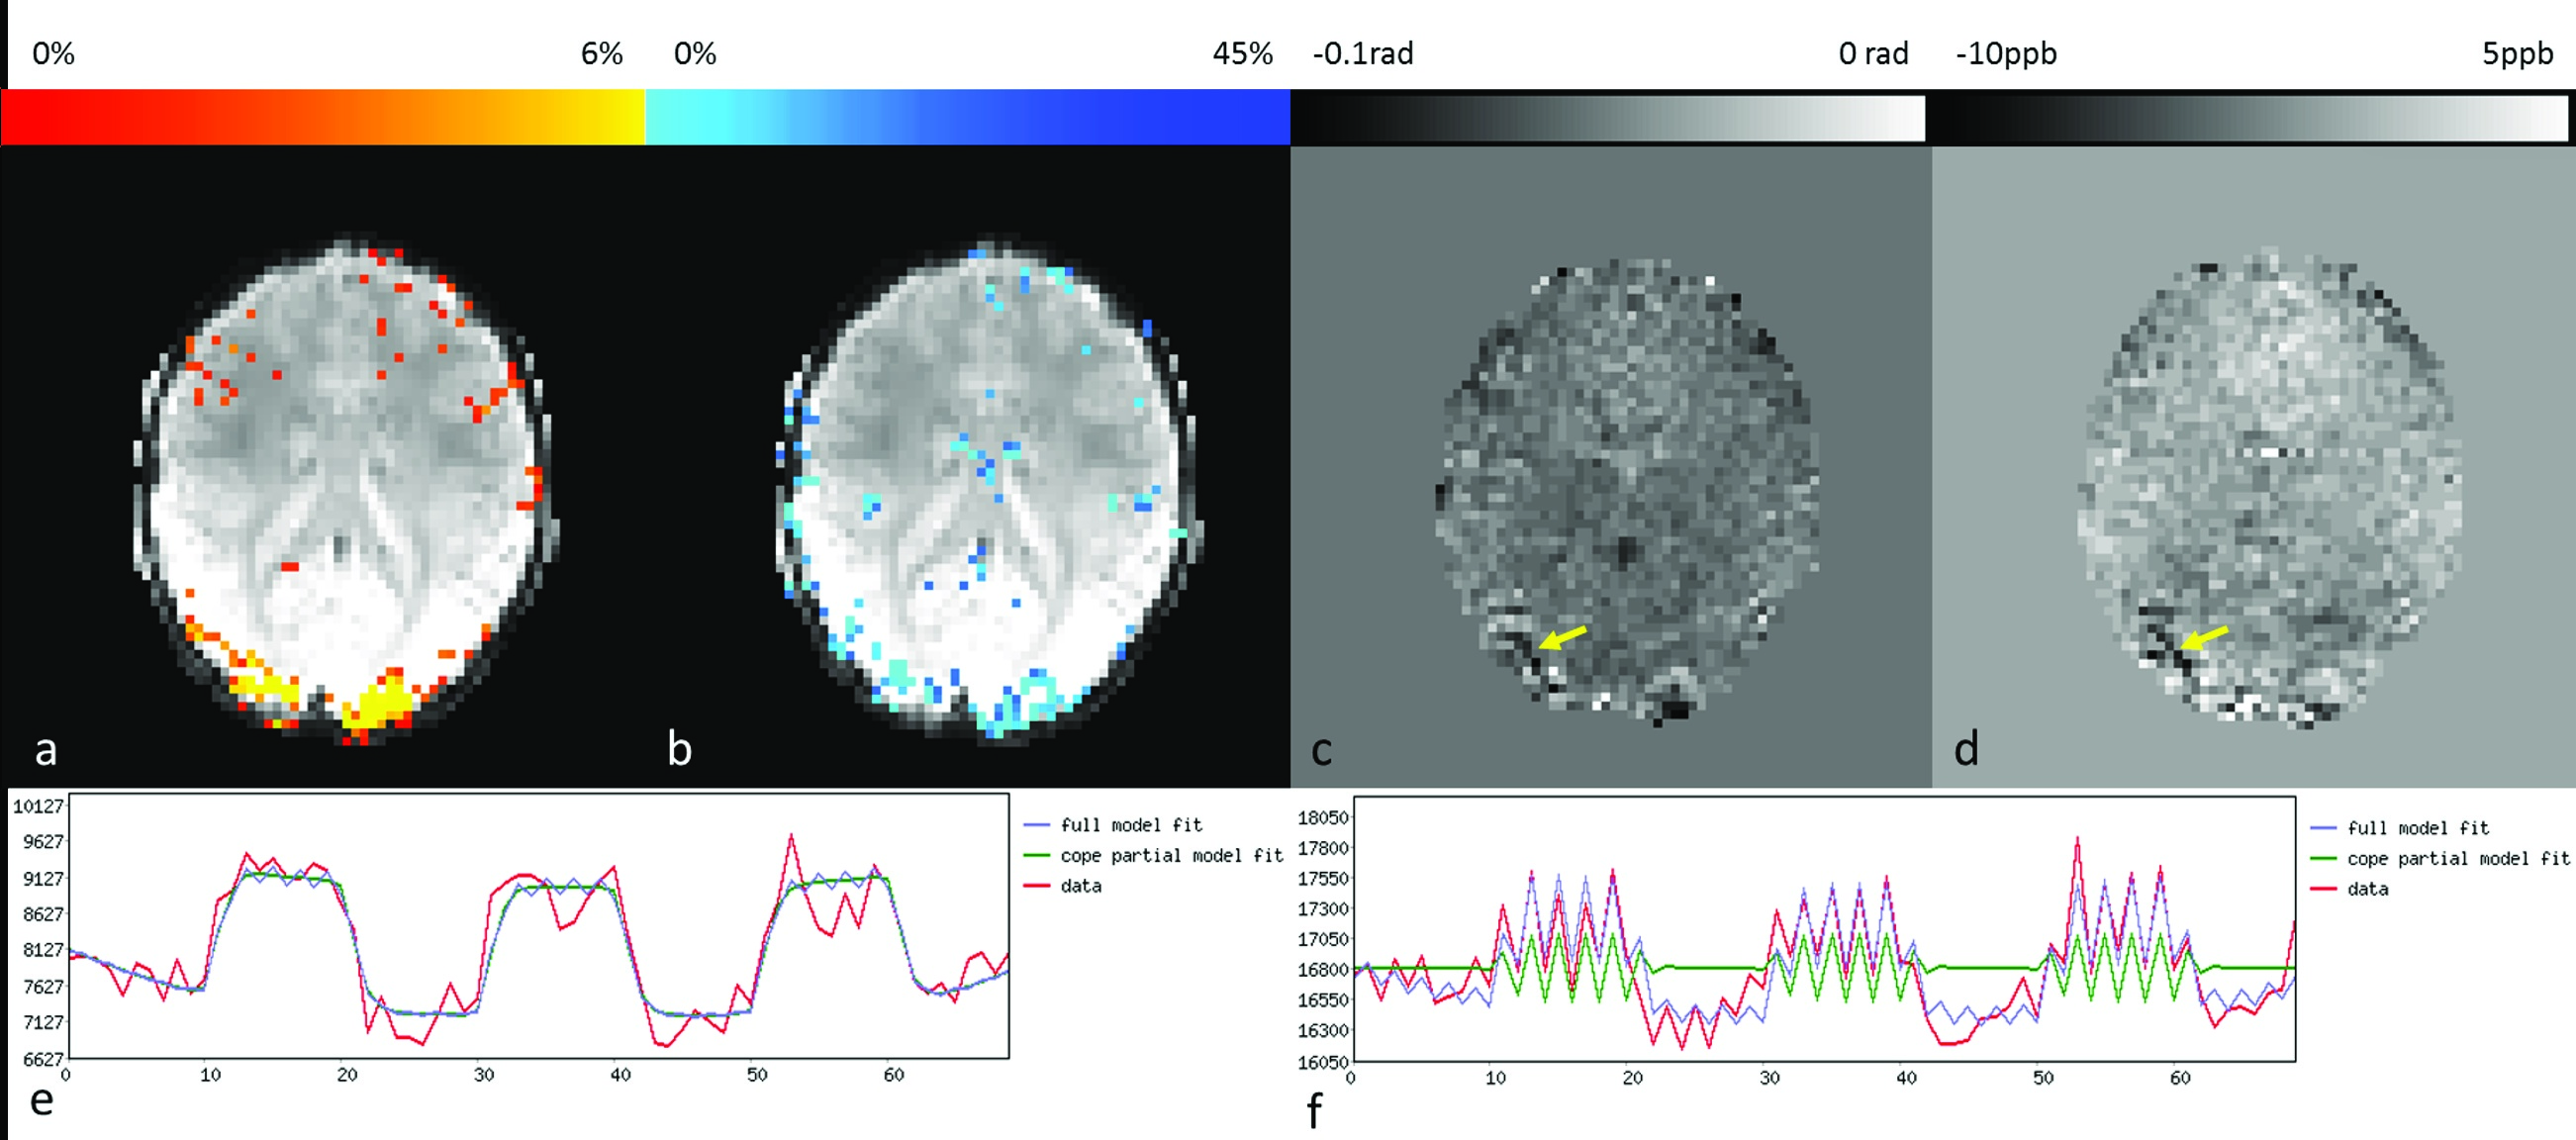
Fig.1 highlights the area of activation, i.e. visual cortex, of both CBF and percentage BOLD change (%-BOLD change) maps. The perfusion images from one volunteer are displayed in Fig.2. Fig.3 shows the agreement between BOLD effect (Fig.3a) and perfusion (Fig.3b) in the visual cortex from one volunteer, whereas Fig.3e and Fig.3f show the strong correlation between BOLD, fASL data and the General Linear Models, respectively. The mean CBF and the difference in mean CBF across the volunteers in the manually drawn region-of-interest (ROI) during the visual stimuli and rest were (in ml/100g of tissue/min) 76±5 and 48±6, respectively; consistent with a previous study on CBF change due to visual stimuli11. Similarly, the mean and difference in mean global CBF value was measured as 42±6ml/100g of tissue/min. In addition, the %-BOLD change during the visual activation within the same ROI was 8±1%. The activation region covered by both %-BOLD change and CBF was similar (4097 voxels for %-BOLD change maps and 3849 voxels for CBF difference map from one volunteer), demonstrating that CBF was as sensitive as BOLD. The underlying veins pertaining to the visual cortex activation were identified on the phase difference map (Fig.3c) as well as on the QSM data (Fig.3d). The susceptibility difference value measured from the veins situated in the visual cortex (identified by yellow arrow in Fig.3d) was 35±3ppb.CONCLUSION
The preliminary results of this study show that simultaneous quantification of functional brain parameters, helps in resolving the multi-factorial BOLD signal. fASL permits a direct access to the vascular component of the neurovascular coupling through the CBF parameter, whereas QSM aids in evaluating the time course of the correlation degree between the signal change due to BOLD effect and the oxygenation levels during the rest/activation periods. The susceptibility change in the draining vein was not as strong as expected from the CBF values, and this could be caused by the relatively low resolution in the obtained data, hence, introducing the partial voluming related underestimation. The outcome of this study will be improved by achieving more brain coverage for phase information and, hence, allowing a more accurate reconstruction of susceptibility maps.Acknowledgements
The authors acknowledge Trevor Szekeres for acquiring the MRI data. This work was supported by the Canadian Institutes of Health Research Foundation grant (grant # 353372) and a Brain Canada Platform Support Grant.References
1. D Ivanov, et al. Optimization of simultaneous multislice EPI for concurrent functional perfusion and BOLD signal measurements at 7T. Magnetic Resonance in Medicine (2017) 78:121–129.
2. DZ Balla, et al, Functional quantitative susceptibility mapping (fQSM). NeuroImage (2014) 15;100:112-24.
3. WM Luh, et al, QUIPSS II With Thin-Slice TI1 Periodic Saturation: A Method for Improving Accuracy of Quantitative Perfusion Imaging Using Pulsed Arterial Spin Labeling. Magnetic Resonance in Medicine (1999) 41:1246–1254.
4. BA Landman, et al, Multi-parametric neuroimaging reproducibility: a 3-T resource study. NeuroImage (2011); 54: 2854–2866.
5. O Stanley et al, Absolute B1-estimation without a homogeneous receive coil. Proceedings of the 25th Annual Meeting of ISMRM (2017); Honolulu, HI, USA. p. 5177.
6. DC Alsop et al, Recommended Implementation of Arterial Spin-Labeled Perfusion MRI for Clinical Applications: A Consensus of the ISMRM Perfusion Study Group and the European Consortium for ASL in Dementia. Magnetic Resonance in Medicine (2015), 73: 102–116.
7. M Jenkinson et al, FSL. Neuroimage (2012) Aug 15; 62(2):782-90.
8. JA Mumford et al, Estimation efficiency and statistical power in arterial spin labeling fMRI. Neuroimage (2006) Oct 15;33(1):103-14.
9. HS Abdul-Rahman et al, Fast and robust three-dimensional best path phase unwrapping algorithm. Appl Opt. (2007) Sep 10;46(26):6623-35.
10. J Liu et al, Morphology enabled dipole inversion for quantitative susceptibility mapping using structural consistency between the magnitude image and the susceptibility map. Neuroimage (2012) Feb 1;59(3):2560-8.
11. TQ Duong et al, High-resolution, spin-echo BOLD, and CBF fMRI at 4 and 7 T. Magnetic Resonance in Medicine (2002) Oct;48(4):589-93.
Figures