2167
Measurement of Pulmonary Perfusion using PCASL True-FISP Imaging at 1.5 Tesla1Section on Experimental Radiology, University of Tübingen, Tübingen, Germany, 2Department of Diagnostic and Interventional Radiology, University of Tübingen, Tübingen, Germany, 3Max Planck Institute for Biological Cybernetics, Tübingen, Germany, Tübingen, Germany, 4Institute of Signal Processing and System Theory, University of Stuttgart, Stuttgart, Germany, 5Department of Biomedical Magnetic Resonance, University of Tübingen, Tübingen, Germany
Synopsis
Pseudo-continuous-arterial-spin-labeling (PCASL) has been successfully applied in the liver and kidney providing high signal-to-noise-ratio. The goal of this work is to assess the potential of PCASL technique to measure the pulmonary perfusion at 1.5 T. Effective labeling of pulmonary blood flow was achieved by ECG triggering and an orientation of the labeling plane perpendicular to the pulmonary trunk. Fast True-FISP imaging with short TE of 0.9 ms was used to obtain high signal from lung parenchyma. The PCASL-True-FISP technique provides high quality perfusion images of the lung and allows quantitative measurements of pulmonary perfusion both in multiple breath-holds and under free breathing condition.
Introduction and Purpose
Examination of the spatial distribution of pulmonary
perfusion is of importance for diagnosis of lung diseases such as pulmonary
embolism, pneumoconiosis, and emphysema. Even though the lung is a well perfused organ, reliable
perfusion imaging by MRI is still a challenging
task. Due to the complex vessel anatomy and highly pulsatile nature of
pulmonary circulation, the vessel identification for accurate blood labeling is
a tough choice. Pulsed arterial spin labeling (ASL) techniques have been used
for non-invasive evaluation of perfusion in the lung.1,2 The pseudo-continuous ASL (PCASL) approach has been
successfully applied for renal perfusion imaging3 and provides in
general higher SNR compared to pulsed ASL approaches.4 One of the major advantages of PCASL compared to pulsed ASL
is a largely reduced motion sensitivity of the labeling region. PCASL has been used previously to
measure pulmonary perfusion by tagging the inferior vena cava.5
However, the non-labeled blood from the superior vena cava reduced the labeling
efficiency and hindered accurate
quantification. Moreover, data acquisition using a
single-shot turbo spin echo sequence led to strong image blurring. Recently, a combination of PCASL of pulmonary arteries and True-FISP imaging provided high-quality perfusion
images of the lung at 3T.6 However, although the ASL technique benefits from higher
magnetic field strength, the detection of
sufficiently high and reproducible signal from the lung parenchyma is hampered by its extremely short T2*
values.7 Therefore, the total ASL
signal might profit from measuring
at lower field strengths. The main goal of this work is to assess the potential
of PCASL with True-FISP data acquisition to measure the lung perfusion at 1.5T.
Additionally, the influence of respiratory motion on the ASL signal is
evaluated.Methods
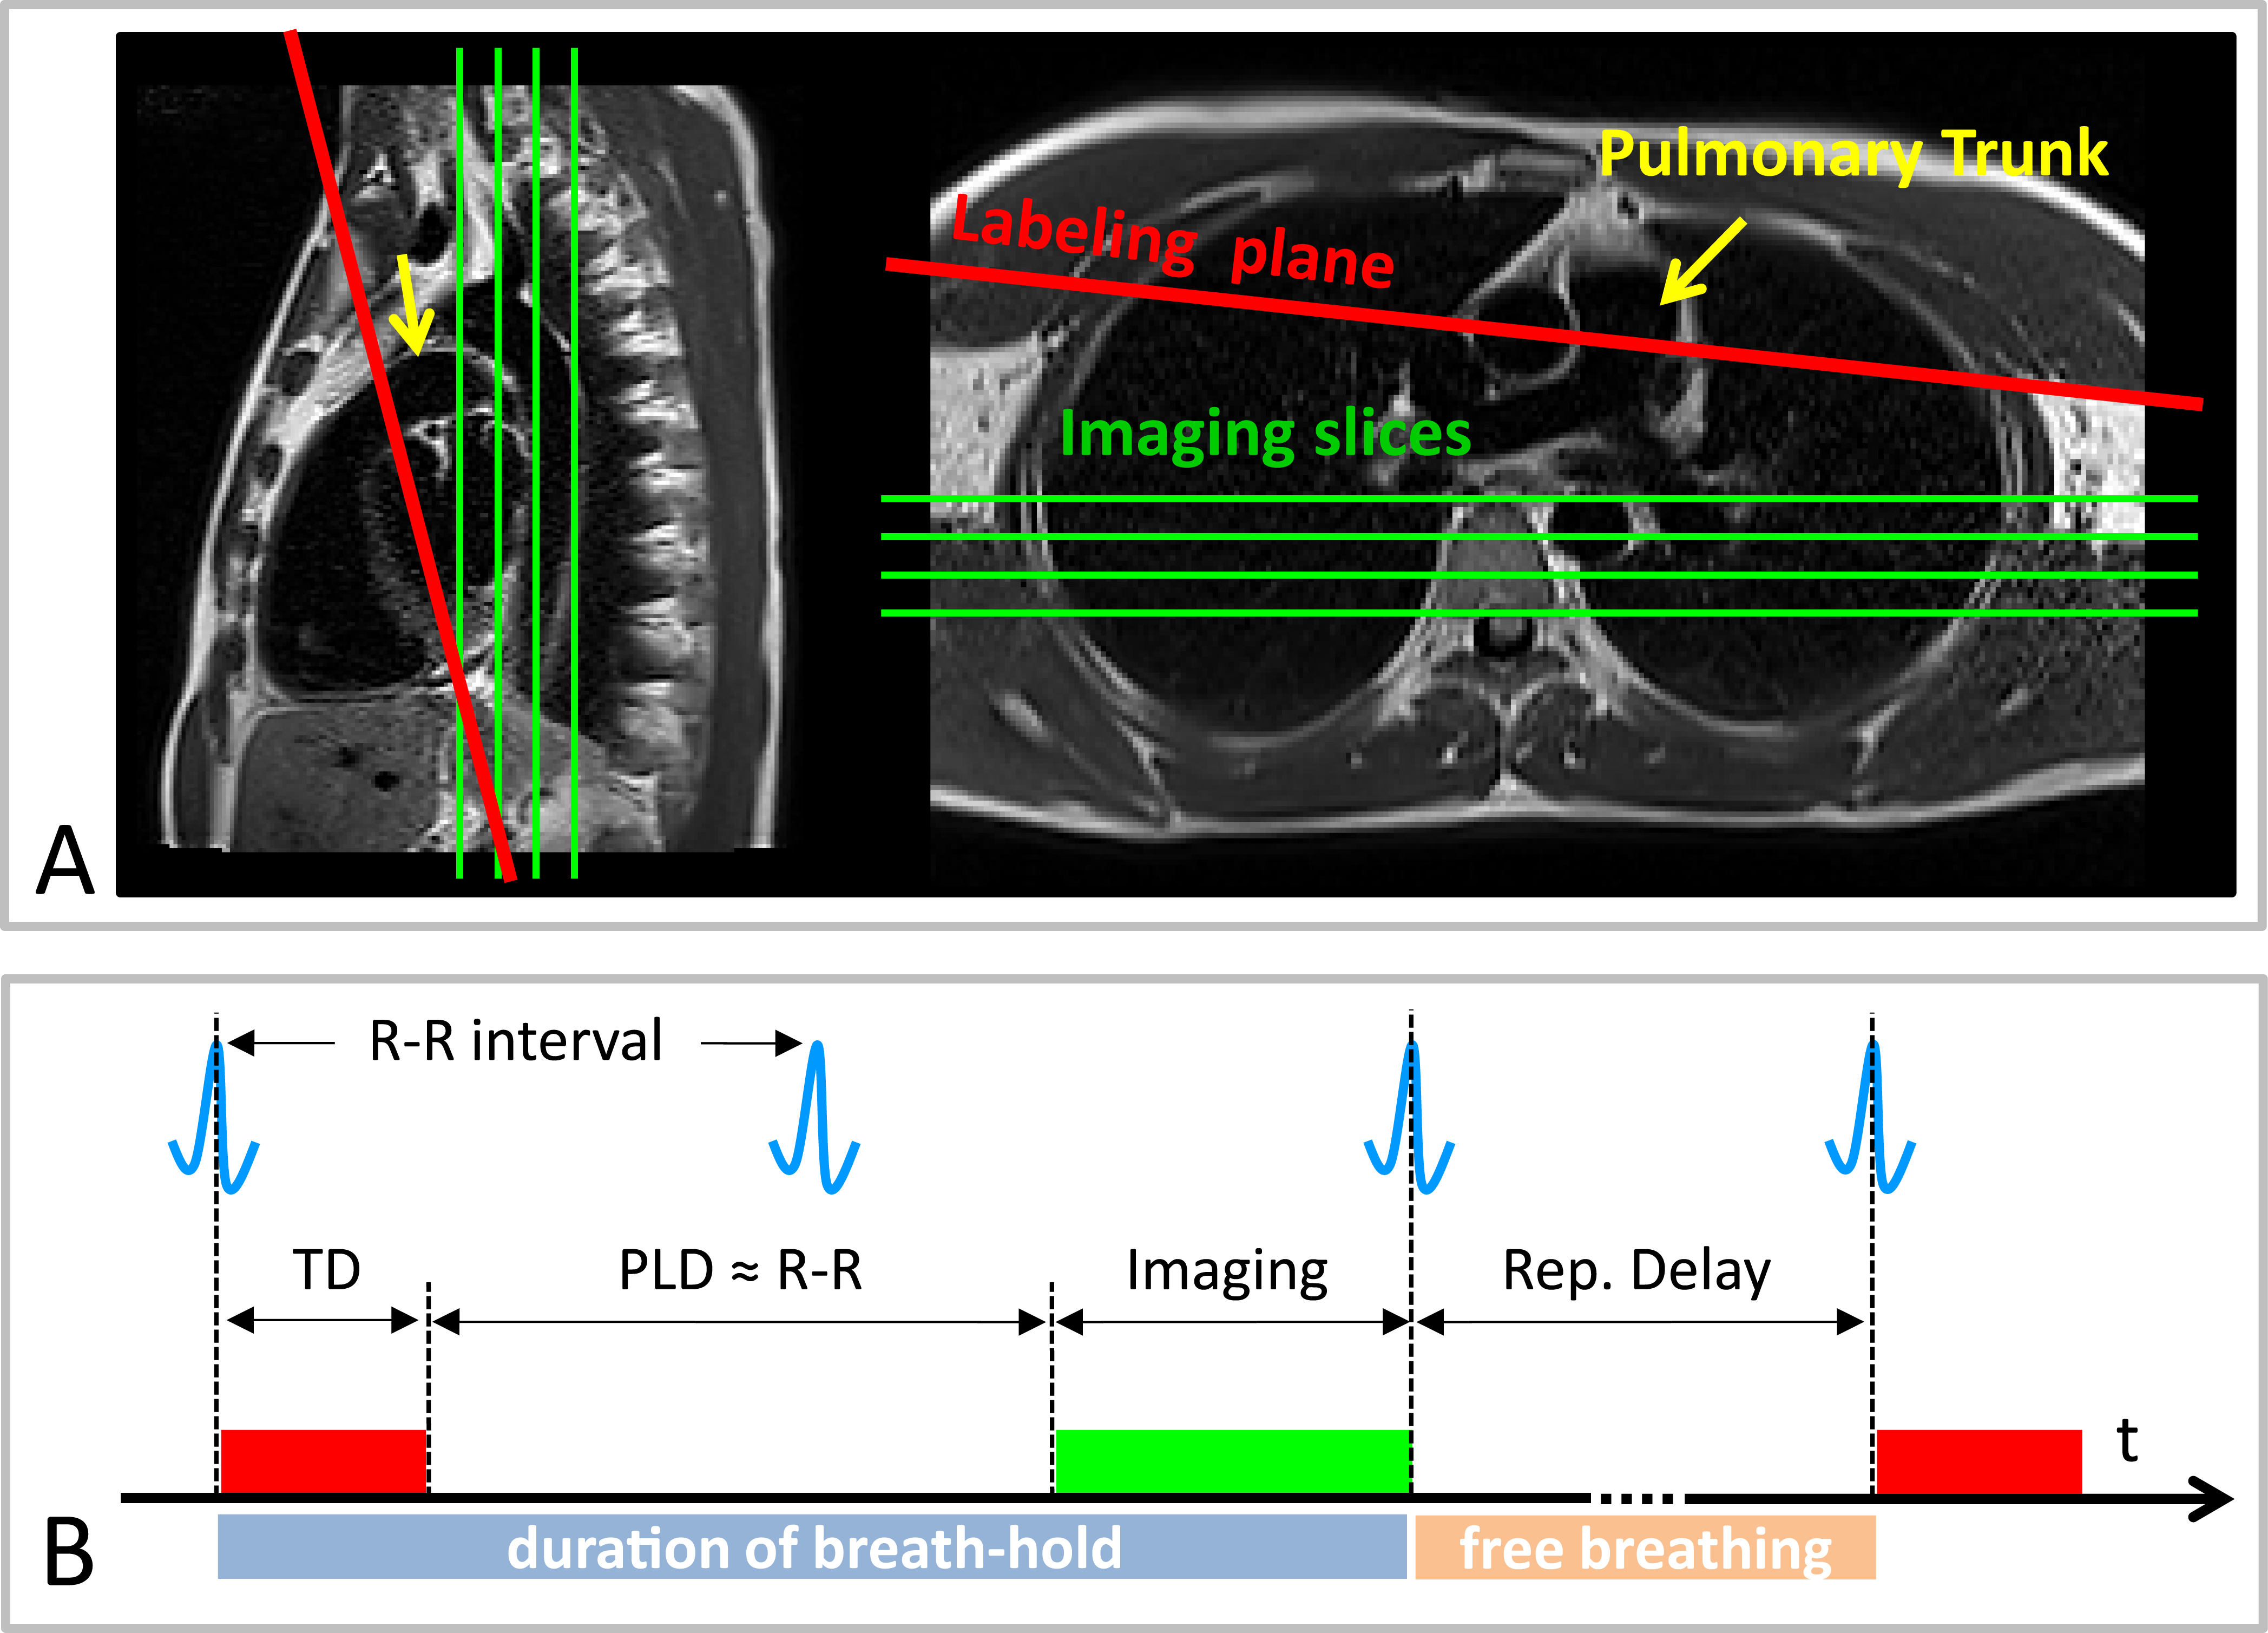
Measurements were performed on a 1.5T MR scanner (AvantoFit, Siemens Healthcare, Erlangen, Germany). The pulmonary perfusion of five healthy volunteers (age 32±10, one female) was measured using a PCASL sequence8 with a True-FISP data acquisition module. Single post-labeling delay (PLD) approach was utilized for evaluation of the lung perfusion. Tagging parameters were: tagging-duration (TD),300ms; PLD,1000ms; flip-angle,25°; gradient-strength,7mT/m. Background suppression (BS) for lung tissue (T1~1000ms) was performed using a double inversion approach3. The tagging plane was placed nearly perpendicular to the pulmonary trunk allowing simultaneous perfusion imaging of the right and left lung (Figure 1A). The tagging pulse train was triggered to the ECG signal and applied during the systolic period, avoiding unnecessary RF power deposition in the body. The data acquisition was performed in diastole of the next cardiac cycle (Figure 1B). The True-FISP sequence was adapted to achieve short TE/TR (0.9/2.1ms) using following parameters: flip-angle,70°; slice-thickness,10mm; in-plane-resolution,2.5×2.5mm2; partial-Fourier,0.75; matrix-size,144×192; readout-bandwidth,1260Hz/Pixel.
Three respiration schemes were evaluated: 1) by employing a timed breathing protocol twenty label-control image pairs were acquired with a repetition delay of 5s; 2) free breathing examination was performed with the same measurement parameters; 3) four label-control image pairs were acquired in a single breath-hold with a repetition delay of 1s. A proton-density weighted True-FISP image was also acquired at the start of the sequence to estimate the M0 of the blood. The overall measurement time for acquisition of twenty and four image pairs was 5:03min and 24s, respectively.
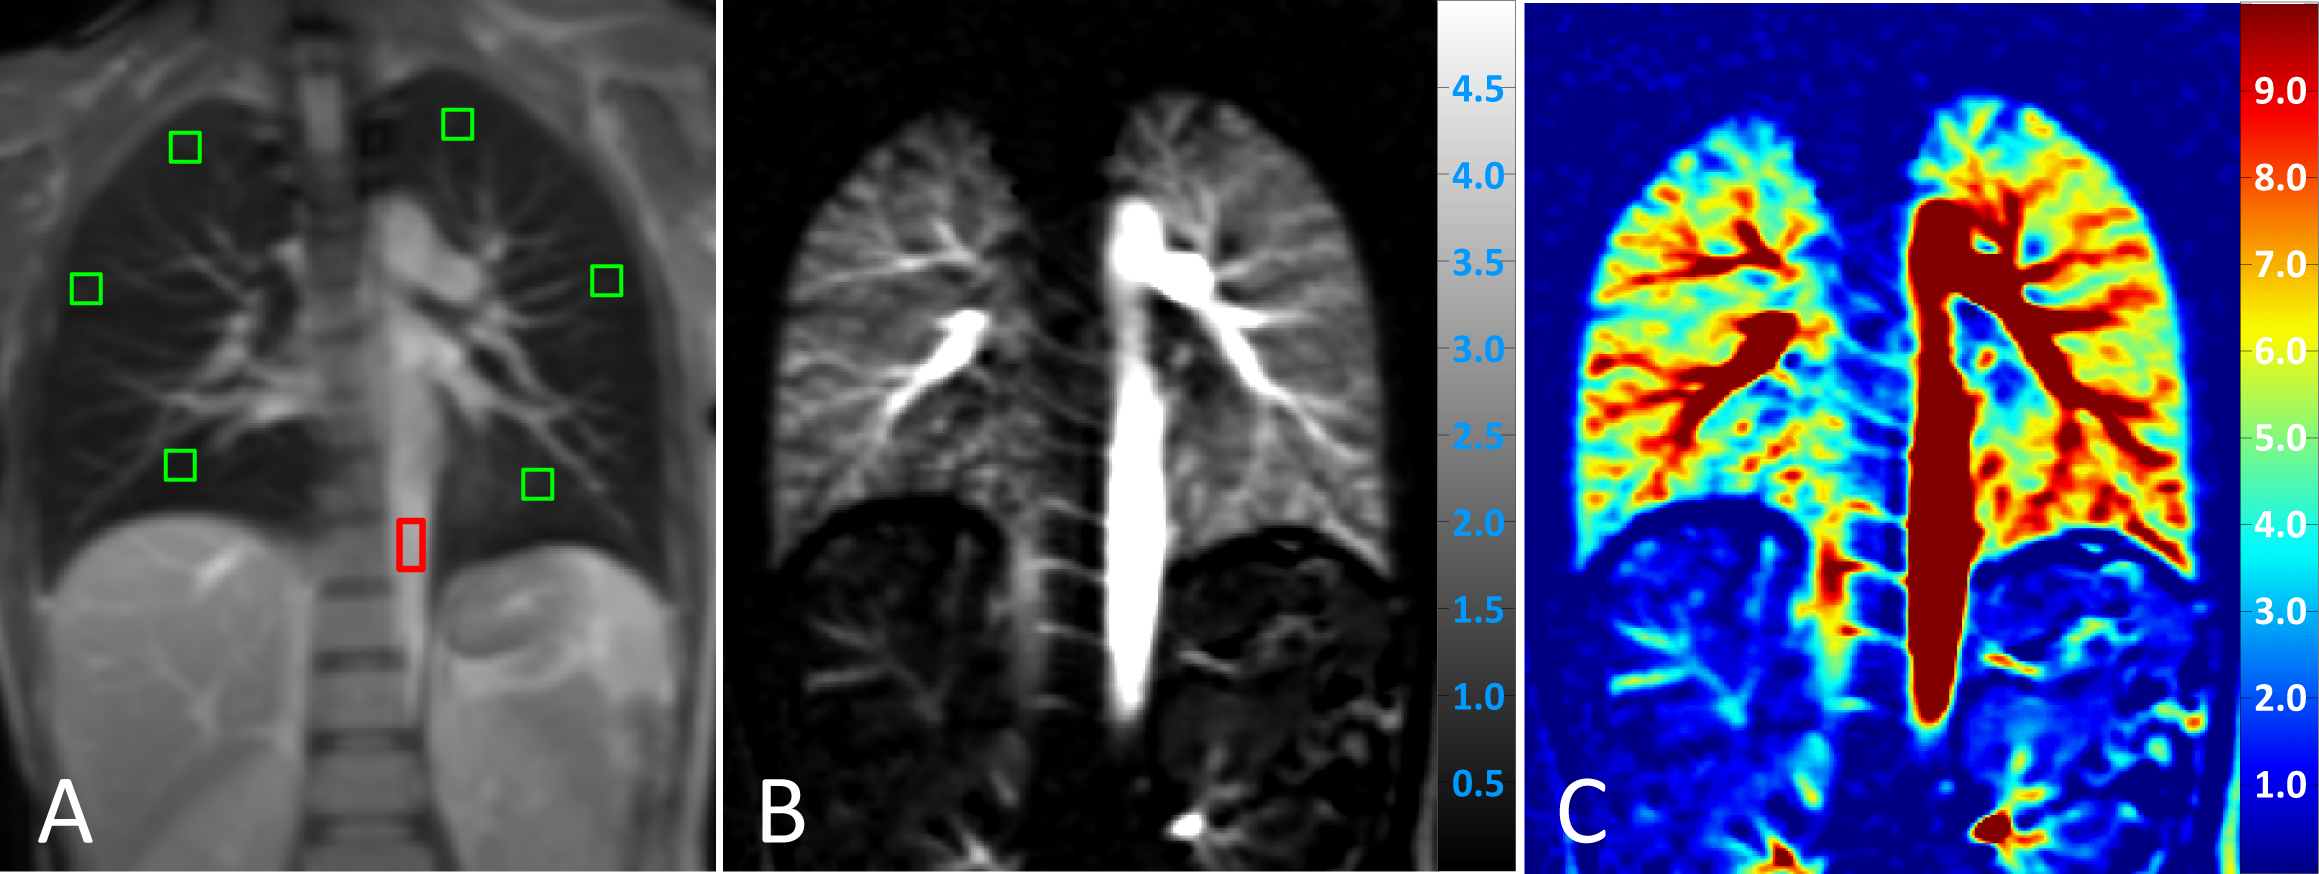
PCASL images were processed by self-written code in MATLAB. Perfusion was quantified in manually drawn regions of interest (ROIs) based on a one-compartment perfusion model.4,9 Therefore, ROIs were carefully placed in the peripheral lung parenchyma at three different heights (apical, middle, basal – see Figure 2A) to avoid contribution of macroscopic vessels.
Results
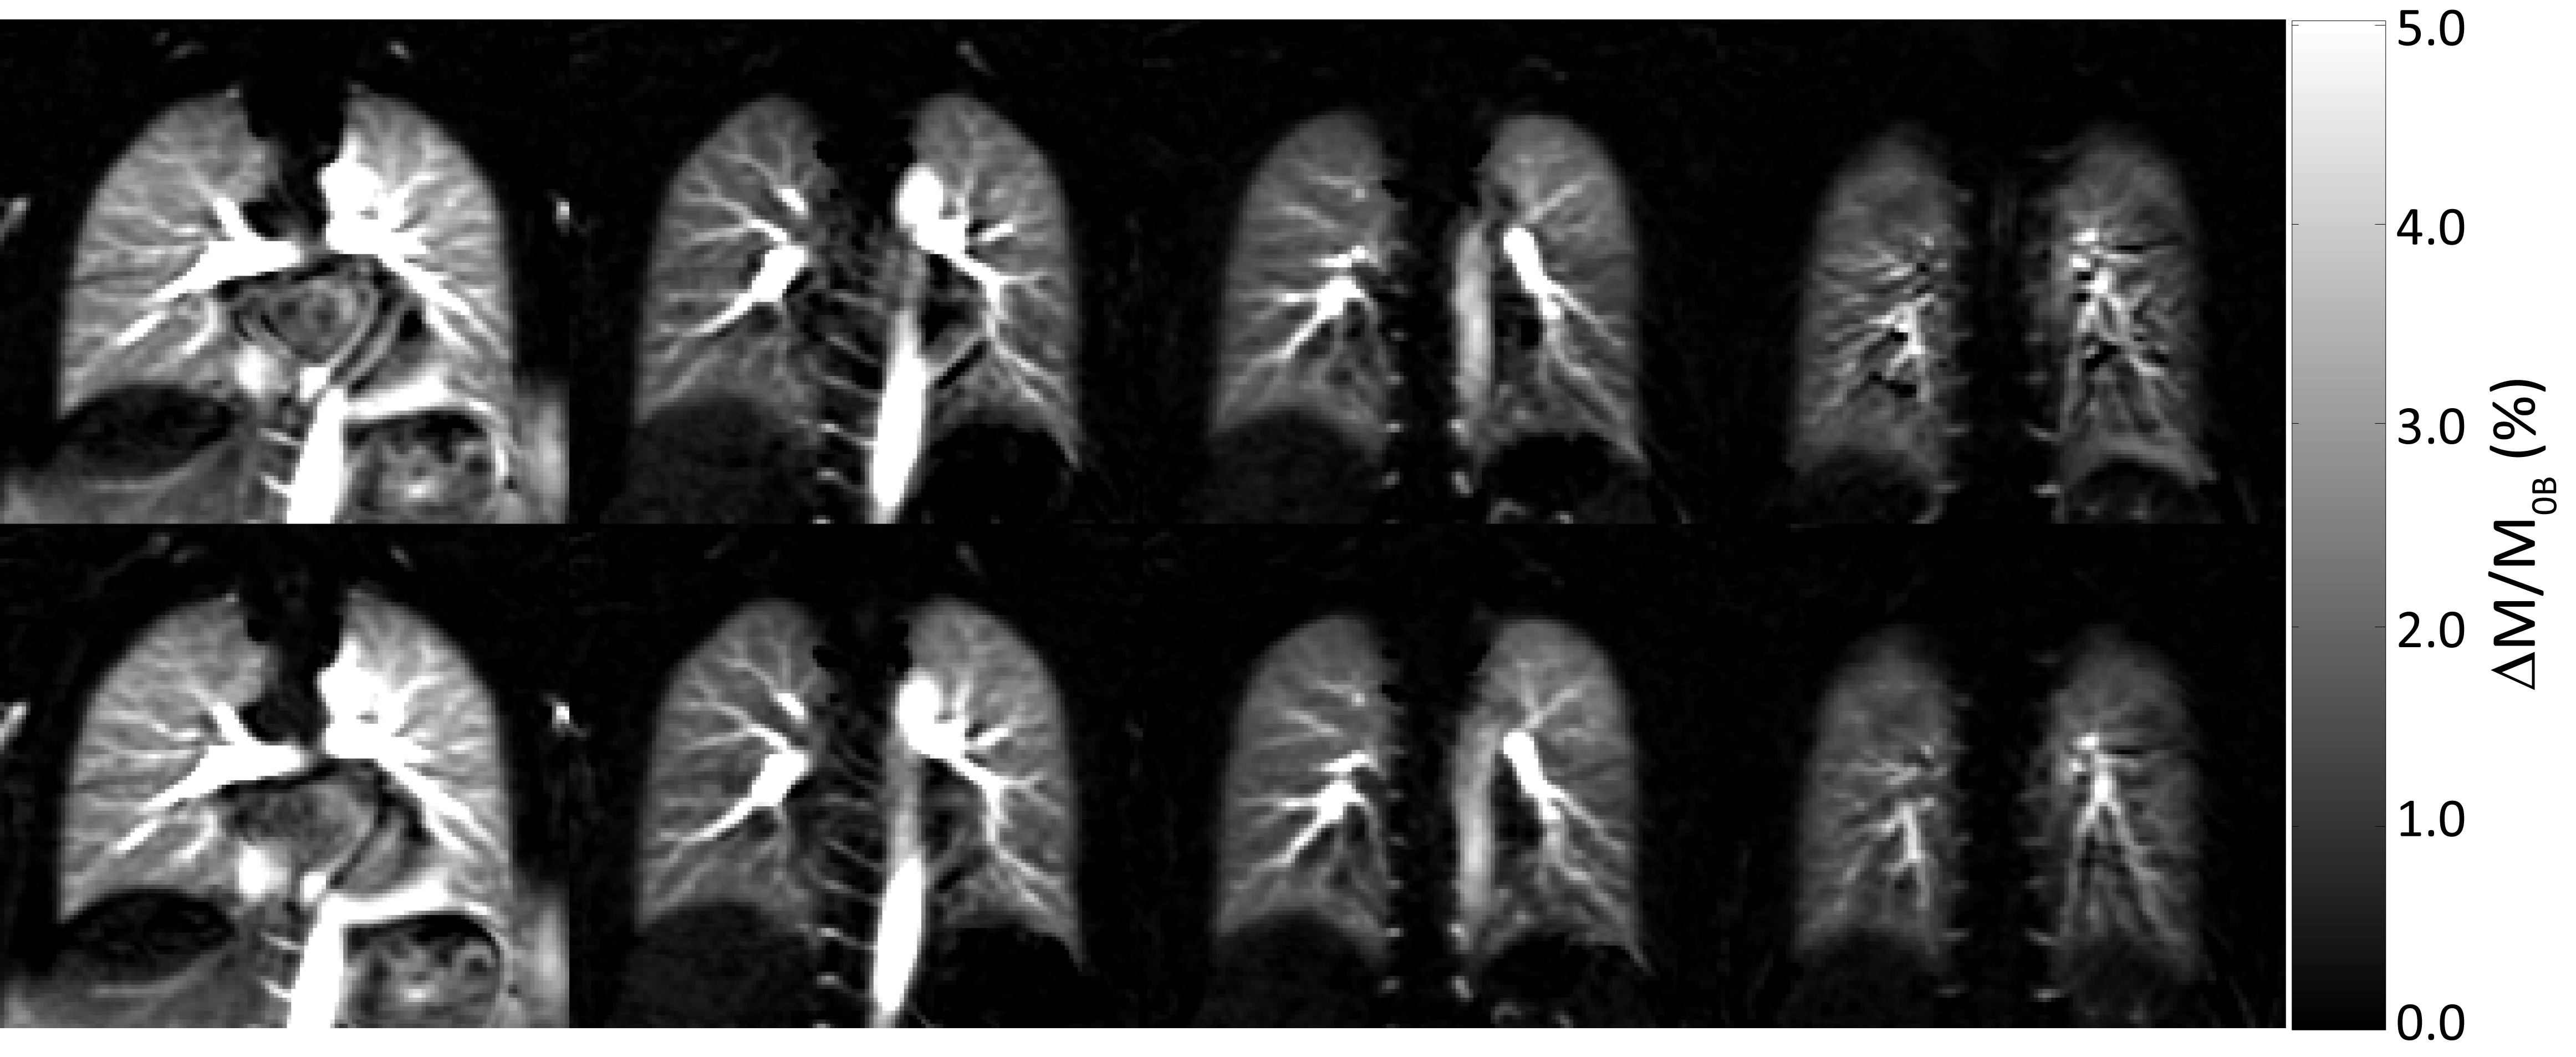
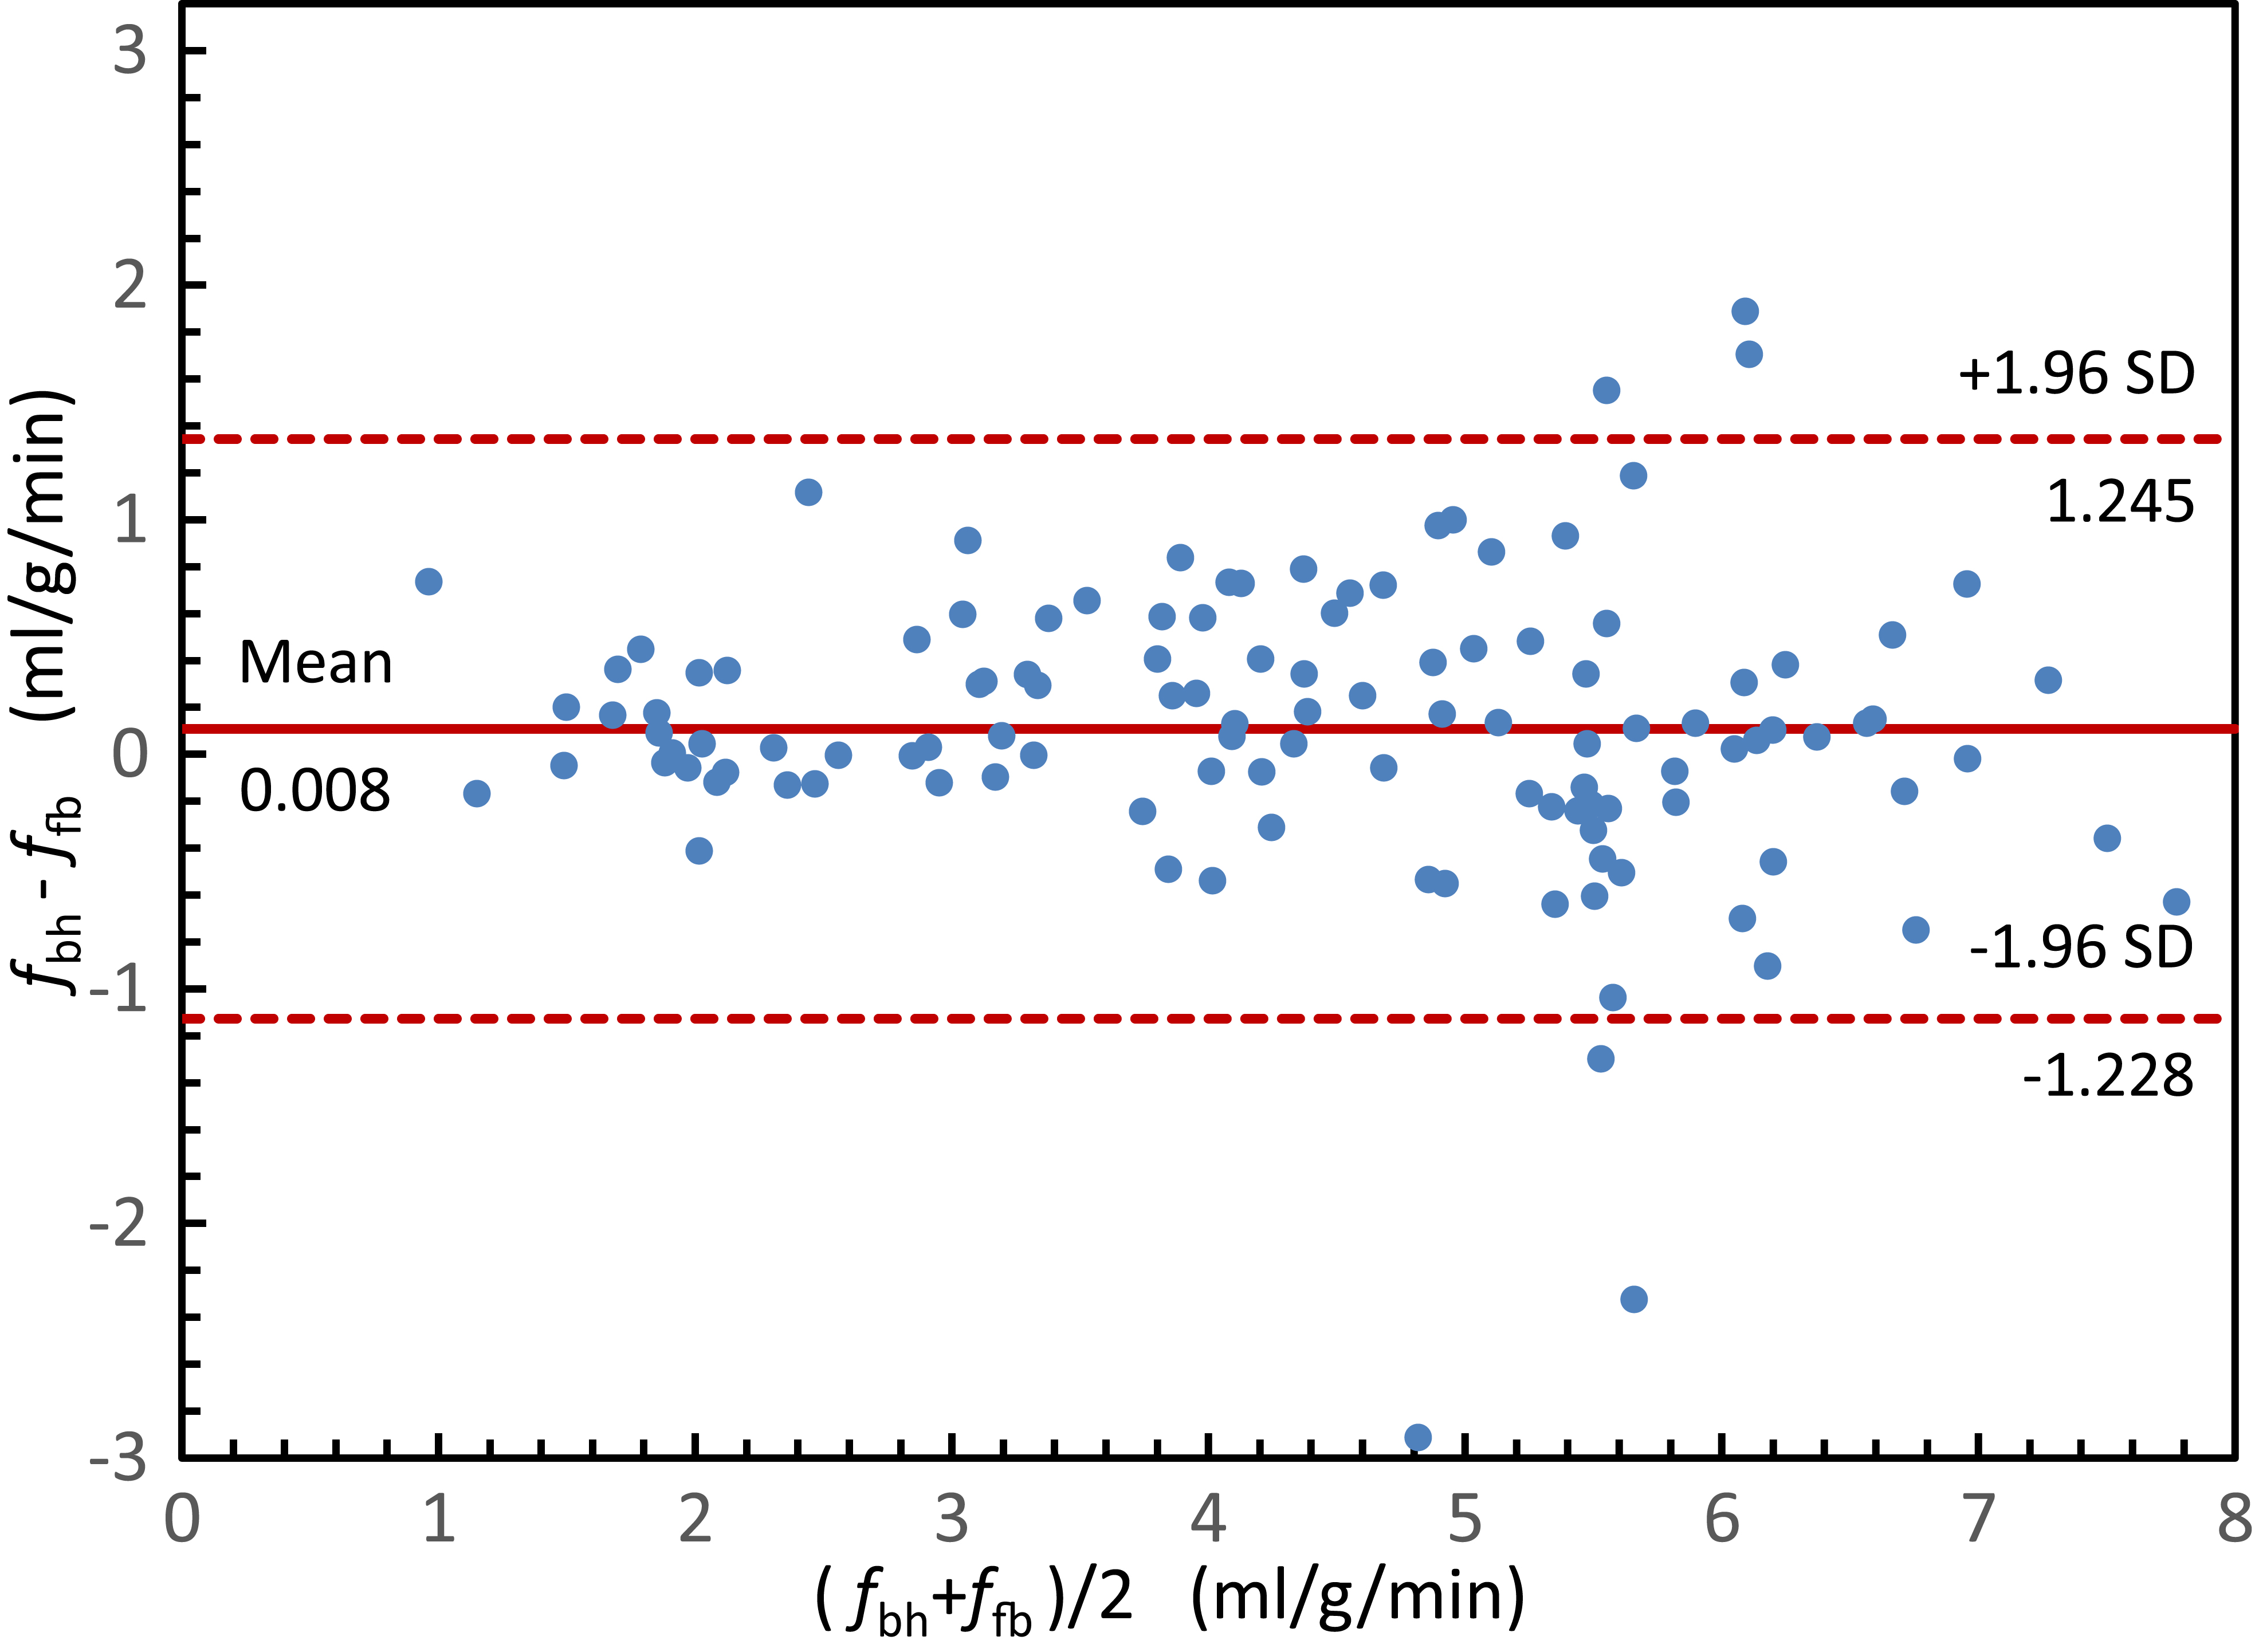
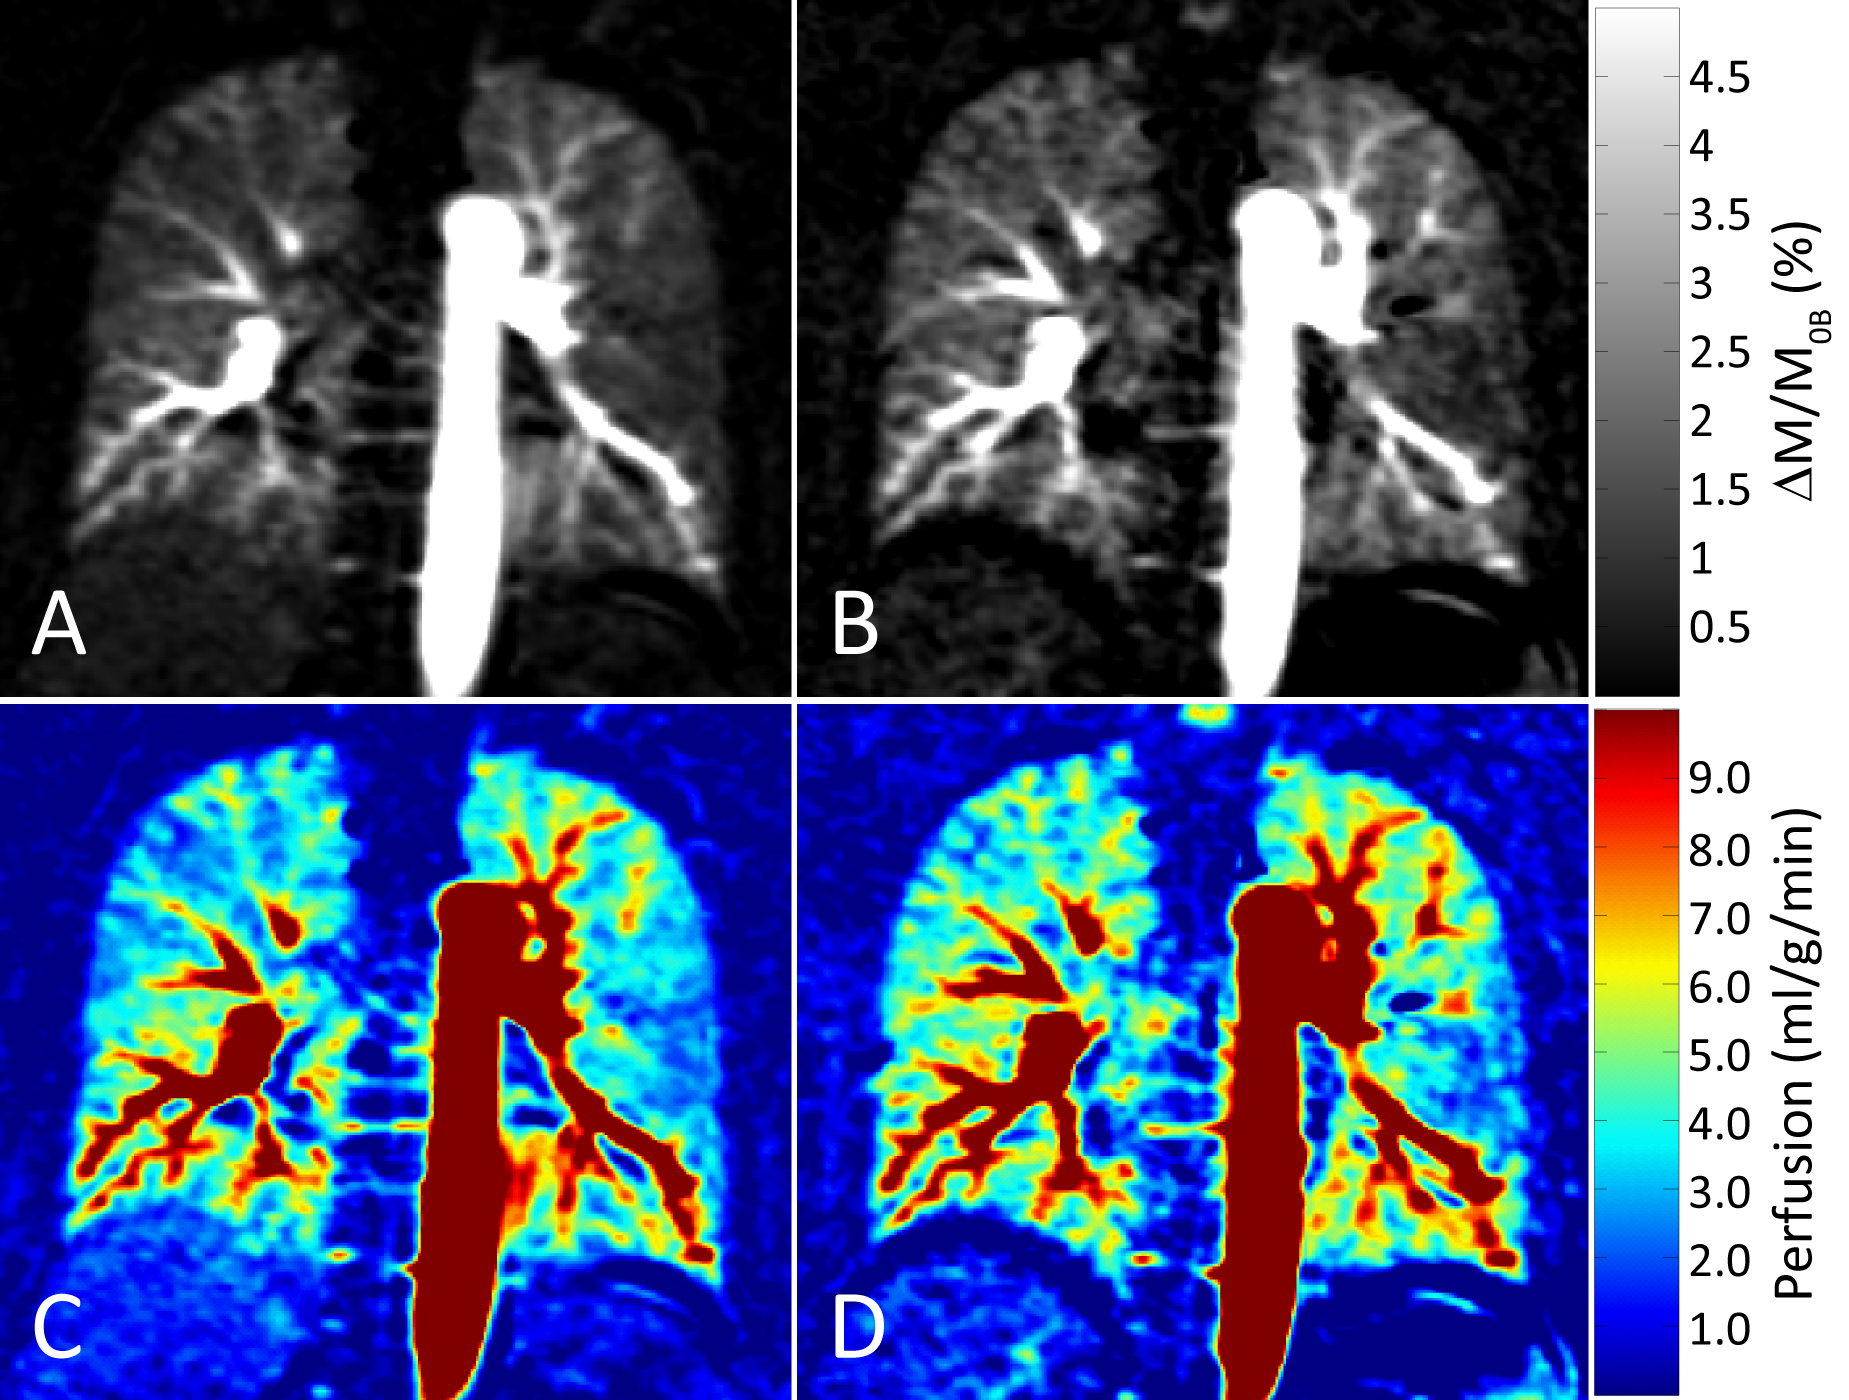
Figure 2 shows proton density, perfusion-weighted and quantitative perfusion images measured in a healthy volunteer. Perfusion-weighted image shows high signal in lung parenchyma. In Figure 3, perfusion-weighted images acquired during multiple breath-holds and free breathing measurements are shown. Both measurements reveal no significant difference in perfusion signal of the lung (p=0.98) and show comparable image quality. Results of the quantitative ROI evaluation are displayed in Figure 4. Mean perfusion values (Mean/STD/Max/Min) averaged over all subjects were 4.38/1.34/7.41/1.02 ml/g/min and 4.37/1.41/8.15/0.65 ml/g/min in multiple breath-hold and free breathing measurements, respectively. Figure 5 shows perfusion-weighted images and perfusion maps of a healthy volunteer, which are acquired in multiple and single breath-hold measurements.Discussion
The presented work demonstrates the potential of ECG-triggered PCASL-True-FISP imaging of the lung at 1.5T with high signal in lung parenchyma. The combination of the PCASL sequence with fast True-FISP imaging provides high-quality perfusion images of the lung without administration of contrast media. Furthermore, the presented work demonstrates that quantitative perfusion values measured under free breathing condition are in good agreement with those measured in breath-hold studies. This is especially beneficial for further application of PCASL-True-FISP imaging in patients.Acknowledgements
No acknowledgement found.References
1. Mai VM, Berr SS. MR perfusion imaging of pulmonary parenchyma using pulsed arterial spin labeling techniques: FAIRER and FAIR. J Magn Reson Imaging 1999;9:483–487.
2. Bolar DS et al. Quantification of Regional Pulmonary Blood Flow Using ASL-FAIRER. Magn Reson Med 2006;55:1308–1317.
3. Robson PM et al. Strategies for reducing respiratory motion artifacts in renal perfusion imaging with arterial spin labeling. Magn Reson Med 2009;61:1374–1387.
4. Alsop DC and Detre JA. Reduced transit-time sensitivity in noninvasive magnetic resonance imaging of human cerebral blood flow. J Cereb Blood Flow Metab 1996;16:1236–1249.
5. Greer JS et al. Non-contrast pulmonary perfusion using pseudo-continuous arterial spin labeling of the inferior vena cava. In Proc. Intl Soc Mag Reson Med 2015, p. 534.
6. Martirosian P et al. Measurement of lung perfusion using optimized pseudo-continuous arterial spin labeling of pulmonary arteries and fast True-FISP imaging at 3 Tesla. In Proc. Intl Soc Mag Reson Med 2017, p. 1889.
7. Bieri O. Ultra-fast steady state free precession and its application to in vivo 1H morphological and functional lung imaging at 1.5 Tesla. Mag Reson Med 2013;70:657–663.
8. Pohmann R et al. Theoretical and experimental evaluation of continuous arterial spin labeling techniques. Magn Reson Med 2010;63:438–446.
9. Buxton RB et al. A general kinetic model for quantitative perfusion imaging with arterial spin labeling. Magn Reson Med 1998;40:383–396.
Figures