2165
Blood-Brain Partition Coefficient Correction Improves Gray-White Matter Contrast in Blood Flow Measurement in Mice1Biomedical Engineering, University of Kentucky, Lexington, KY, United States, 2Magnetic Resonance Imaging and Spectroscopy Center, University of Kentucky, Lexington, KY, United States, 3Pharmacology and Nutritional Sciences, University of Kentucky, Lexington, KY, United States
Synopsis
The blood-brain partition coefficient (BBPC) is a tissue-specific parameter important in quantifying cerebral blood flow (CBF), but regional differences in BBPC are commonly ignored. Using an accelerated calibrated proton density imaging technique we measure BBPC directly, enabling a voxel-wise correction of CBF maps derived from arterial spin labeling acquisitions. We measure an elevated BBPC in the cortex (0.99mL/g) relative to the corpus callosum (0.93mL/g) and the hippocampus (0.95mL/g), and demonstrate that BBPC-correction improves gray-white matter contrast in CBF maps by 15% in the cortex and 7% in the hippocampus.
Introduction:
The blood-brain partition coefficient (BBPC) is an important parameter in the quantification of cerebral blood flow (CBF) as measured by arterial spin labeling (ASL) acquisitions. While this tissue-specific parameter is known to vary with age and brain region, particularly in gray vs white matter, the current consensus in the field of ASL is to assume a single constant value of 0.9mL/g for all regions and all subjects.1 In this study we use an accelerated calibrated proton density (ACPD) imaging technique2,3 to measure the BBPC directly, thus enabling a voxel-wise correction for BBPC when quantifying CBF. We then compare the BBPC-corrected CBF maps to standard maps calculated using the assumed constant value to test the hypothesis that BBPC-correction will increase the quality of quantitative CBF images.Methods:
Imaging Protocol- Male C57Bl/N mice aged 12 months (n=8) were imaged
using a 7T Bruker ClinScan (Bruker Biospin, Ettlingen, Germany) to acquire both
ACPD images and pseudo-continuous ASL images. The ACPD images were acquired with a 39mm
birdcage transmit/receive coil and the pCASL images were acquired with a
four-channel phased-array surface receive coil without disturbing the position
of the mouse by means of a custom bed and nose cone. For the ACPD images a
series of phantoms with 0, 10, 20, 30, and 40% deuterium oxide in distilled
water and doped with gadobutrol (Gadavist, Bayer
Healthcare Pharmaceuticals, Whippany NJ, USA, 0.07mM), along with a blood-sample
obtained from the facial vein of the mouse were placed inside the volume coil.
A series of image stacks were acquired with a phase-spoiled, FLASH-GRE sequence
(FOV= 2.8cmx2.8cm, matrix= 256x256, slice thickness= 1mm, number of slices= 10,
flip angle= 90°) with a very short TE (3.2ms) and 6 different TR values (125,
187, 250, 500, 1000, 2000ms). The pCASL images were acquired with FOV= 1.8cmx1.3cm,
matrix= 128x96, slice-thickness= 1mm, number of slices= 6, TE/TR= 20/4000ms,
label duration= 1.6s, post-label delay= 0s, averages= 120.
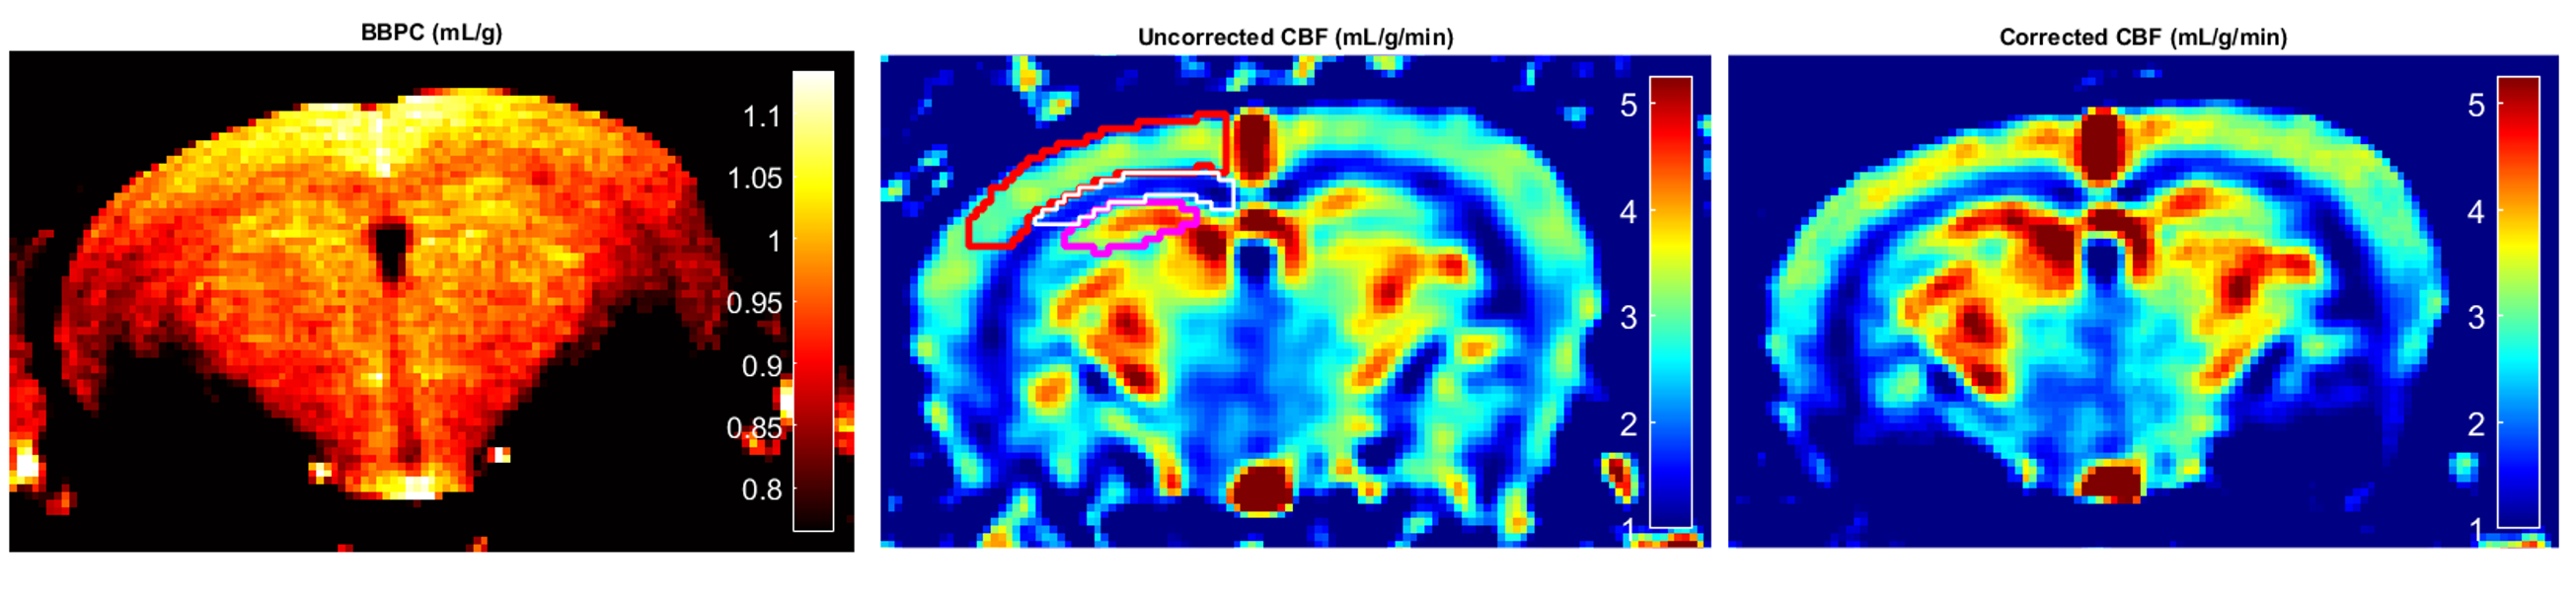
Image Analysis- The centermost 2 slices containing the hippocampus were selected for analysis. The brain regions of the ACPD and pCASL images were isolated independently using an automated skull-stripping algorithm and then coregistered. The BBPC map was then calculated voxel-wise by fitting the ACPD series to the mono-exponential recovery curve S= M0*[1-e^(TR/T1)] to yield a map of M0, normalizing to the phantom series, and finally using the equation BBPC= M0,brain/(M0,blood *1.04g/mL).2,3 Quantitative CBF maps were calculated from the pCASL images according to the equation1
$$CBF(mL/g/min)=\frac{60*BBPC*e^{(PLD/T_{1,blood})}}{2*\alpha*[1-e^{(LD/T_{1,blood})}]}*\frac{Ctl-Lbl}{M_0}$$
where PLD is post-label delay, LD is label duration, T1,blood is the longitudinal relaxation of blood (2.2s at 7T), and α is label efficiency (0.85). For standard CBF maps the BBPC was assumed to be a constant 0.9mL/g while the corrected maps used the measured BBPC maps to calculate CBF. Regions of interest encompassing the motor and sensory cortex, corpus callosum, and hippocampus were drawn manually on each analyzed slice. BBPC, uncorrected CBF, and corrected CBF values were averaged for each region of interest. Gray-white contrast was determined for each slice as the difference of average CBF values in gray and white matter regions of interest. All analysis was performed with self-written scripts in Matlab (Mathworks, Natick, MA, USA).
Results:
BBPC maps demonstrate significantly elevated BBPC in the cortical region (µCtx= 0.99±0.04mL/g) relative to the corpus callosum (µCC= 0.93±0.05mL/g, p = 0.008) and the hippocampus (µHc= 0.95±0.04mL/g, p= 0.057) (see Figs. 1&2). The corpus callosum always displayed lower CBF (µuncorrected= 1.44±0.3mL/g/min, µcorrected= 1.51±0.4mL/g/min), than the cortex (µuncorrected= 2.81±0.4mL/g/min, µcorrected= 3.09±0.5mL/g/min, p<0.001) and the hippocampus (µuncorrected= 2.90±0.6mL/g/min, µcorrected= 3.07±0.7mL/g/min, p<0.001) (see Fig. 3), however the uncorrected CBF maps underestimated blood flow in the cortex by 9.3% (95% CI= 5.6-12.9%), the corpus callosum by 4.9% (95% CI= 1.1-8.6%), and the hippocampus by 6.0% (95% CI= 2.5-9.5%) compared to the corrected CBF (see Fig.4). Correcting for regional differences in BBPC thus improves gray-white matter contrast by 15.1% in the cortex (95% CI= 10.1-20.1%) and 7.0% in the hippocampus (95% CI= 2.4%-11.7%).Discussion:
In this study we measure significant regional differences in the BBPC of mice. These regional differences translate to errors in CBF quantification when using a global, constant value as is currently the standard in ASL imaging. Those errors are particularly important when studying white matter pathologies in diseases such as multiple sclerosis, leukoaraiosis, and Alzheimer’s disease as the gray-white matter contrast can be reduced by as much as 15% by failing to account for the reduced BBPC of white matter relative to gray.Acknowledgements
ST is supported by the F. Joseph Halcomb III, M.D. Fellowship for Engineering and Medicine
AL is supported by NIH Grant #RO1AG054459
References
(1) Alsop DC, Detre JA, Golay X, Gunther M, Hendrikse J, Hernandez-Garcia L, Lu H, MacIntosh BJ, Parkes LM, Smits M, van Osch MJ, Wang DJ, Wong EC and Zaharchuk G. Recommended implementation of arterial spin-labeled perfusion MRI for clinical applications: A consensus of the ISMRM perfusion study group and the European consortium for ASL in dementia. Magn Reson Med. 2015;73:102-16.
(2) Leithner C, Muller S, Fuchtemeier M, Lindauer U, Dirnagl U and Royl G. Determination of the brain-blood partition coefficient for water in mice using MRI. J Cereb Blood Flow Metab. 2010;30:1821-4.
(3) Thalman SW, Powell DK, Shen A, Hartz A, and Lin AL. Using Calibrated Proton Density Imaging to Measure Blood-Brain Partition Coefficient in Aging and Alzheimer's Disease Mice. Proc. ISMRM 2017;2349
Figures