2164
Patch based low rank and sparse decomposition for arterial spin labeling perfusion MRI signal denoising1Department of Mathematics, Shaoxing University, Shaoxing, China, 2Institutes of Psychological Science, Hangzhou Normal University, Hangzhou, China, 3Department of Radiology, Temple University, Philadelphia, PA, United States
Synopsis
Arterial spin labeling (ASL) perfusion fMRI has much less neurovascular effects than BOLD fMRI, but its application in time-series analysis is still depreciated due to the low signal-to-noise-ratio (SNR). In this study, we propose a patch based low rank and sparse decomposition method to denoise ASL MRI. Our results showed that the proposed method can markedly increase the sensitivity of ASL MRI-based task activation detection.
Introduction
The application of arterial spin labeling (ASL) perfusion MRI in dynamic brain activity study is still hampered by the relatively low signal-to-noise-ratio (SNR) of ASL data 1. We have previously proposed a low rank and sparse decomposition (L+S) based method for ASL data denoising 2. A potential problem of LS-ASLd is that the sparse component, which is treated as noise, is defined across all voxels and may actually contain signal of local interest and is not sparse in a local neighborhood. To solve this problem, this study proposed a patch-based LS decomposition and used it in ASL data denoising (pLS-ASLd).Methods
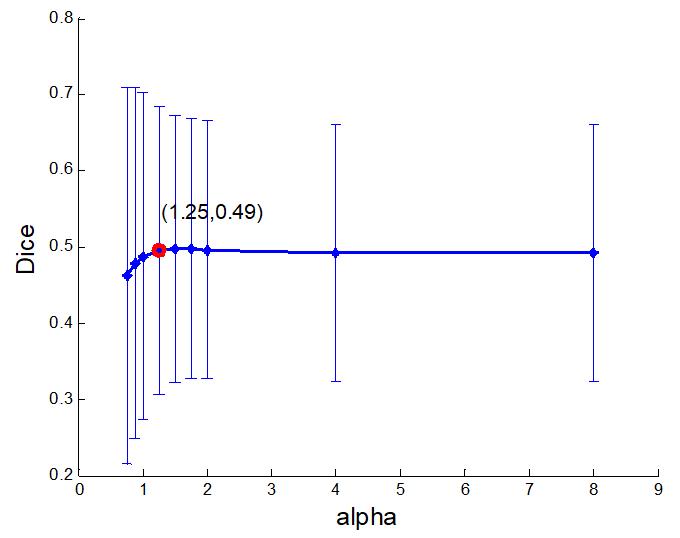
Sensorimotor task ASL fMRI data were acquired from 13 young healthy subjects with signed written consent forms approved by local IRB. An amplitude modulated continuous ASL sequence was used with parameters of: labeling time =1.6 s, post-labeling delay = 800 ms, FOV=22x22 cm2, matrix=64x64, bandwidth=3kHz/pixel, flip angle=90o, TR=3s, TE=17ms, 12 slices with a slice thickness of 7 mm and an inter-slice gap of 1.25 mm. The scan duration was 7.2 min. Subjects were asked to perform a self-paced right hand fingertapping task when they saw the visual stimuli on the screen. The stimuli consisted of 3 task blocks interleaved with a grey screen no-task baseline block. Each block lasted for 1.2 min and the visual stimuli during the task blocks were a series of reversing black and white checkerboard flashing in a frequency of 8Hz. ASL images were preprocessed using ASLtbx with state-of-art denoising procedures 3,4. A patch of ASL CBF map at each timepoint was extracted and reformatted into a column vector in the composite data matrix $$$M$$$, which was subsequently decomposed into a low-rank part and a sparse part using the L+S decomposition model 5:$$min_{L,S}\| L \|_* + \lambda \| S \|_1,\quad s.t. ~ M=L+S$$where $$$\| \|_*$$$ denotes the nuclear norm of a matrix, $$$\|\|_1$$$ denotes the sum of the absolute values of matrix entries, and $$$\lambda$$$ is a positive weighting parameter. By solving the model, the resulting column vectors of the low-rank part were reformatted back to 3-dimensional image patches in the original CBF image space and summed up with all other denoised patches. Using the CBF images denoised by CompCor 6, LS-ASLd 2, or pLS-ASLd, a general linear model was used to fit the CBF time series at each voxel to the boxcar fMRI task design function convolved with the canonical hemodynamic response function (HRF). A statistical contrast between the sensorimotor task condition and rest condition was then performed to extract the task vs rest brain activity difference. The corresponding contrast maps were spatially registered into the MNI space and then compared at each voxel across all subjects using one-sample t-test. The resultant group level statistical results were thresholded with a p<0.001 (uncorrected) and a cluster size>100. The parameter $$$\lambda$$$ in the model is set to be $$$\alpha m^{-1/2}$$$, where $$$m$$$ is the row dimension of the data matrix $$$M$$$, $$$\alpha$$$ is tuned with the following strategy. Since the label and control ASL images were acquired one TR apart, they should be able to identify similar sensorimotor task activation patterns after correcting the timing difference using interpolation. With temporal denoising, the overlap ratio between their sensorimotor task activation patterns should become bigger and stay at a certain level without much significant variations after a turning point. That turning point can be taken as a surrogate “optimal” point for determining the optimal value of $$$\alpha$$$.Results
Fig. 1 shows the curve of $$$\alpha$$$ vs the overlap ratio (Dice value) of the
activation patterns identified with the label and control image separately. The
curve tells that an optimal value of $$$\alpha$$$ is between 1.25 to
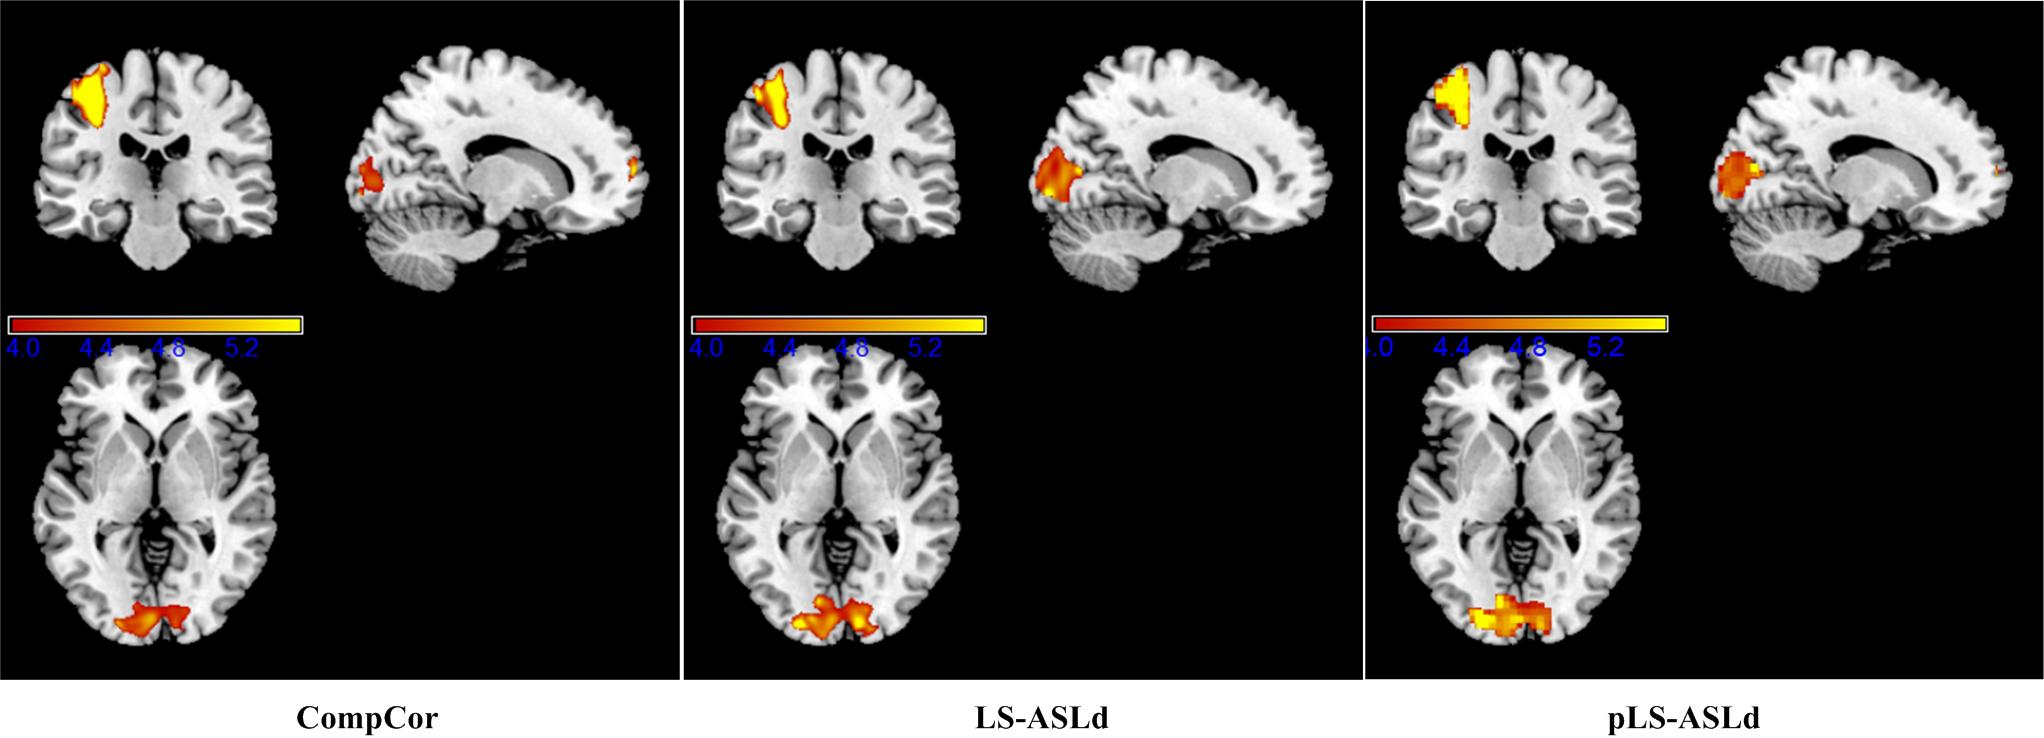
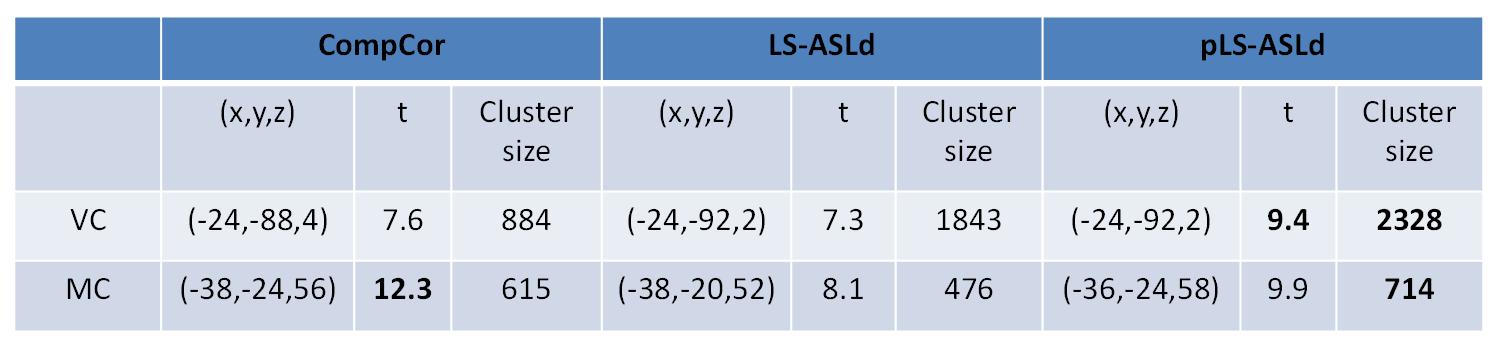
1.75. Using 1.25 (other values in the range produced similar results), two major sensorimotor task activation clusters were
detected (Table 1 and Fig. 2). As compared to CompCor, LS-ASLd yielded larger
suprathreshold cluster in visual cortex (VC) but not in motor cortex (MC). pLS-ASLd
however produced larger suprathreshold clusters in both VC and MC.
Discussion and conclusion
Patch-based LS helped reserving locally non-sparse signal and improved performance of LS-ASLd in ASL fMRI studies.Acknowledgements
Work supported by Natural Science Foundation of Zhejiang Province Grant LZ15H180001, the Youth 1000 Talent Program of China, and Hangzhou Qianjiang Endowed Professor Program, National Natural Science Foundation of China (Nos. 61602307, 61671198).References
1. Detre, J.A., et al., Perfusion imaging. Magnetic Resonance in Medicine, 1992. 23(1): 37-45.
2. Wang, Z., Improving ASL Perfusion MRI-based Functional Connectivity Analysis with Robust Principal Component Analysis, in Annual Meeting of ISMRM2016: Singapore. 2873.
3. Wang, Z., et al., Empirical optimization of ASL data analysis using an ASL data processing toolbox: ASLtbx. Magnetic Resonance Imaging, 2008. 26(2): 261-269, PMC2268990.
4. Wang, Z., Improving Cerebral Blood Flow Quantification for Arterial Spin Labeled Perfusion MRI by Removing Residual Motion Artifacts and Global Signal Fluctuations. Magnetic Resonance Imaging, 2012. 30(10): 1409-15.
5. Candès, E.J., et al., Robust principal component analysis? Journal of the ACM (JACM), 2011. 58(3): 11.
6. Behzadi, Y., et al., A component based noise correction method (CompCor) for BOLD and perfusion based fMRI. Neuroimage, 2007. 37(1): 90-101.
Figures