2159
Reproducibility and repeatability of 3D-GraSE and 2D-EPI ASL on 1.5T and 3T systems in healthy elderly1BIU MR, Philips, Best, Netherlands, 2VUmc, Amsterdam, Netherlands, 3Kate Gleason College of Engineering, Rochester Institute of Technology (RIT), Rochester, NY, United States
Synopsis
We present the results of a reproducibility and repeatability study in 34 healthy elderly scanned on 1.5T and 3T systems employing pCASL with a 3D-GraSE and 2D-EPI read-out. Best repeatability and reproducibility were achieved when using 3D-GraSE readout on 3T systems leading to an average repeatability and reproducibility of GM CBF of 2.7% ± 1.8% and 2.9% ± 3.5% respectively. The repeatability and reproducibility of 2D read-out and of comparisons at 1.5T and 1.5T versus 3T were slightly lower. These results imply that 3D-GraSE pCASL at 3T should be preferred in multi-center trials as well as for clinical imaging.
Introduction
The recent publication of a consensus paper with guidelines for Arterial Spin Labeling (ASL) perfusion mapping1 aims to enable the use of ASL as a clinical tool. To encourage further clinical adoption, assessment of repeatability (intrasession) and reproducibility (intersession) is crucial. The aim of this study is to assess system-induced − rather than physiology-induced − variability. This can currently only be assessed on a group of volunteers, given the lack of a validated perfusion phantom. Here, repeatability is defined as scanning a volunteer twice without repositioning and reproducibility as repeating the same scan protocol after an hour on the same or another field strength.Methods
Subjects: Thirty-four healthy control subjects (20 male) with a mean age 57.8±17.0yrs were scanned twice within two hours. Eight subjects were scanned twice on 1.5T systems (Philips IngeniaCx and Ingenia), twelve on 1.5T and 3T (IngeniaCx and Ingenia) in randomized order, fourteen were scanned twice on 3T systems (Achieva, IngeniaCx and Ingenia).
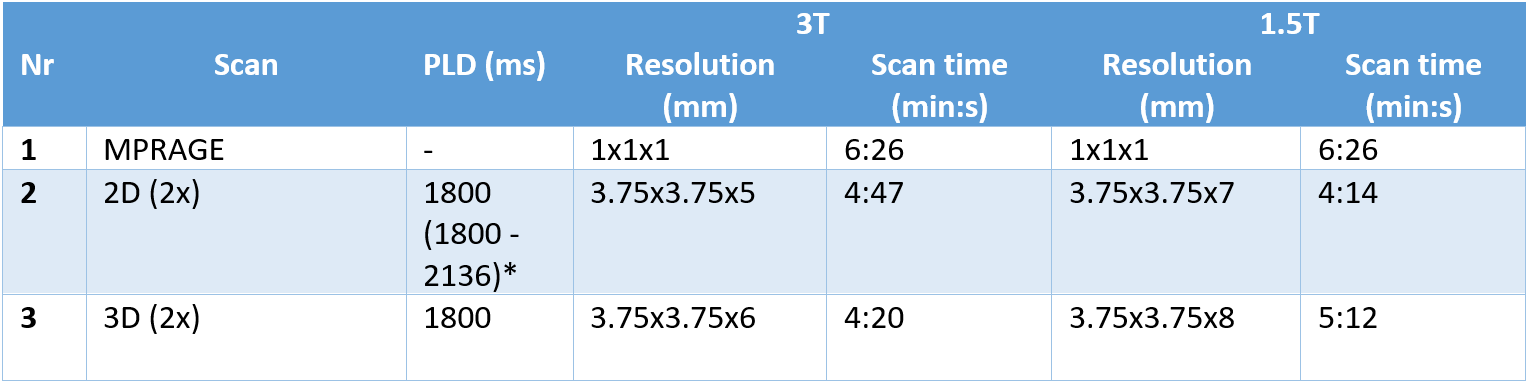
Image acquisition &
post-processing: each session started
with a 3D T1-weighted-MPRAGE scan followed
by two identical pCASL scans with a 2D-EPI readout and two identical pCASL scans with a 3D-GraSE read-out in an interleaved fashion
(5-minute gap between identical scans) for repeatability assessment. This
protocol was repeated after one hour and the first scans of both sessions were
used for reproducibility. All ASL scans were acquired and quantified according to the recent consensus review1 applying pCASL labeling, 4-pulse background
suppression and an integrated M0 scan for quantification with a single-compartment model. Protocol
settings for
each scan can be found in Table 1.
Further
image-processing was performed using ExploreASL2. T1-MPRAGE and ASL scans were registered to MNI-space followed by
probability-based segmentation of the T1-MPRAGE in gray matter (GM), white
matter and cerebrospinal fluid, followed by calculation of average GM-CBF
including voxels with >70% GM content.
Statistical analysis: repeatability and reproducibility were assessed using Bland-Altman plots3 and the coefficient of variability (CV) was calculated as a parameter of variation between the repeated measurements.
$$CV = SD/Mean*100%$$Independent t-tests and ANOVA tests were performed to test for significant differences in CV values between different field strengths and scan types.
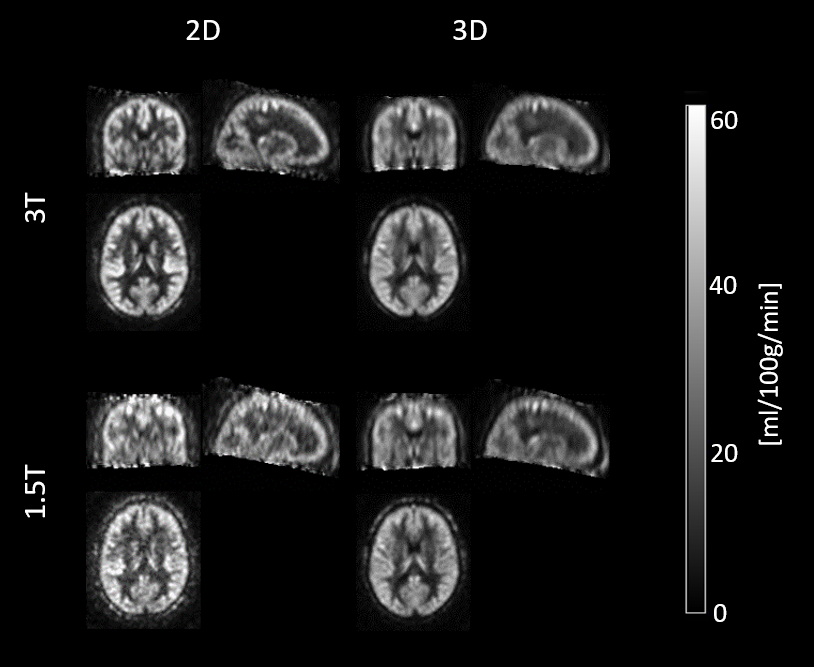
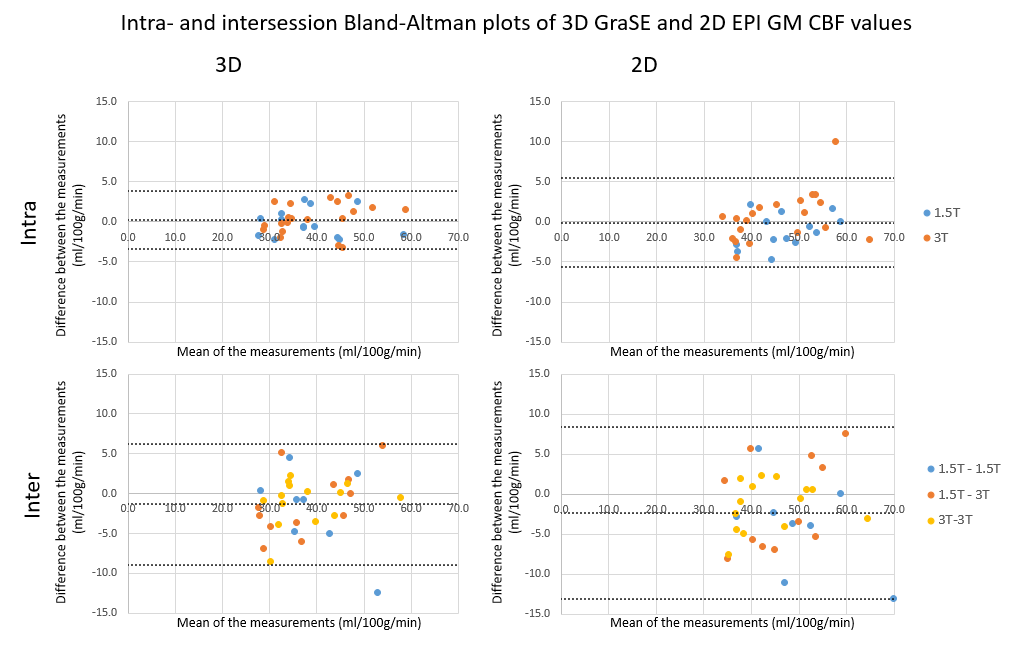
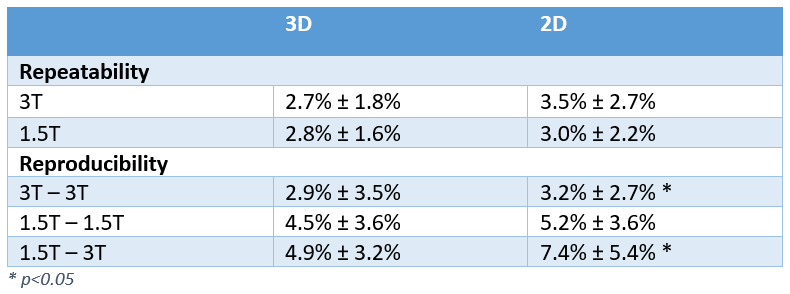
Results
The average axial, coronal and sagittal ASL scans of all volunteers are shown per scan type and field strength in Figure 1. The intra- and intersession Bland-Altman plots are shown in Figure 2 – for the intra-session repeatability the bias was close to zero, while there was a negative bias between the two sessions (p=0.055 for 3D and p=0.017 for 2D). The average inter- and intrasession CV are shown per field strength in Table 2. Statistical testing of the CV did not reveal significant differences between 2D and 3D readouts. Only the intersession CV values of 3T-3T and 1.5T-3T using the 2D readout resulted in a significant difference (p<0.05).Discussion
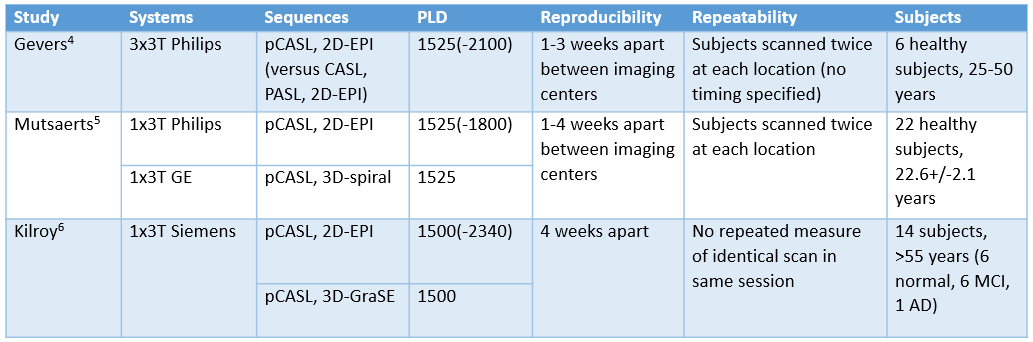
Without a phantom that mimics perfusion and perfusion in the brain being a dynamically changing process, it is challenging to differentiate between instrumental and physiological sources of variance in the repeatability and reproducibility in perfusion imaging. Previous studies have performed similar measurements with pCASL, focusing on 3T, different read-outs and reproducibility after 1-4 weeks4,5,6. Most studies are limited because they use small amounts of subjects and/or young, healthy subjects which are known to have high perfusion (see Table 3). Here, in a larger group of older subjects, we show good repeatability and reproducibility results at both 3T and 1.5T. The negative bias in the Bland-Altman plots can be explained by the larger contribution of physiological perfusion variability between sessions than within sessions. We hypothesize that CBF is lower in the second session because the volunteers are more relaxed. It can be observed that 3D read-outs at 3T give best results in terms of repeatability, while 2D-acquisitions and 1.5T show larger variations, however, no significant differences were found between read-outs or field strengths. Comparing reproducibility, 3D scans show a stable standard deviation over the different combinations of field strengths, while the 2D scan becomes less reliable moving from duplicating at 3T, 1.5T and between 1.5T and 3T. These findings imply that most reliable results can be achieved using 3D-GraSE pCASL at 3T.Conclusion
The results of this study show good intrasession repeatability and intersession reproducibility of 2D-EPI and 3D-GraSE pCASL scans on both 1.5T and 3T systems, confirming that field strength and readout type have a low impact on repeatability and reproducibility of the pCASL sequence. Our observation that the 3D scans showed best repeatability and reproducibility at 3T is in line with the consensus paper’s1 advice to perform pCASL at 3T.Acknowledgements
No acknowledgement found.References
1. Alsop, D.C., et al., Recommended implementation of arterial spin-labeled perfusion MRI for clinical applications: A consensus of the ISMRM perfusion study group and the European consortium for ASL in dementia. Magn Reson Med, 2015. 73(1): p. 102-16.
2. Mutsaerts, H., et al. Addressing multi-centre image registration of 3T arterial spin labeling images from the GENetic Frontotemporal dementia Initiative (GENFI). ISMRM 24th Annual Meeting and Exhibition, 2016.
3. Bland, J.M. and D.G. Altman, Statistical methods for assessing agreement between two methods of clinical measurement. The Lancet, 1986: p. 307-310.
4. Gevers, S., et al. Intra-and multicenter reproducibility of pulsed, continuous and pseudo-continuous arterial spin labeling methods for measuring cerebral perfusion. Journal of Cerebral Blood Flow & Metabolism 31.8 (2011): 1706-1715.
5. Mutsaerts, H., et al. Inter-vendor reproducibility of pseudo-continuous arterial spin labeling at 3 tesla. PLoS One 9.8 (2014): e104108.
6. Kilroy, E., et al. Reliability of two‐dimensional and three‐dimensional pseudo‐continuous arterial spin labeling perfusion MRI in elderly populations: Comparison with 15o‐water positron emission tomography. Journal of Magnetic Resonance Imaging 39.4 (2014): 931-939.
Figures