2158
Comparing pCASL CBF measurements between 3D-GraSE and 2D-EPI on 1.5T and 3T systems1BIU MR, Philips, Best, Netherlands, 2VUmc, Amsterdam, Netherlands, 3Kate Gleason College of Engineering, Rochester Institute of Technology (RIT), Rochester, NY, United States, 4PET Center, Institute of Radiopharmaceutical Cancer Research, Helmholtz-Zentrum Dresden-Rossendorf, Dresden, Germany
Synopsis
We have compared CBF value agreement in healthy subjects across two readouts, 3D-GraSE and 2D-EPI, and two field strengths, 1.5T and 3T, and investigated with which acquisition parameters we can reach the best agreement. Significantly higher GM CBF was observed with the 2D-EPI readout compared to the 3D-GraSE readout with equivalent acquisition voxel size (p < 0.005 for 1.5T and p < 0.05 for 3T). Better agreement was observed between 3D-GraSE and 2D-EPI on 3T systems when the resolution of the 3D-GraSE readout was increased to match the effective resolution to the 2D-EPI scan (ICC = 0.772 and ICC = 0.932 respectively).
Introduction
Arterial spin labeling (ASL) is becoming a more popular diagnostic tool and is increasingly being used in large multi-center studies that use different scanners with different pCASL sequences. It is of highest importance to make the CBF measurements comparable across different centers. Here, we present a comparison of CBF measured in healthy volunteers with two different readouts at 1.5T and 3T and show how the post label delay (PLD) and spatial resolution can be adjusted to improve the between-sequence CBF agreement.Methods
Subjects: Thirty-four healthy subjects (20 male, age 57.8±17.0yrs) were included. Fourteen subjects were scanned on Philips 1.5T (Ingenia n=8, IngeniaCx n=6) and 20 on 3T (Ingenia n=6, IngeniaCx n=12, Achieva n=2) systems.
Image acquisition & post-processing: a T1w-MPRAGE scan was followed by 5 pCASL scans – one 2D-EPI and four 3D-GraSE read-outs, three with different post-label delays (PLD) and the same voxel size as the 2D-EPI sequence and one with a higher resolution (HR), see Table 1. All sequences were implemented according to the ASL consensus paper1: pCASL labeling, 4 background suppression pulses and an integrated M0 scan for quantification with a single-compartment model. Post-processing was performed using ExploreASL2 , including registration of the T1-MPRAGE and all pCASL scans to MNI space, segmentation of the T1-MPRAGE in gray matter (GM), white matter (WM) and cerebrospinal fluid (CSF). Mean GM CBF was calculated for voxels with >70% GM tissue content. Partial volume correction (PVC) was also performed on GM maps adjusted to the effective resolution to correct for both GM and WM CBF mixing and for differences in effective resolution.
Statistical analysis: the agreement between the CBF of the different ASL scans was expressed as intraclass correlation coefficient (ICC), calculated in SPSS. The two-way mixed single rater ICC model was used3. Independent samples t-tests and ANOVA tests were performed to test for statistically significant differences in CBF between field strength, readout type and bore size.
Results
The averaged perfusion maps of all volunteers per scan type and field strength are visualized in Figure 1. The corresponding GM CBF values without and with PVC are visualized in Figure 2. Figure 2a) compares 3D-GraSE scans with different PLDs. There was a trend of CBF correlation with PLD, and significant differences between PLD1600ms and PLD2000ms without PVC at 3T and with PVC at 1.5T. Figure 2b) compares different read-outs with a PLD of 1800ms - significant differences between readouts are corrected for by PVC. In all cases, PVC provides significantly higher GM CBF values (~40 vs ~60 ml/100g/min).
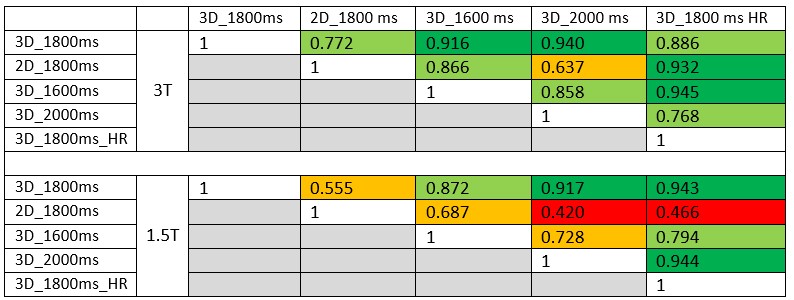
ICC coefficients of GM CBF without PVC for the different protocols at 1.5T and 3T are shown in Table 2. Except for one combination, the protocols at 3T all show good or excellent correlation, while at 1.5T the CBF results of several protocols do not agree. Most importantly, at 3T the 3D-HR protocol CBF correlated well with the 2D-EPI protocol.
No significant differences in CBF values were found between different field strengths or bore sizes.
Discussion
Differences in CBF between the 3D scans with different PLDs can be explained by the fact that the single compartment model does only account for the T1-decay of spins in blood, while two-compartment models also include the T1-decay in tissue.
The ICC analysis in this study shows that it is possible to compare CBF results of slightly different protocols before PVC. At 1.5T there is sufficient agreement between 3D protocols, but the 2D-EPI protocol does not correlate well with the 3D scans. At 3T the 3D high-resolution (3D_1800ms_HR) protocol has excellent agreement with the 2D-EPI (2D_1800ms) protocol. This confirms the recommendation of the ASL consensus review to preferably perform pCASL at 3T.
Conclusion
This study shows that different pCASL protocols can be compared at 3T. Especially the 2D-EPI (2D_1800ms) and the high-resolution 3D protocol (3D_1800ms_HR) show good correlations in terms of image quality and quantification, indicating that with careful protocol optimization it is possible to obtain equivalent results with different read-outs.Acknowledgements
No acknowledgement found.References
1. Alsop, D.C., et al., Recommended implementation of arterial spin-labeled perfusion MRI for clinical applications: A consensus of the ISMRM perfusion study group and the European consortium for ASL in dementia. Magn Reson Med, 2015. 73(1): p. 102-16.
2. Mutsaerts, H., et al. Comparison of arterial spin labeling registration strategies in the multi-center GENetic frontotemporal dementia initiative (GENFI). Journal of Magnetic Resonance Imaging: JMRI, 2017 https://doi.org/10.1002/jmri.25751
3. Bland, J.M. and D.G. Altman, A note on the use of the intraclass correlation coefficient in the evaluation of agreement between two methods of measurement. Computers in biology and medicine 20.5 (1990): 337-340.
Figures
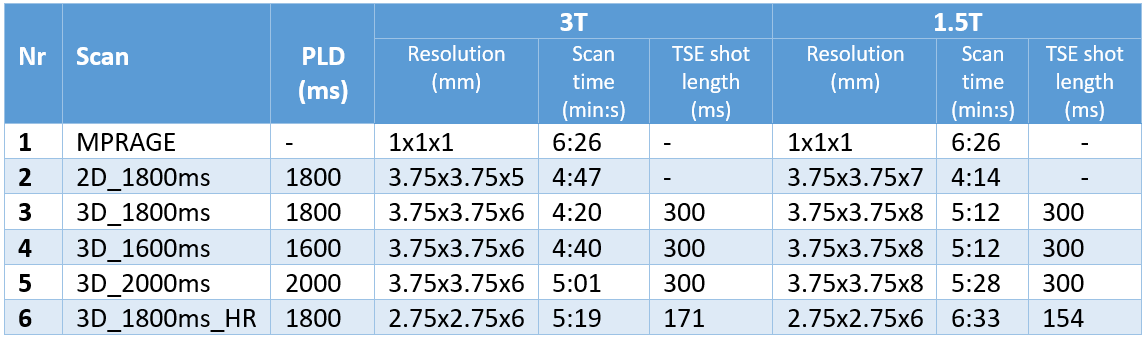
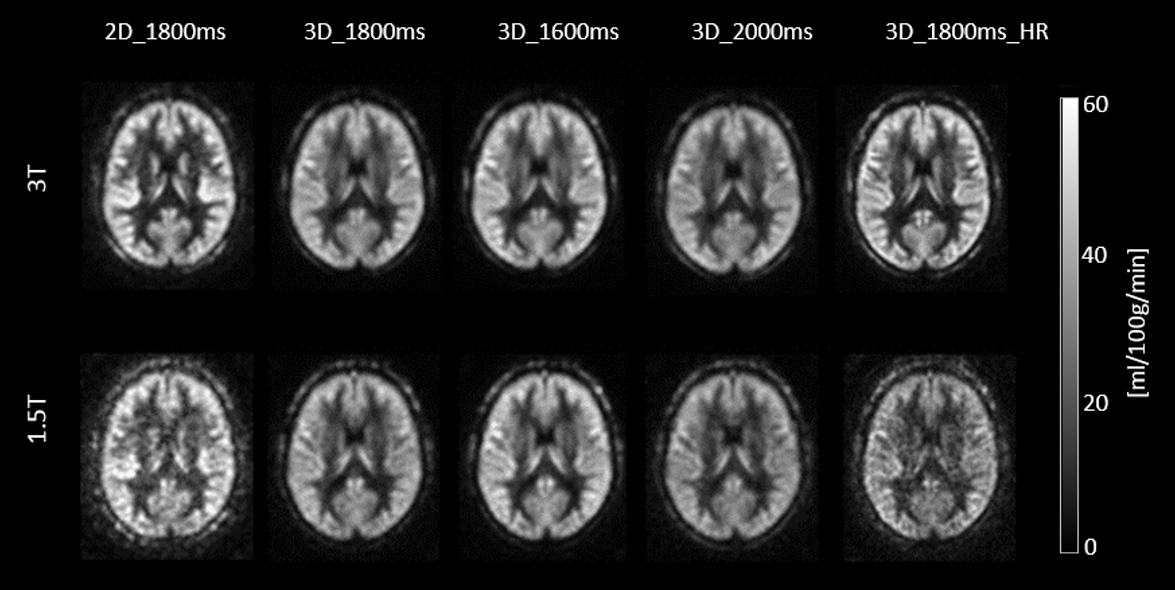
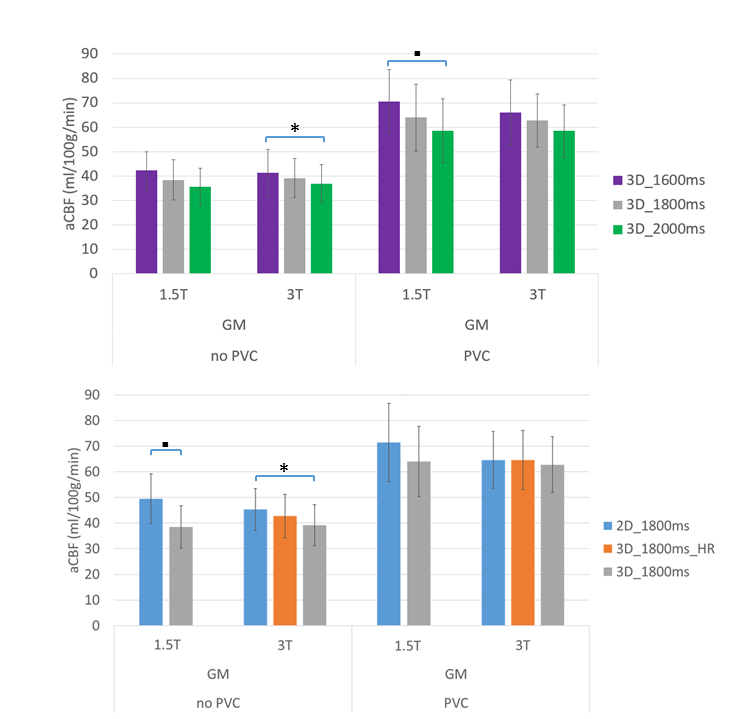
Figure 2: average, GM, and GM with-PVC CBF values of all volunteers per scan type and field strength. In 2a) the CBF of 3D-GraSE scans with different PLDs are compared, while in 2b) the effect of different read-out strategies is visible, comparing 2D-EPI, 3D-GraSE and 3D-GraSE_HR (shorter TSE-shot length). At 1.5T, 3D-HR values are excluded because of insufficient image quality in the individual images.
“*” indicates p<0.05. “▪” indicates p<0.01