2157
Quantitative T1-difference maps and T1-weighted difference images: which modality is better at identifying tumor infiltration in high grade gliomas?1Brain Imaging Center (BIC), Goethe University, Frankfurt/Main, Germany, 2Dr Senckenberg Institute of Neurooncology, Goethe University, Frankfurt/Main, Germany, 3Institute of Neuroradiology, Goethe University, Frankfurt/Main, Germany, 4Funktionseinheit Neuroradiologie, Radiologische Klinik der UKB, Bonn, Germany
Synopsis
In glioblastoma patients, differences of quantitative T1 (qT1) maps acquired before and after contrast agent (CA) administration are visually compared to the respective differences of conventional T1-weighted (T1w) images. Quantitative T1-differences are determined in the following regions-of-interest (ROIs): (1) enhancing tumor, (2) edema, (3) 5mm-rim around (1)+(2), (4) control tissue contralateral to the tumor. T1w- and qT1-differences clearly show the enhancing tumor, but only the qT1-difference maps show signal enhancement in the edema, which is in line with elevated qT1-difference values in this ROI. This indicates most likely CA leakage due to tumor infiltration.
Introduction and Purpose
Part of the conventional MRI protocol for the diagnosis of WHO grade IV glioblastomas1 is T1-weighted (T1w) imaging after intravenous contrast agent (CA) application, showing a clear signal enhancement in glioblastomas. These images are highly relevant for treatment planning. However, infiltrating glioblastoma cells usually exceed the enhancing part of the tumor visible in conventional post-CA T1w images and infiltrate the edema region.
Purpose of this study was: (a) To compare quantitative (q) T1-difference maps (qT1 pre-CA minus qT1 post-CA) and T1w difference images (T1w post-CA minus T1w pre-CA) with respect to the visibility of tumor cell infiltration beyond the enhancing part of the tumor. (b) To compare qT1-difference values between control tissue contralateral to the tumor and the following regions of interest (ROIs): (1) enhancing part of the tumor, (2) edema, and (3) 5mm-rim around the sum of (1) and (2).
Subjects and Methods
Patients: All patients gave informed written consent prior to participating in this study. MRI data were acquired in 52 patients with suspected high-grade glioma shortly before stereotactic biopsy. Histopathology of tumor tissue from biopsy resulted in the final diagnosis of glioblastoma in 44 of these patients. Due to movement artifacts, only 33 patients could be included in the final analysis.
Data Acquisition: MRI data were acquired using a 3T whole body scanner with a body TX-coil and an 8-channel phased-array RX-coil.
Quantitative T1 mapping before and after gadolinium-based CA administration was performed using the variable flip angle (VFA) technique with a FLASH-EPI hybrid readout2 which provides a proton density weighted and a T1w data set for calculation of the qT1 maps. T1 maps were corrected for insufficient spoiling and B1 inhomogeneities. Imaging parameters were: FOV=256x224x160mm3 with 1mm isotropic resolution, TR/TE=16.4ms/6.7ms, α1/α2=4°/24°, total acquisition time 9:48 min. The images acquired with α2=24° show a strong T1-weighting and were used as T1w images. T2-mapping was performed using a TSE sequence with a FOV of 240x180mm2, a matrix size of 192x144, and 25 axial 2mm-slices without inter-slice-gap; timing parameters were TR=4670ms and TE=[16,64,96,128,176]ms; the T2-map was only used for defining the edema region.
Post-processing and Analysis: For each patient, all data were co-registered to the T1w image pre-CA. The enhancing solid tumor ROI and adjacent edema ROI were identified semi-automatically using the qT1-difference-map and the T2-map, respectively. For all patients, qT1-difference values were determined in the following ROIs: (1) enhancing part of the tumor, (2) edema region, (3) 5mm-rim around the sum of regions (1) and (2), and (4) a sphere of 8mm diameter in control tissue on the contralateral side. Differences of conventional T1w images post- and pre-CA (as commonly provided on clinical scanners) were compared to qT1-difference maps (based on off-line post-processing) with regard to the visibility of CA accumulation beyond the enhancing solid part of the tumor.
Results
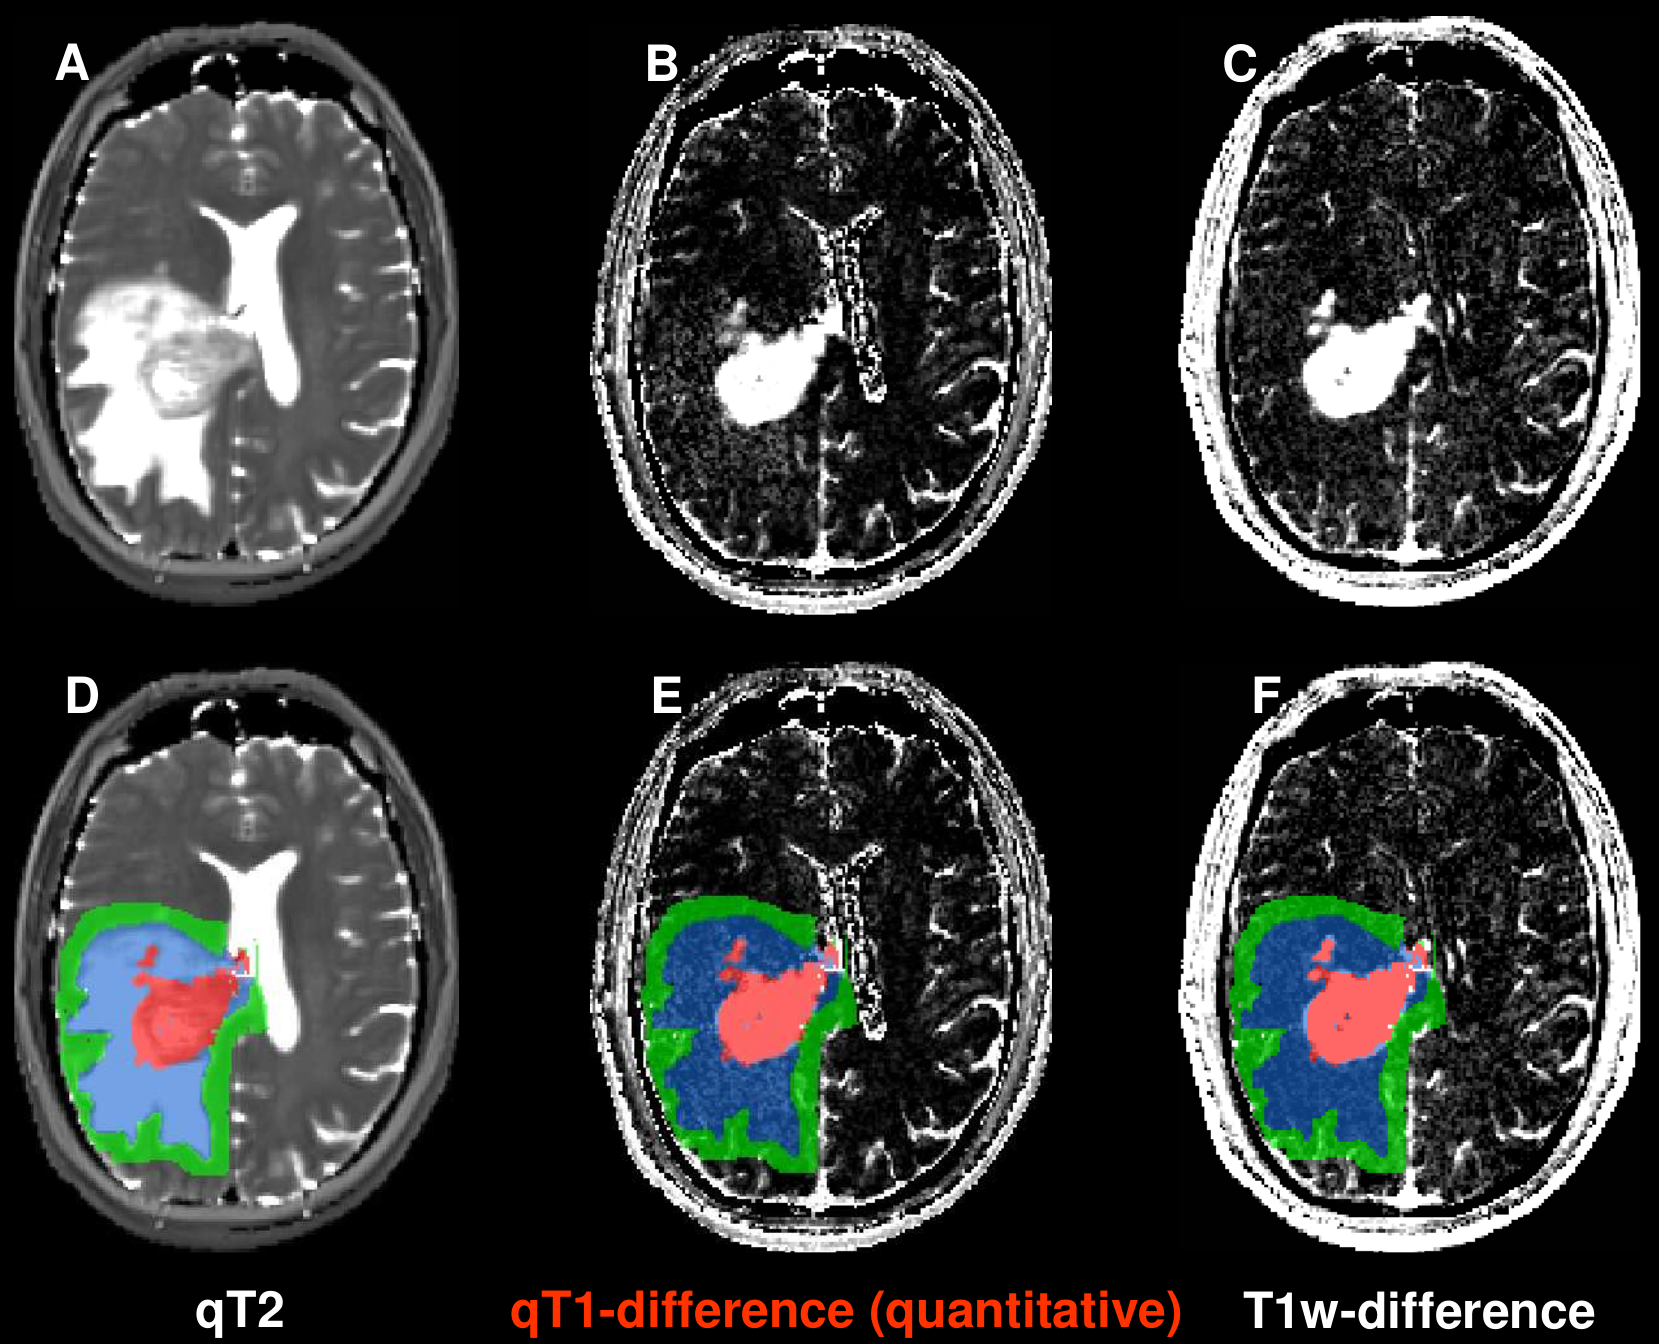
Figure 1 shows original data sets (top) and with ROIs superimposed (bottom) for one patient: the T2 map (A,D) (used to determine the edema region), depicting a tumor (adjacent to the ventricle) with edema, the qT1-difference map (B,E) and the difference of the T1w images (C,F). Both the differences of qT1 maps (B,E) and of T1w images (C,F) are hyperintense in the central enhancing tumor area (red) with a strong accumulation of CA. In contrast, only the qT1-difference map (B,E) shows clearly elevated values in the edema region (blue), indicating CA leakage. Table 1 lists the mean ± SD (N=33) of the qT1-differences and the T1w-differences for all ROIs. For both differences, the enhancing tumor shows the highest value, and the edema has a higher value than the adjacent 5mm-rim. The value in the contralateral control tissue is below the values of all other ROIs.Discussion and Conclusion
Both the difference of T1w images and of qT1 maps clearly delineates considerable CA enhancement in the solid tumor. In contrast to the difference of the conventional T1w images, the qT1-difference maps also reveal elevated signal intensities in the edema region, indicating CA leakage and thus suggesting infiltration of the tumor in the edema region. This finding is in line with the elevated qT1-difference values in the edema and the 5mm-rim ROIs. In conclusion, upon visual inspection (which is the basis for treatment decisions in clinical routine), the qT1-difference maps show signal enhancement in the edema, and thus indicate infiltration, which is not visible in conventional images. This is an important finding as these infiltration areas could be included in radiation therapy.Acknowledgements
No acknowledgement found.References
1. Louis DN et al.,The 2007 WHO classification of tumours of the central nervous system. Acta Neuropathol 2007;114:97-109
2. Preibisch C and Deichmann R, T1 mapping using spoiled FLASH-EPI hybrid sequences and varying flip angles. Magn Reson Med 2009;62:240-246
Figures