2156
ADC-map-based classification of glioma-subtypes in diffusion-weighted MR-Imaging1Department for Neuroradiology, University Hospital of Tuebingen, Tuebingen, Germany, 2Institute of Neuropathology, Department of Pathology and Neuropathology, University Hospital of Tuebingen, Tuebingen, Germany
Synopsis
DWI showed great potential for estimation of histopathological and molecular profile of human glioma. 97 patients with suspected glioma underwent pre-operative MRI-scans, including high b-value DWI. ADC-maps from pairs of two b-values were calculated. Post-interventional histopathological tumor grading was realized on a molecular basis using the molecular markers IDH-mutation, 1p/19q- and ATRX-loss. Significant differences (p < 0.001) were found between oligodendroglioma, astrozytoma and GBM. Best discrimination was achieved when calculating the ADC-maps from b-values of 500 and 2500 s/mm2. Therefore, ADC-map based evaluation of glioma in DWI provides great potential in accurate pre-interventional diagnosing of glioma subtypes.
Introduction
Gliomas are the most common primary cerebral tumors. They are associated with an extremely poor overall survival (OS) and more years of life lost than any other tumor 1. So far, post-interventional histopathological examinations are the gold-standard procedure for final diagnosis. An accurate diagnosis is necessary to offer the patients a fast and promising therapy 2,3. Diffusion weighted imaging (DWI) and estimation of diffusion coefficient and kurtosis values within the tumor have shown potential for estimation of the histopathological and molecular profile of human glioma 4-6.Purpose
To assess the diagnostic performance of ADC- values from two b-value measurements in the pre-operative in vivo assessment of gliomas following the WHO 2016 integrated diagnosis scheme and to compare this method to the previously described methods of mean kurtosis (MK) and mean diffusivity (MD) based evaluation 7-10.Materials and methods
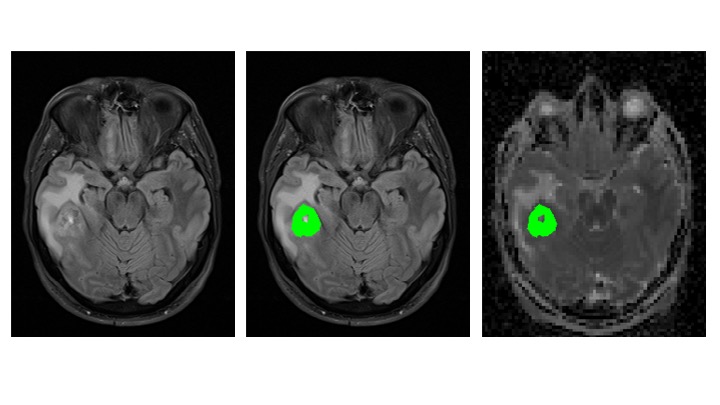
97 patients with suspected glioma who provided written informed consent were retrospectively assessed between 01/2014 and 09/2017 from a prospective trial which was approved by the local institutional review board. All patients underwent pre-operative MRI-examination including diffusion weighted imaging with b-values of 0 (b0), 500 (b500), 1000, 1500, 2000 and 2500 (b2500) s/mm2 and two averages and 6 directions per b-value. Signals were averaged over all directions. Entire tumor volume was manually delineated on the T2-FLAIR images on multiple slices. MK- and MD-maps were calculated from all acquired data. 9 different ADC-maps from pairs of two b-values were calculated (Five using b0 and four using b500 as a reference). ADC-, MK- and MD-maps were interpolated to the matrix points of the FLAIR images, VOIs were subsequently transferred from the FLAIR images to the ADC-, MK- and MD-maps and mean values of the tumor subtypes were compared. One-way ANOVA with post-hoc Games-Howell correction was used to compare ADC, MD and MK between 2016 CNS WHO-based tumor grades. Post-interventional histopathological tumor grading was realized on a molecular basis using the molecular markers IDH-mutation, 1p/19q- and ATRX-loss.Results
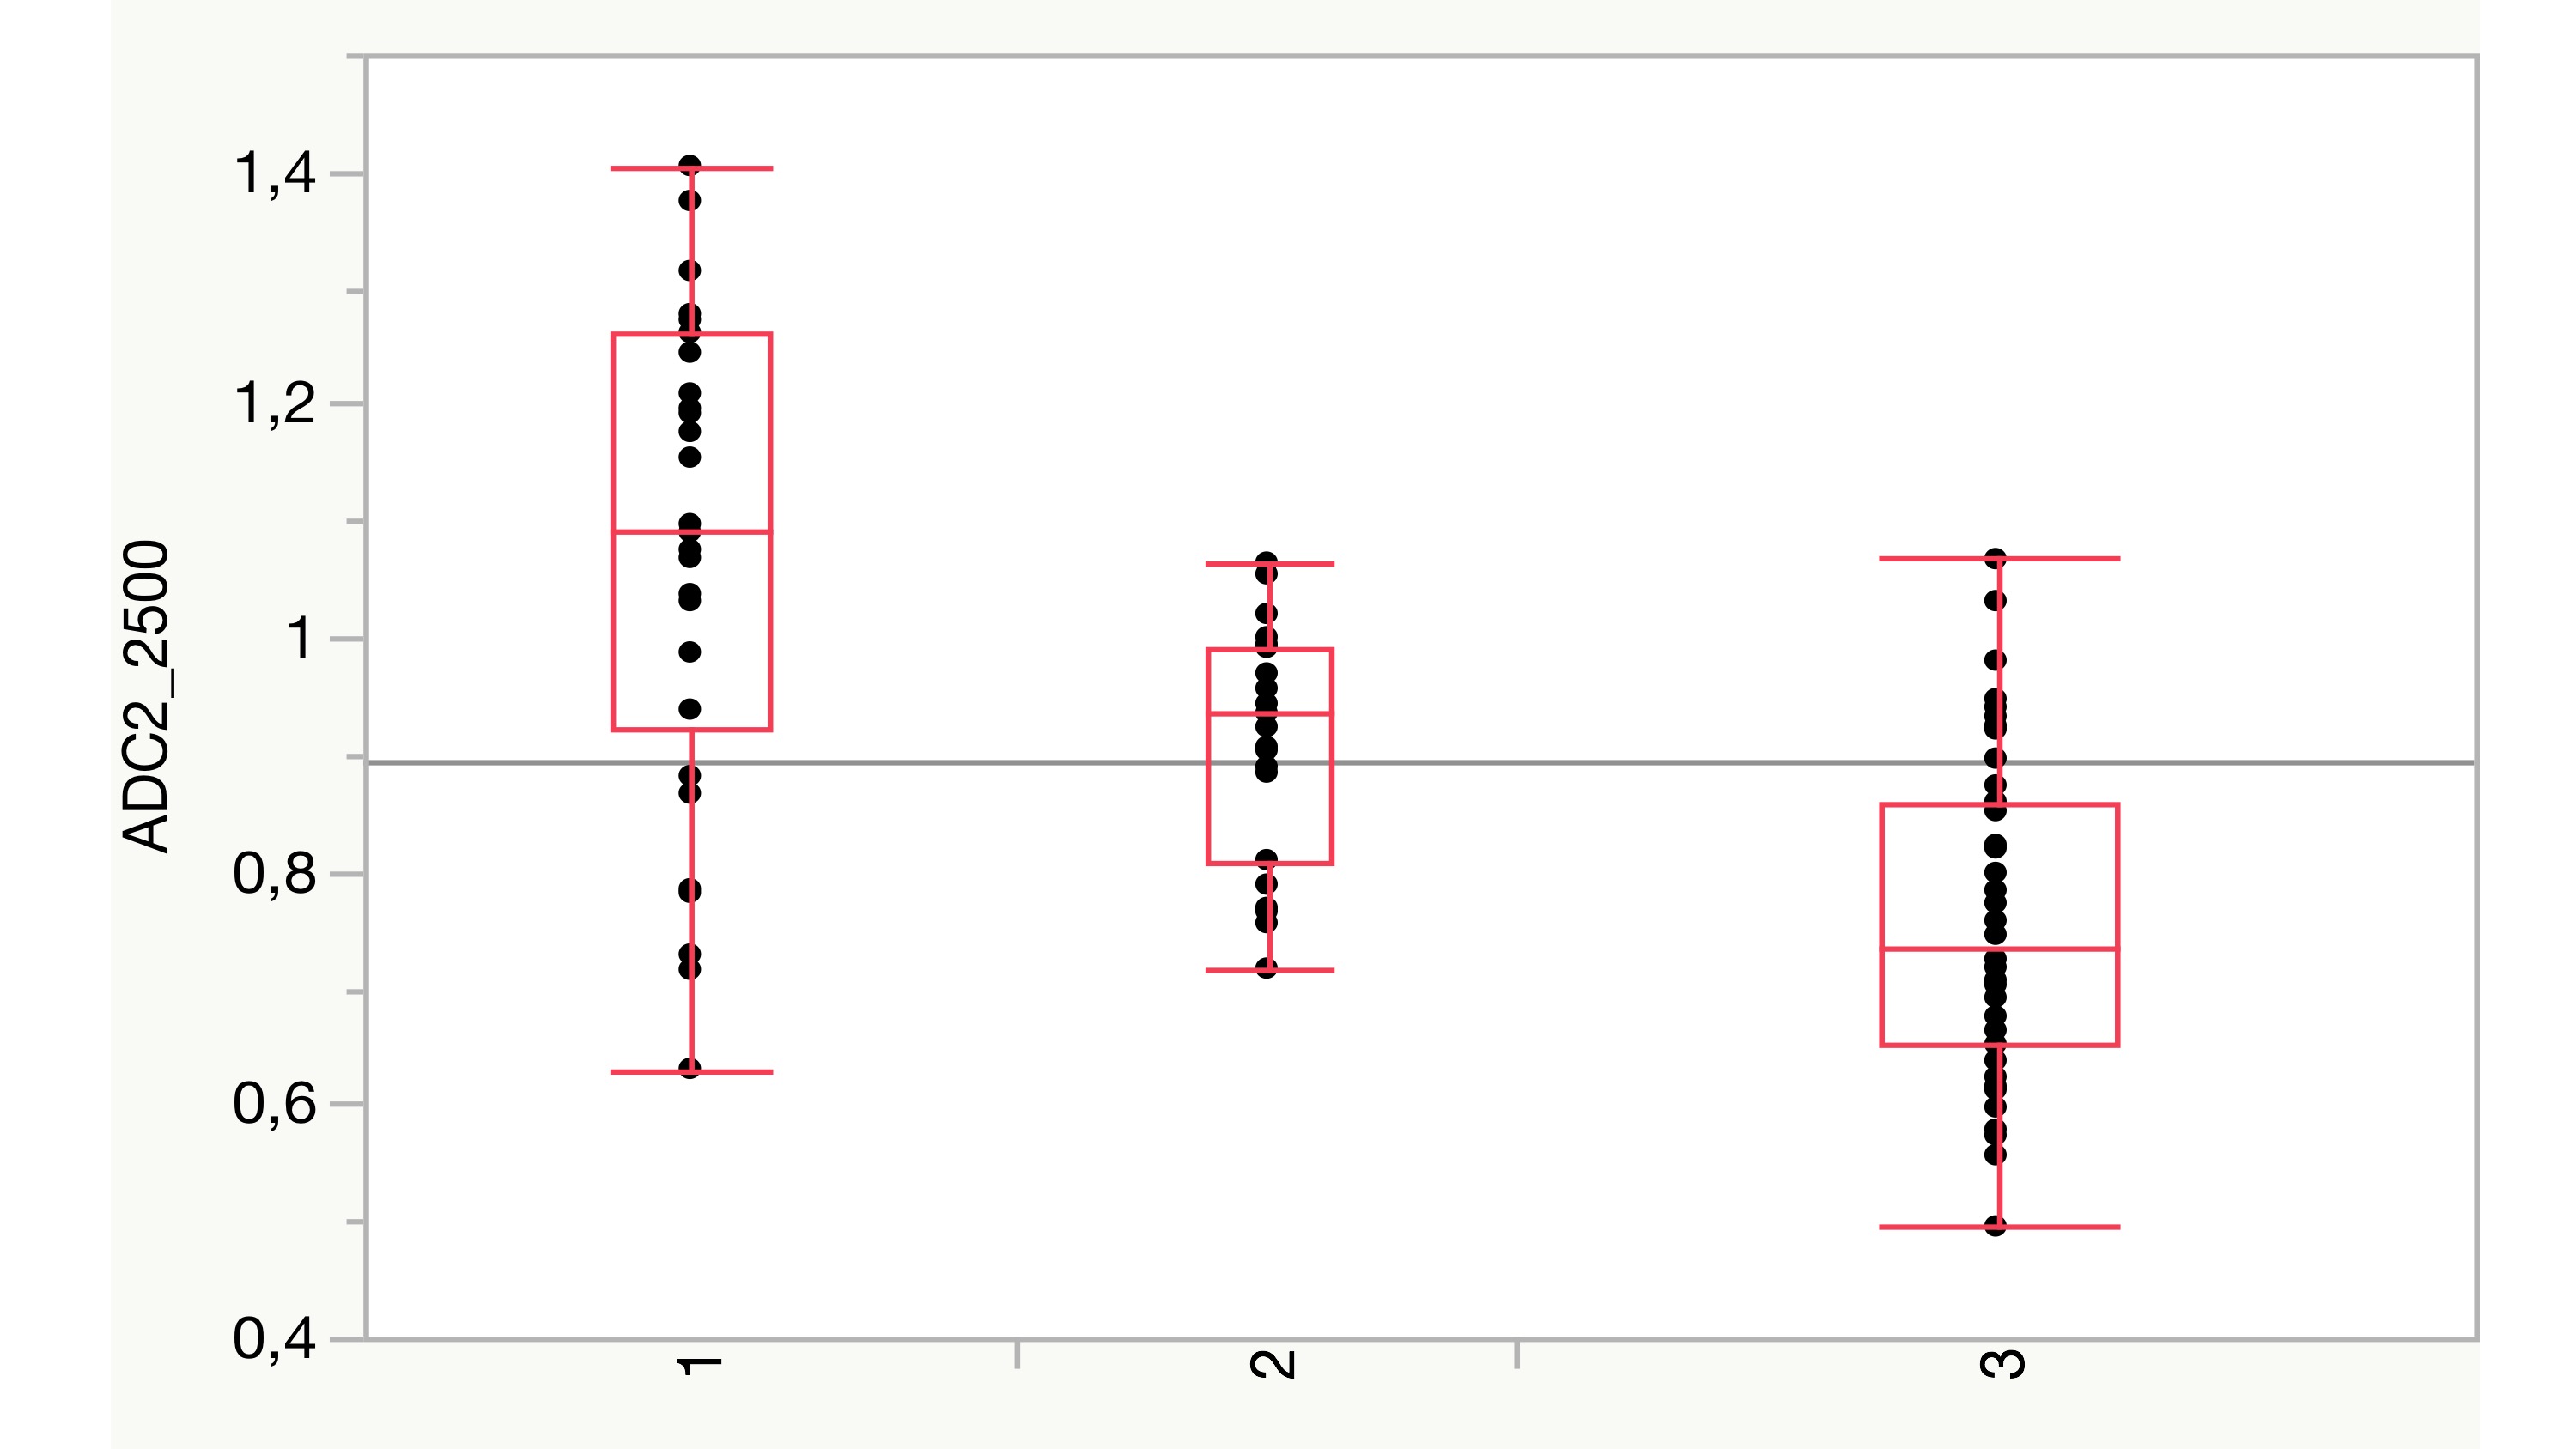
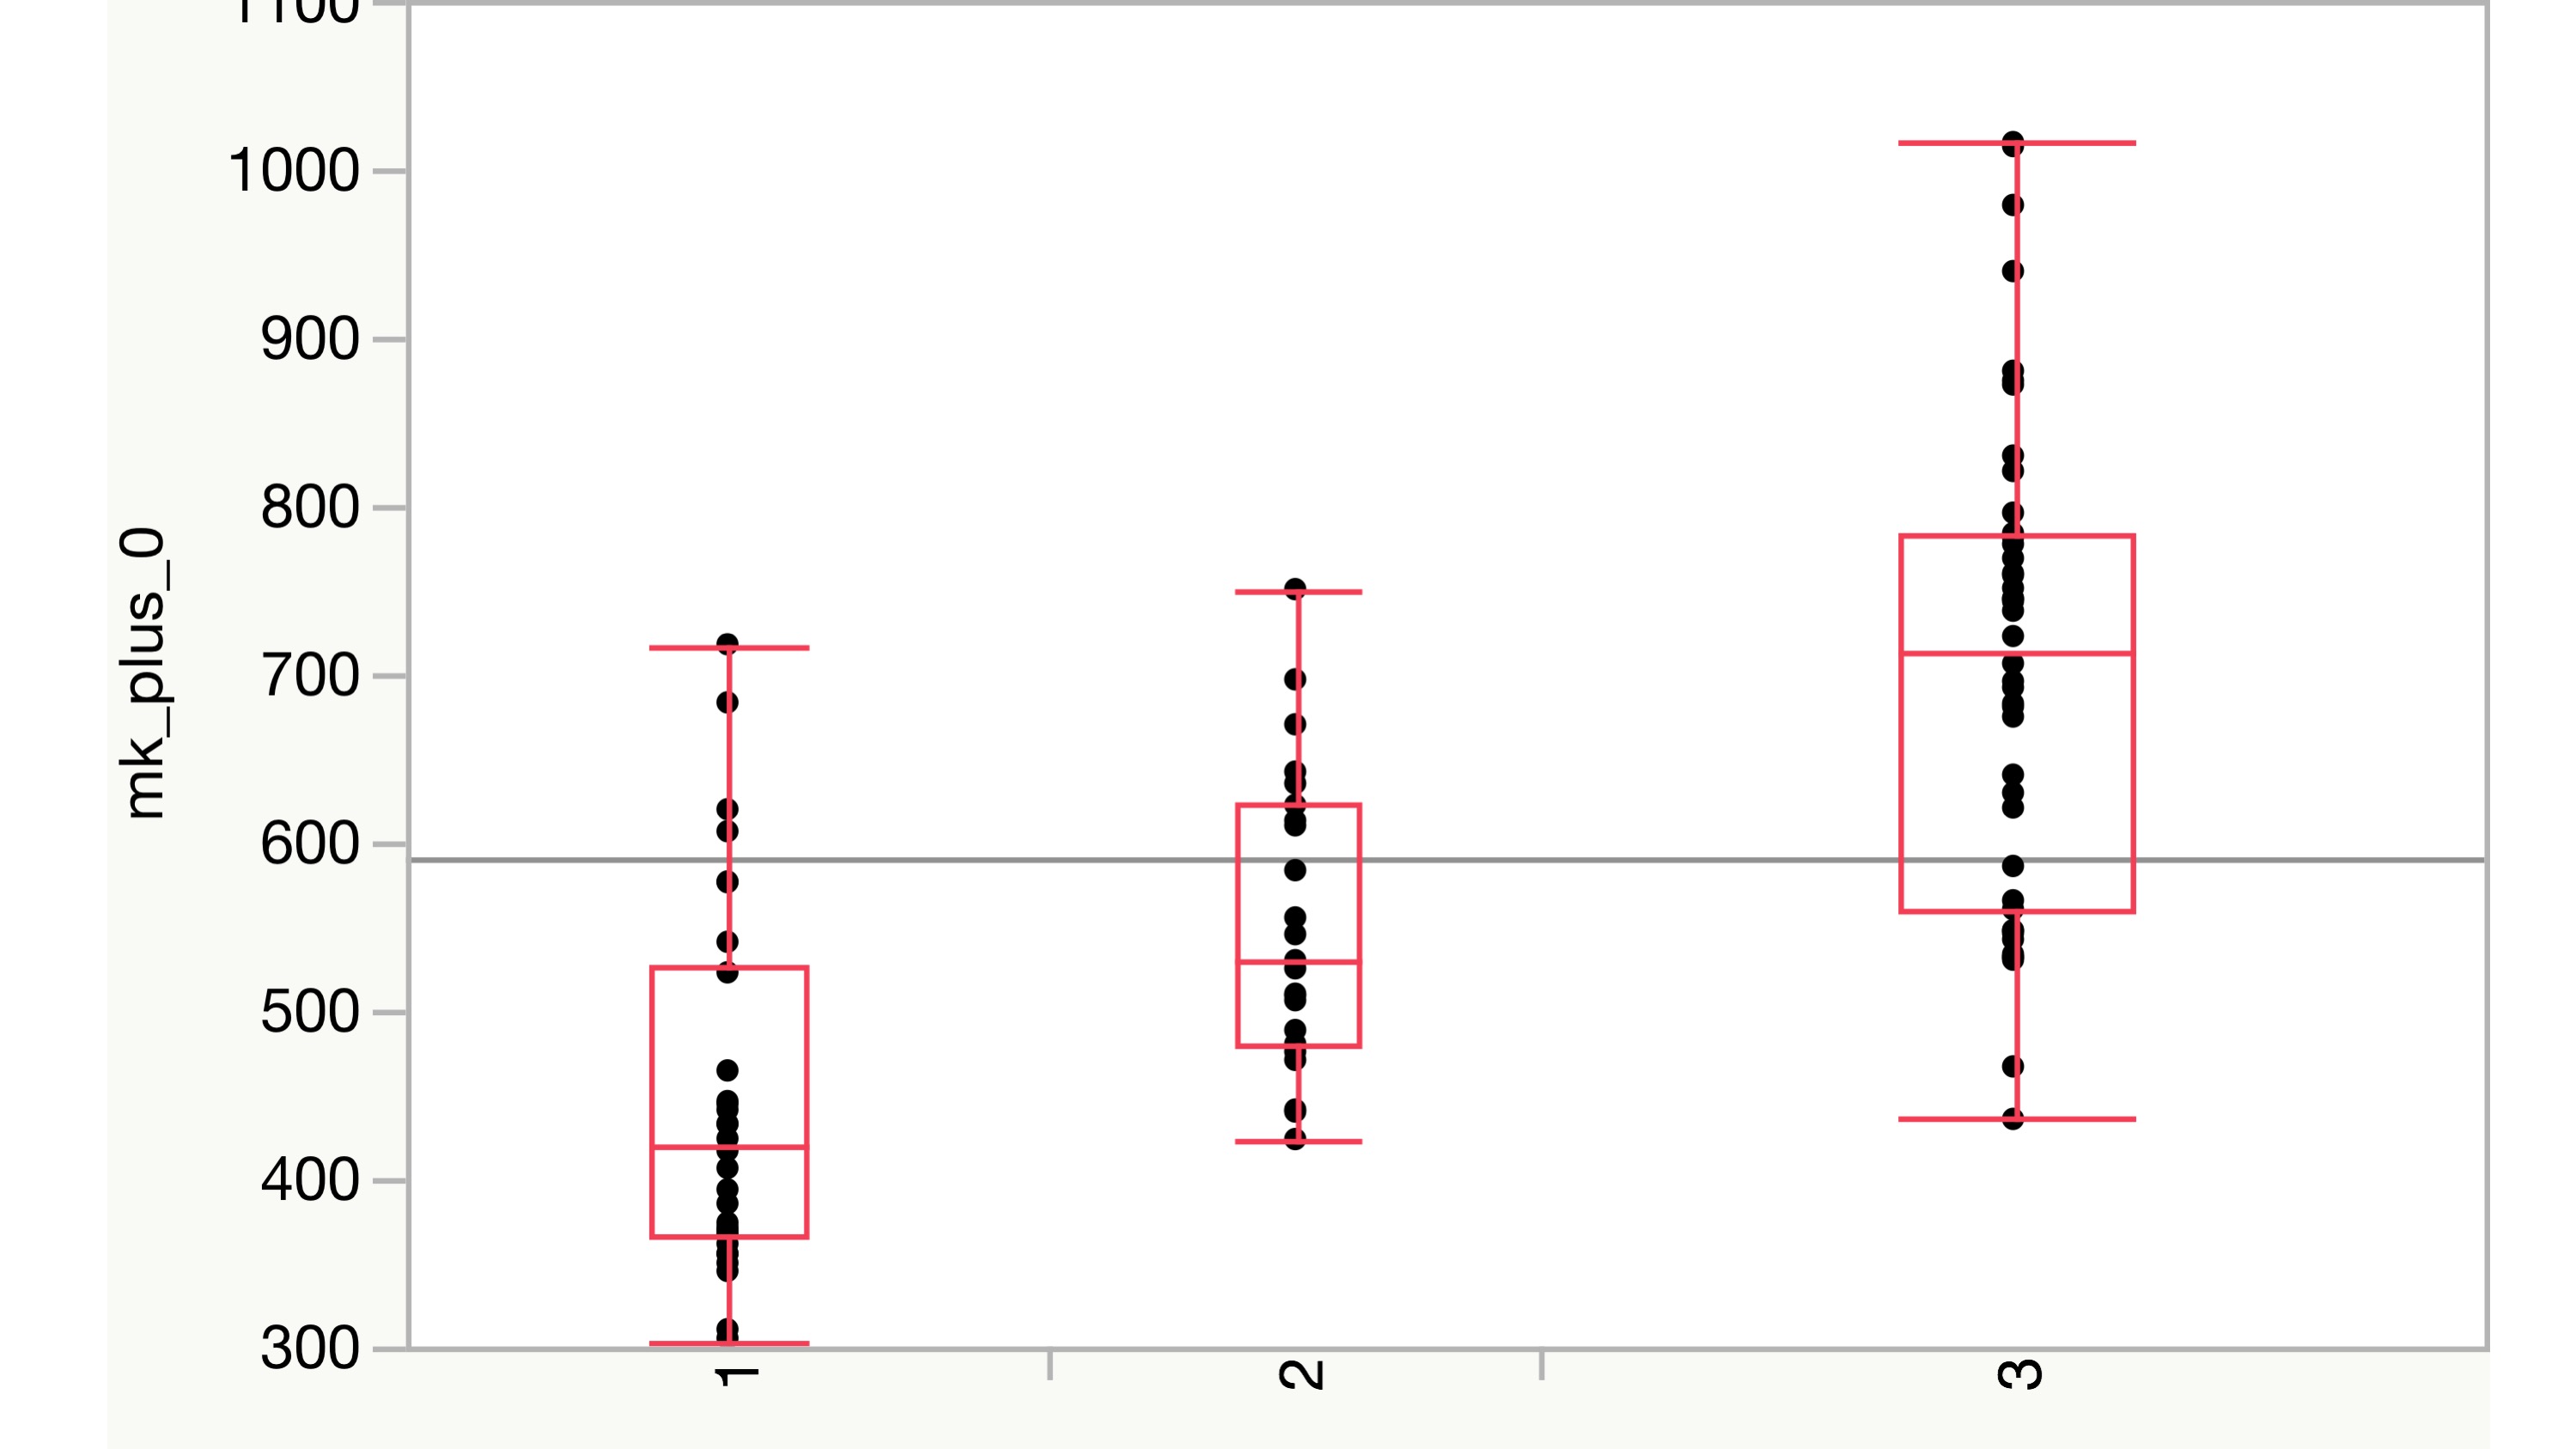
MK-analysis delivered best results using all six measured b-values, as shown in previous studies (p < 0.001). Results of the MD evaluation were significant, when leaving out the b-value of 0 s/mm2 (p < 0.01). Two b-value dependent ADC-map based evaluation showed great potential in separating the three diagnosis groups and statistically highly significant differences between the groups were demonstrated (p < 0.001). ADC-values of astrozytomas appeared to be significantly higher than those of the oligodendrogliomas and GBM in all b-values. ADC-values of oligodendrogliomas were significantly higher than those of GBM. Best discrimination was achieved when calculating the ADC-maps from b500 and b2500, avoiding the perfusion influence included in the b0 measurement. The discovered findings underline the hypothesis, that different glioma subtypes seem to show differences in diffusion weighted MR-imaging.Discussion
Measurement of only two b-values compared with ADC-based assessment could be sufficient for pre-interventional diagnosing. This corresponds to a reduction of acquisition time by 66% (two instead of six minutes), while results remained comparable to the MK-evaluation and were better than in the MD based analysis. Apparently, perfusion-based influence in DWI and DKI needs to be considered in the discrimination of different glioma subtypes. Looking at MK-maps, glioblastomas, known to have higher perfusion, present higher MK-values which intensify the measurable differences. In MD- and ADC-maps, higher graded gliomas present lower MD or ADC-values, therefore perfusion based influence in lower b-value measurement impair the results.Conclusions
ADC-map based evaluation of glioma in DWI provides great potential in accurate pre-interventional diagnosing of glioma subtypes. The proposed technique is time-saving (66% reduction of acquisition time) and consists of a relatively simple post-processing method. Therefore it is an important step to introduce pre-interventional glioma grading in routine clinical practice. Further investigations, using higher b-values, may provide even higher diagnostic accuracy.Acknowledgements
Nils Christoph Nuessle was supported by the doctoral scholarship IZKF of the medical faculty of Tuebingen.References
1. Schwartzbaum JA, Fisher JL, Aldape KD, Wrensch M. Epidemiology and molecular pathology of glioma. Nat Clin Pract Neurol. 2006;2(9):494-503; quiz 1 p following 16.
2. Van Cauter S, De Keyzer F, Sima DM, Sava AC, D'Arco F, Veraart J, et al. Integrating diffusion kurtosis imaging, dynamic susceptibility-weighted contrast-enhanced MRI, and short echo time chemical shift imaging for grading gliomas. Neuro Oncol. 2014;16(7):1010-21.
3. Kulkarni AV, Guha A, Lozano A, Bernstein M. Incidence of silent hemorrhage and delayed deterioration after stereotactic brain biopsy. J Neurosurg. 1998;89(1):31-5.
4. Zhang L, Min Z, Tang M, Chen S, Lei X, Zhang X. Corrigendum to "The utility of diffusion MRI with quantitative ADC measurements for differentiating high-grade from low-grade cerebral gliomas: Evidence from a meta-analysis" [J. Neurol. Sci. 373 (2017) 9-15]. J Neurol Sci. 2017;375:103-6.
5. Zhang L, Min Z, Tang M, Chen S, Lei X, Zhang X. The utility of diffusion MRI with quantitative ADC measurements for differentiating high-grade from low-grade cerebral gliomas: Evidence from a meta-analysis. J Neurol Sci. 2017;373:9-15.
6. Kang Y, Choi SH, Kim YJ, Kim KG, Sohn CH, Kim JH, et al. Gliomas: Histogram analysis of apparent diffusion coefficient maps with standard- or high-b-value diffusion-weighted MR imaging--correlation with tumor grade. Radiology. 2011;261(3):882-90.
7. Hempel JM, Schittenhelm J, Brendle C, Bender B, Bier G, Skardelly M, et al. Effect of Perfusion on Diffusion Kurtosis Imaging Estimates for In Vivo Assessment of Integrated 2016 WHO Glioma Grades : A Cross-Sectional Observational Study. Clin Neuroradiol. 2017.
8. Hempel JM, Bisdas S, Schittenhelm J, Brendle C, Bender B, Wassmann H, et al. Erratum to: In vivo molecular profiling of human glioma using diffusion kurtosis imaging. J Neurooncol. 2017;131(1):103.
9. Hempel JM, Bisdas S, Schittenhelm J, Brendle C, Bender B, Wassmann H, et al. In vivo molecular profiling of human glioma using diffusion kurtosis imaging. J Neurooncol. 2017;131(1):93-101.
10. Louis DN, Perry A, Burger P, Ellison DW, Reifenberger G, von Deimling A, et al. International Society Of Neuropathology--Haarlem consensus guidelines for nervous system tumor classification and grading. Brain Pathol. 2014;24(5):429-35.
Figures