2155
Differentiation of grade II/III and Grade IV glioma by combining ‘T1 contrast enhanced brain perfusion imaging’ and susceptibility weighted quantitative imaging1Department of Neuroimaging & Interventional Radiology, National Institute of Mental Health and Neurosciences, Bangalore, India, 2Department of Radiology and Imaging, Fortis Memorial Research Institute, Gurgaon, India, 3Beckman Research Institute, Mathematical Oncology, Duarte, CA, United States, 4Center for Biomedical Engineering, Indian Institute of Technology Delhi, Delhi, India, 5Department of Neurosurgery, Fortis Memorial Research Institute, Gurgaon, India, 6SRL Diagnostics, Fortis Memorial Research Institute, Gurgaon, India, 7Department of Neurosurgery, National Institute of Mental Health and Neurosciences, Bangalore, India, 8Department of Biostatistics, National Institute of Mental Health and Neurosciences, Bangalore, India, 9Department of Neuropathology, National Institute of Mental Health and Neurosciences, Bangalore, Heard Island And Mcdonald Islands
Synopsis
The purpose of this study is to evaluate the usefulness of T1-perfusion MRI and SWI in discriminating among grade II, III and IV gliomas. We found that combining T1-perfusion and SWI improves the diagnostic accuracy for discrimination of grade III from grade IV gliomas and T1-perfusion MRI derived rCBV alone appears to be an excellent measure for discriminating grade II from grade III glioma.
Introduction:
Gliomas are the most common primary neoplasm of brain. Treatment strategy depends on tumor grade which includes serial follow-up, surgical resection, radiation therapy and chemotherapy. Outcome of patients with grade II tumors is relatively good with 5 year survival of more than 50%, while those with high grade lesions (Grade III and Grade IV) have poor prognosis1. T1 perfusion imaging provides information about tumor angiogenesis noninvasively and is useful for glioma grading2. Susceptibility weighted imaging (SWI) is another useful technique for depicting the tumor vasculature and microhemorrhages. Studies have shown usefulness of SWI for determining the glioma grade by semi quantitatively evaluating intratumoral susceptibility signal intensity (ITSS)3. In the present study, we aim to investigate the usefulness of T1-perfusion MRI and SWI in discriminating grade II, III and grade IV gliomas in a large group of treatment naïve patients.Methods:
Multicenter retrospective study included a total of 129 treatment naïve patients with glioma (70 grade IV, 33 Grade III and 26 Grade II gliomas) confirmed on histology. All imaging were performed on a 3.0 T MRI scanner with a 15/32 channel head coil. Ethical approval was obtained from both the participating institutions. For T1-perfusion MRI, pre-contrast 2D T1-weighted TSE (TR/TE 360/10 ms), fast dual SE proton-density (PD)-weighted and T2-weighted fat suppressed images(TR/TE1/TE2 3500/23.2/90 ms) with slice thickness 6 mm; FOV= 240 × 240 mm2; matrix size=256×256, were acquired to quantify voxel-wise pre-contrast tissue longitudinal relaxation time T10. Dynamic images were acquired using a T1-fast field echo (T1-FFE). At the fourth time point of the dynamic data acquisition, 0.1 mmol/kg body weight of Gd-BOPTA (Multihance, Bracco, Italy) was administered intravenously at a rate of 3.0 ml/sec, followed by a 30-ml saline flush. A series of 384 images at 32 dynamics for 12 slices were acquired with a temporal resolution of 3.9 sec and SWI (TR/TE;16/23, NEX 1, section thickness 1 mm, matrix 256X203).
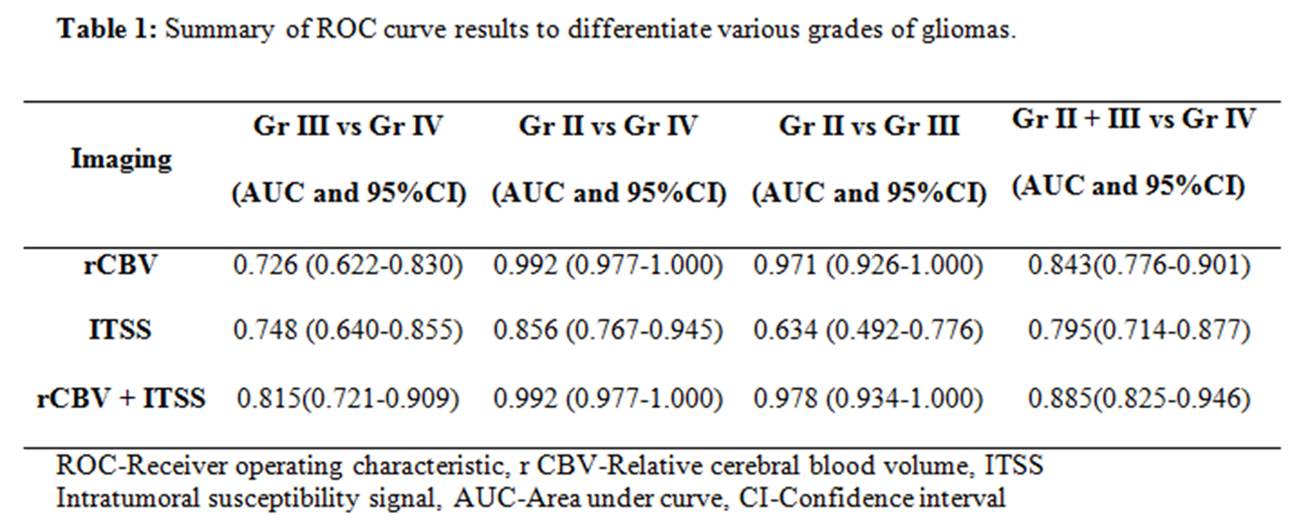
Data processing and quantitative analysis: T1 perfusion maps were generated by removing the leakage effect of the disrupted blood brain barrier as mentioned in the literature4. ROIs were placed on the slice showing tumor with maximum rCBV. Two experienced radiologists blinded to the final histopathology performed the ROI analysis and recorded values. ITSS scoring on SWI in each tumor and used semi-quantitative analysis method proposed by Park et al3. All statistical analyses were performed with SPSS 22 software. Receiver operating characteristic (ROC) curve analysis was used to evaluate the performance of ITSS and rCBV individually in discriminating between various grades of tumors (grade III vs grade IV; grade II+III vs grade IV tumors) by comparing the area under the curve (AUC). A p value of <0.05 indicated a statistically significant difference.
Results:
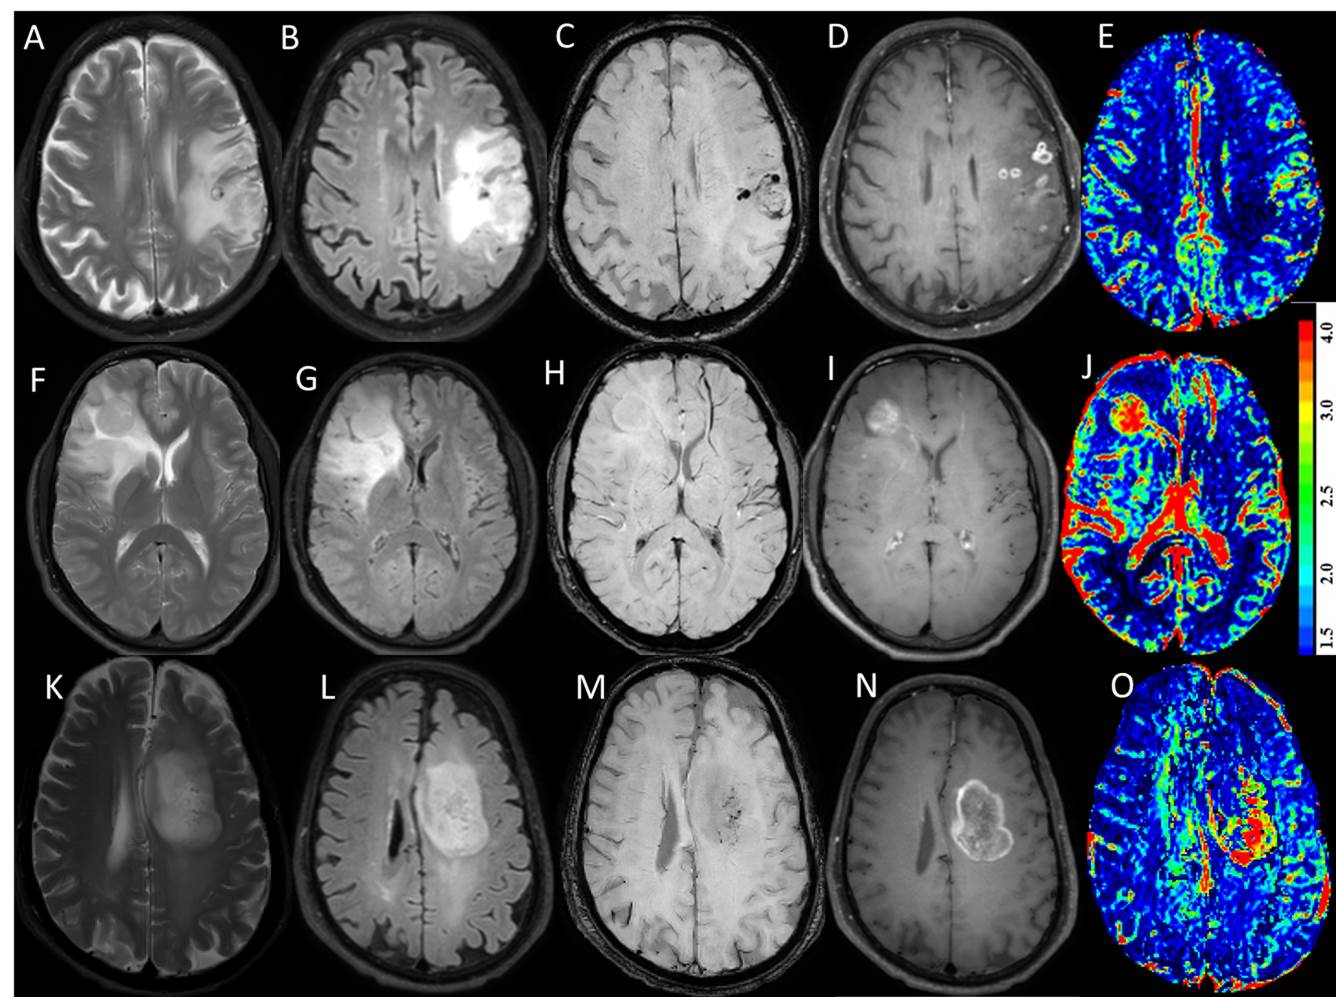
Significant differences in rCBV values of three grades of tumors was noted and pair wise comparisons showed significantly higher rCBV values in grade IV tumors as compared to grade III tumors and similarly increased rCBV was seen in the grade III tumors as compared to grade II tumors (P<0.001) (Figure 1). ROC curve analysis summarized in Table 1. Grade IV gliomas showed significantly higher ITSS scores on SWI as compared to grade III tumors (p<0.001) whereas no significant difference was seen on comparing ITSS scores of grade III with grade II tumors. Combining the rCBV and ITSS resulted in significant improvement in the discrimination of grade III from grade IV tumors.Discussion:
In this study, addition of SWI based ITSS improved the diagnostic performance of rCBV for differentiating grade III and grade IV gliomas as well as Grade II+III from grade IV gliomas. ITSS value were significantly higher for grade IV tumors as compared to grade III tumors while no significant difference was noted in the ITSS values of grade II and III tumors. Both perfusion and SWI techniques appear to be complimentary for identification of neoangiogenesis in brain tumors and improve the diagnostic accuracy for discrimination of grade III, grade IV gliomas.Conclusion:
We conclude that MR imaging evaluation of intracranial tumors can be improved by combining T1 perfusion and SWI in the imaging protocol.Acknowledgements
NoneReferences
1. Louis DN, Ohgaki H, Wiestler OD, et al. The 2007 WHO classification of tumours of the central nervous system. Acta Neuropathol 2007; 114:97–109.
2. Sahoo P, Gupta RK, Gupta PK, et al. Diagnostic accuracy of automatic normalization of CBV in glioma grading using T1- weighted DCE-MRI. Magn Reson Imaging. 2017; 44:32-37.
3. Park MJ , Kim HS, Jahng GH, et al. Semiquantitative assessment of intratumoral susceptibility signals using non-contrast-enhanced high-field high-resolution susceptibility-weighted imaging in patients with gliomas: comparison with MR perfusion imaging. Am. J. Neuroradiol. 2009;30:1402–8.
4. Singh A, Haris M, Rathore D, et al. Quantification of physiological and hemodynamic indices using T(1) dynamic contrast-enhanced MRI in intracranial mass lesions. J Magn Reson Imaging 2007;26 :871-80.
Figures