2154
Comparison of Dynamic Susceptibility Contrast and Arterial Spin Labeling at the Target Locations of Image guided Tissue Samples for Patients with Glioma1Radiology, UCSF, San Francisco, CA, United States, 2Neuropathology, UCSF, San Francisco, CA, United States, 3Neurosurgery, UCSF, San Francisco, CA, United States
Synopsis
Arterial spin labeling and dynamic susceptibility contrast perfusion weighted imaging were both found to provide acceptable measures of blood vessel angiogenesis in brain tumors compared to pathological measures but dynamic susceptibility contrast may be better correlated with the underlying vascular morphology.
Purpose
Angiogensis is important factor in differentiating between higher and lower grade brain tumors1,3. Dynamic Susceptibility Contrast (DSC) provides estimates of relative cerebral blood volume (rCBV) and is the most commonly applied perfusion imaging technique in these patients4. Recent studies have indicated that Arterial Spin Labeling (ASL), which provides estimates of cerebral blood flow (CBF) may be correlated with cbv within the anatomical lesion2,5,6. This study used image-guided tissue samples obtained during surgery to thoroughly investigate the relationship between ASL and DSC and to compare the results obtained using both methods with pathological measures of vascular morphology in patients with glioma.Methods
Patients were scanned prior to surgical resection of glioma using a GE 3T scanner with both ASL and DSC perfusion imaging sequences. ASL used a 3D background- suppressed FSE stack-of-spirals (512x8) with labeling period 1500 ms, & 2025-ms post-label delay and a TR/TE, 4632/10.5; NEX of 3. T2* DSC gradient-echo echo-planar imaging was acquired with a flip angle of 35°, TE/TR=54–56/1250-1500ms, slice thickness=3-4 mm, 2x2mm reconstructed in-plane resolution during a bolus injection of 0.1mmol/kg Gd-DTPA. A total of 72 patients were examined, 28 of the with newly diagnosed tumors and 44 with suspected recurrence. During surgery, tissue samples were removed and locations recorded on the MR images using the Brainlab surgical navigation workstation. The number of biopsy samples analyzed was 162, with 102 being from high-grade tumors and 60 from low-grade tumors. A single pathologist graded each of the tissue samples for proliferative index (MIB-1 %) and microvascular hyperplasia (0-2) The microvascular morphology was also classified as being Delicate, Simple or Complex (0-3) based upon Factor VIII staining. Normalized values of CBV and peak height (PH) were estimated from the DSC and normalized values of CBF were estimated from the ASL images at the location where the samples were obtained. Spearman correlations were calculated between MIB and nCBF, nCBV, and nPH.Results & Discussion
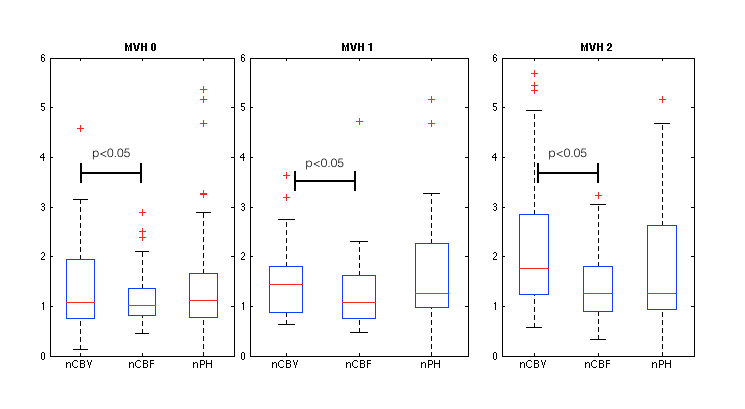
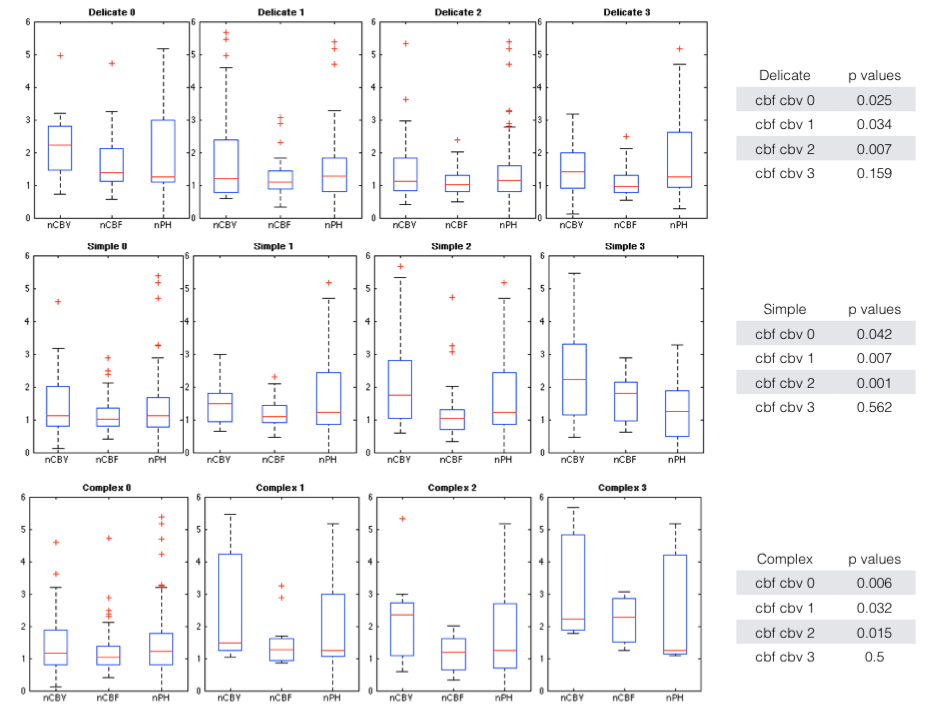
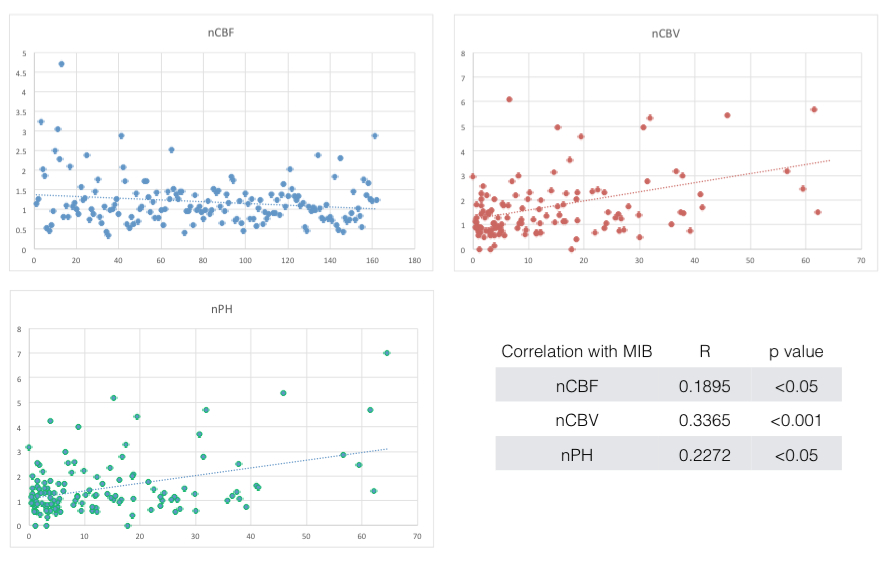
Figure 1 shows nCBV, nCBF, nPH with respect to the microvascular hyperplasia (MVH) scores. There is an overall trend towards higher parameters values with MVH scores and there were significant differences in each sub-group between the nCBV and nCBF. The results shown in Figure 1 indicate that the values of the nCBV and nCBF are significantly different at all levels of microvascular hyperplasia. Parameter values for each of the individual microvacular morphology classifications are shown in Figure 2 and the correlations among the perfusion parameters and the proliferation index (MIB) are shown in Figure 3. The nCBF and nCBV values show a decreasing trend with higher delicate vasculature scores, but the pH is similar between them. The nCBV and nCBF are both elevated for high Simple scores but this finding is less obvious than for the nPH (Figure 2). There is a trend for all 3 parameters to increase with regard to higher Complex scores. At the highest level of microvascular morphology, which is characteristic of high-grade lesions, Figure 2 shows that nCBV and nCBF have similar values. Figure 3 shows scatter plots of the nCBV, nFA and nPH versus MIB index. The values of nCBV and nPH are more closely correlated with tumor proliferative index than nCBF.Conclusion
Arterial Spin Labeling and Dynamic Susceptibility Contrast are both acceptable measures of blood vessel angiogenesis in higher grade brain tumors compared with pathological measures. Dynamic Susceptibility Contrast images may be better correlated with the underlying vascular morphology for both high and lower grade glioma.Figures
Figure 1: Box Plot of imaging parameters versus Micro Vascular Hyperplasia Scores
Figure 2: Box plots of Factor VIIII staining scored based upon the numbers of Delicate, Simple, and Complex sub-types.
Figure 3: CBF and CBV correlations with MiB index, showing that there is a trend towards higher nCBV and nPH for lesions with higher proliferative index.
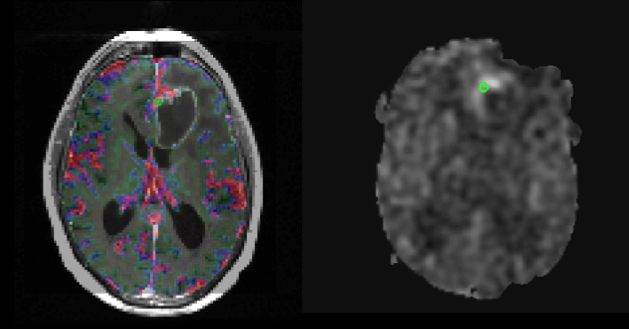
Figure 4: Example CBF and CBV maps showing the location of where tissue samples were obtained.
Acknowledgements
No acknowledgement found.References
1. Cebeci H, Aydin O, Ozturk-Isik E, Gumus C, Inecikli F, Bekar A, et al. Assesment of perfusion in glial tumors with arterial spin labeling; comparison with dynamic susceptibility contrast method. European Journal of Radiology. 2014 October 2014;83(10):1914-9.
2. Furtner J, Schöpf V, Preusser M, Asenbaum U, Woitek R, Wöhrer A, et al. Non-invasive assessment of intratumoral vascularity using arterial spin labeling: A comparison to susceptibility-weighted imaging for the differentiation of primary cerebral lymphoma and glioblastoma. European Journal of Radiology. 2014 May 2014;83(5):806-10.
3. Ma H, Wang Z, Xu K, Shao Z, Yang C, Xu P, et al. Three-dimensional arterial spin labeling imaging and dynamic susceptibility contrast perfusion-weighted imaging value in diagnosing glioma grade prior to surgery. Experimental and Therapeutic Medicine. 2017 01/06;13(6):2691-8.
4. Rau M, Braun C, Skardelly M, Schittenhelm J, Paulsen F, Bender B, et al. Prognostic value of blood flow estimated by arterial spin labeling and dynamic susceptibility contrast-enhanced MR imaging in high-grade gliomas. Journal of Neuro-Oncology. 2014;Volume 120(Number 3):Page 557.
5. Soni N, Dhanota DP, Kumar S, Jaiswal A, Srivastava A. Perfusion MR imaging of enhancing brain tumors: Comparison of arterial spin labeling technique with dynamic susceptibility contrast technique. Neurology India. 2017 9/1;65(5):1046-52.
6. Warmuth C, Günther M, Zimmer C. Quantification of Blood Flow in Brain Tumors: Comparison of Arterial Spin Labeling and Dynamic Susceptibility-weighted Contrast-enhanced MR Imaging. Radiology. 2003 08/01; 2017/11;228(2):523-32.
Figures