2153
The diagnostic value of the distribution pattern of intratumoral susceptibility sign of intracranial tumors on susceptibility-weighted imagingHyunkoo Kang1 and Seongwon Jang1
1Department of Radiology, Seoul Veterans Hospital, Seoul, Republic of Korea
Synopsis
The aim of this study is to determine whether the distribution pattern of intratumoral susceptibility sign (ITSS) derived from susceptibility-weighted imaging (SWI) could differentiate glioblastoma multiforme (GBM) and single brain metastasis. We compared the grade of the visibility of ITSS in the central portion of tumors (CITSS) and in the tumor capsular area (PITSS) on SWI. Our findings suggest that there were different characteristics of ITSS between GBM and brain metastasis on SWI due to the profound difference in histologic feature of capillary between the two tumor types.
Introduction
The aim of our study was to describe the incidence and distribution pattern of intratumoral susceptibility signals (ITSS) in brain tumors, and to determine whether the distribution pattern of ITSS derived from susceptibility weighted imaging (SWI) could characterize the difference of the ultrastructure of tumor capillaries and differentiate glioblastoma multiforme (GBM) and single brain metastasis.Methods
58 intracranial brain neoplasm patients (55 male and 3 female, age 69.8 ± 8.2 years (mean ± SD), 42 brain metastases and 16 with GBM) were enrolled in this study. These patients underwent examinations that included SWI in addition to conventional magnetic resonance (MR) sequences on a 3T. Two radiologists investigated the distribution patterns of ITSS of the tumors and applied an ITSS grading system based on the degree of the ITSS. Magnetic ITSS were defined as either linear hypointense signal that was regarded as intralesional vessels which would be followed on consecutive SWI images or dot like foci of low signal intensity that was regarded as microhemorrhage on SWI imaging that covers whole tumor area. Two radiologists investigated the distribution patterns of ITSS of the tumors and applied an ITSS grading system based on the degree of the ITSS. Then, we compared the grade of the visibility of ITSS in the central portion of tumors; the inner three quarters area of tumor volume (CITSS) and in the tumor capsular area; the outside one quarter area of tumor volume (PITSS) on SWI. The visibility of ITSS of tumors were graded as follows: 0 = no intralesional ITSS, 1 = 1~5 of ITSS, 2 = 6~10, 3 = 11~15, and 4 = conglomerated ITSS on SWI.Results
The mean score and standard deviation of the visibility of the ITSS in the central portion of the tumor and the tumor capsular area ITSS are presented in Table 1-3. The mean visibility scores of the CITSS is higher than PITSS in GBM (p < 0.0001) and the mean visibility scores of the CITSS is lower than PITSS in brain metastases (p < 0.0001). Wilcoxon rank sum test showed that the CITSS in GBM was statistically higher than brain metastasis (p < 0.0001)(Fig. 1) and the PITSS in GBM was statistically lower than brain metastasis (p < 0.0001)(Fig. 2). We found that the CITSS is more frequently seen in GBM than brain metastasis, and the PITSS is in brain metastasis than GBM (Fig. 3, 4).Discussion
Our findings suggest that there were different characteristics of ITSS between GBM and brain metastasis on SWI due to the profound difference in histologic feature of capillary between the two tumor types. The CITSS within the GBM represents the complex immature neovascularity and blood leakage and PITSS in the metastasis represents the mechanical disruption of the BBB lack capillaries and prominent feeding or draining vessels.Conclusion
Differentiation could be achieved between GBMs and brain metastases using the ITSS distribution pattern of the brain tumors.Acknowledgements
No acknowledgement found.References
1. Sherwood PR, Stommel M, Murman DL, Given CW, Given BA. Primary malignant brain tumor incidence and medicaid enrollment. Neurology 2004; 62:1788–1793. 2. Ranjan T, Abrey LE. Current management of metastatic brain disease. Neurotherapeutics 2009; 6:598–603. 3. Crisi G, Orsingher L, Filice S. Lipid and macromolecules quantitation in differentiating glioblastoma from solitary metastasis: a short-echo time single-voxel magnetic resonance spectroscopy study at 3 T. J Comput Assist Tomogr 2013 Mar-Apr;37(2):265-271. 4. Bauer AH, Erly W, Moser FG, Maya M, Nael K. Differentiation of solitary brain metastasis from glioblastoma multiforme: a predictive multiparametric approach using combined MR diffusion and perfusion. Neuroradiology 2015 Jul;57(7):697-703. 5. Rojiani AM, Dorovini-Zis K. Glomeruloid vascular structures in glioblastoma multiforme: an immunohistochemical and ultrastructural study. J Neurosurg 1996;85:1078–1084. 6. Long DM. Capillary ultrastructure in human metastatic brain tumors. J Neurosurg 1979;51:53–58. 7. El-Koussy M, Schroth G, Gralla J, Brekenfeld C, Andres RH, Jung S, et al. Susceptibility-weighted MR imaging for diagnosis of capillary telangiectasia of the brain. AJNR Am J Neuroradiol 2012 Apr;33(4):715-720. 8. Haacke, E. M., Y. Xu, Y. C. Cheng, and J. R. Reichenbach. Susceptibility weighted imaging (SWI). Magn Reson Med 2004; 52:612–618. 9. Sehgal, V., Z. Delproposto, D. Haddar, E. M. Haacke, A. E. Sloan, L. J. Zamorano, et al. Susceptibility-weighted imaging to visualize blood products and improve tumor contrast in the study of brain masses. J Magn Reson Imaging 2006; 24:41–51. 10. Tate AR, Underwood J, Acosta DM, Julia–Sape M, Majos C, Moreno–Torres A, et al. Development of a decision support system for diagnosis and grading of brain tumours using in vivo magnetic resonance single voxel spectra. NMR Biomed 2006;19:411-434.Figures
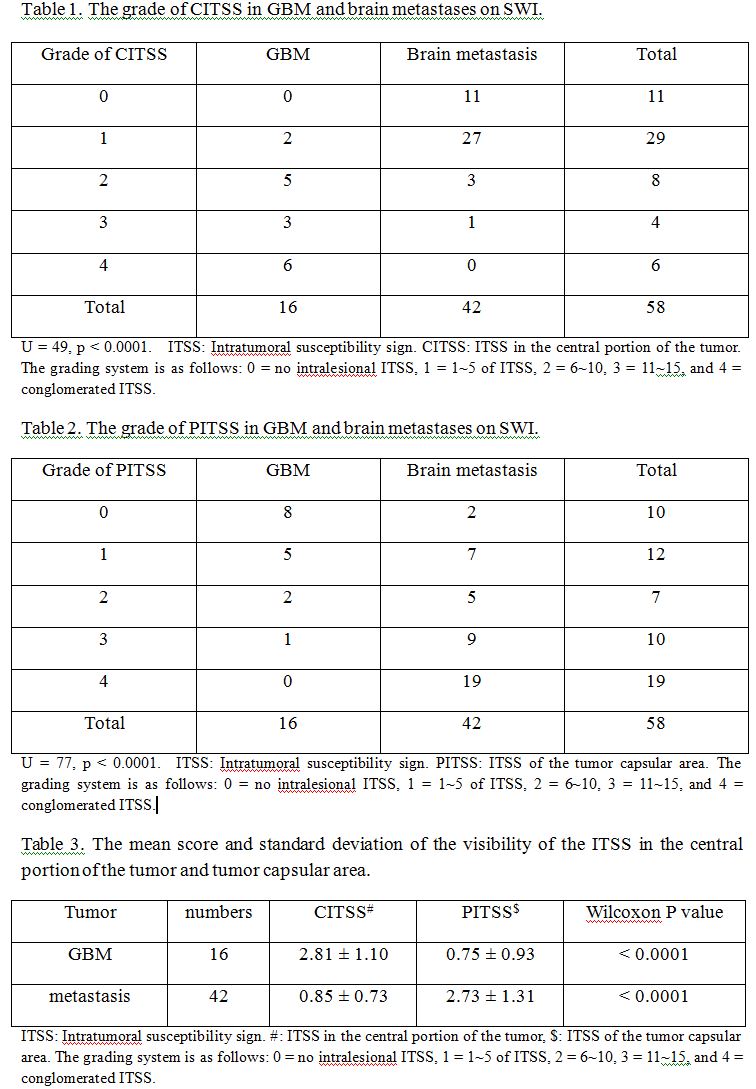
Table 1, 2, 3.
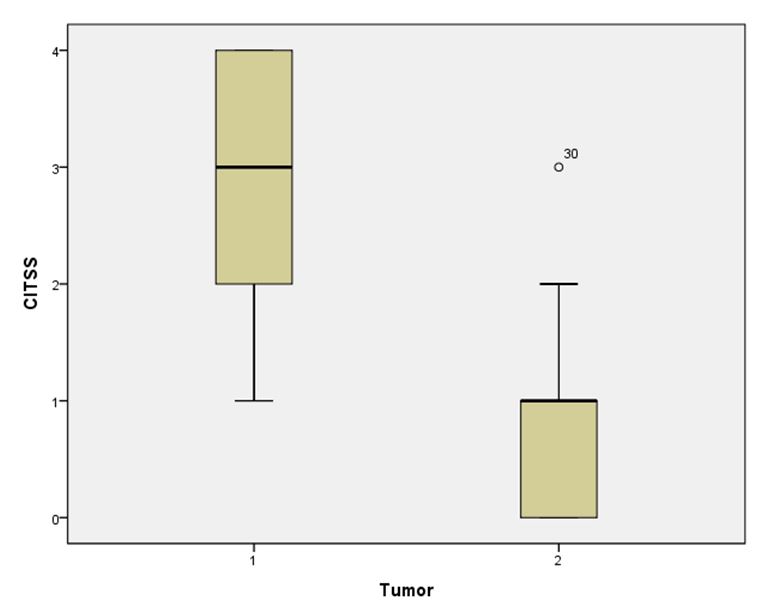
Figure
1. Graphical illustration of
the relative grading score of the visibility the ITSS in the central portion of
the tumors (1: Glioblastoma multiforme, 2: Brain metastasis).
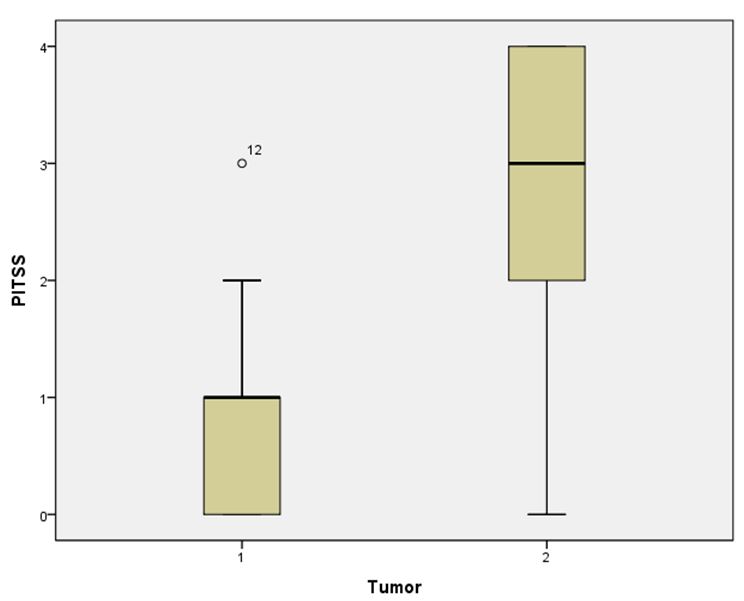
Figure
2. Graphical illustration of the
relative grading score of the visibility the ITSS in the central portion of the
tumors (1: Glioblastoma multiforme, 2: Brain metastasis).
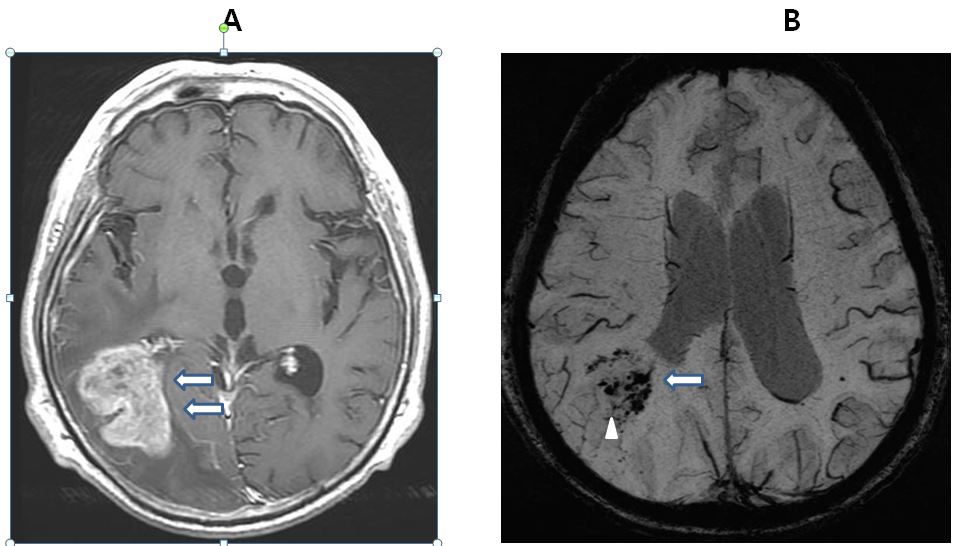
Figure
3. 82 year old male patient with Glioblastoma Multiforme.
A:
Postcontrast T1 shows intratumoral heterogeneity (arrow). Strong enhancement
sharply delineates the margins of the lesion.
B:
SWI shows Grade 4 CITSS indicates conglomerated ITSS (arrow head) and Grade 2
PITSS (arrow).
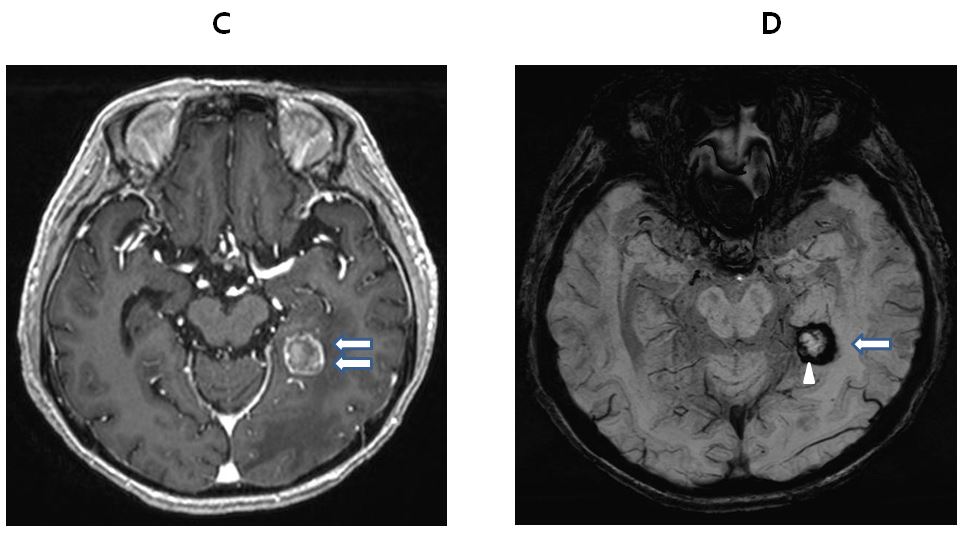
Figure
4. 84 year old male patient with non small cell lung cancer brain metastasis.
A:
Postcontrast T1 shows an intense enhancement, except in a small area, which is
probably hemorrhagic foci with good degree tumor margin delineation (arrow).
B:
SWI shows Grade 0 CITSS indicates no dot-like or linear low intensity
structures (arrow head) and Grade 4 PITSS (arrow).