2152
The diagnostic value of postcontrast susceptibility-weighted imaging in the assessment of intracranial brain neoplasm at 3THyunkoo Kang1
1Department of Radiology, Seoul Veterans Hospital, Seoul, Republic of Korea
Synopsis
The aim of this study is to estimate the diagnostic value of postcontrast susceptibility-weighted imaging (CESWI) in the assessment of intracranial brain neoplasm at 3 T MRI. Our results showed that the SWI can be performed after gadolinium injection without information loss or signal change and the CESWI clearly visualized the characteristics and the architecture of brain neoplasm. The CESWI can be a match to the CET1 with regard to the visibility of tumor margin and internal architecture in intracranial tumors without information loss or signal change.
Introduction
Susceptibility weighted image (SWI) is sometimes performed with intravenous Gadolinium (Gd). A high concentration of the paramagnetic contrast medium may influence the SWI data due to T2 shortening and additional signal loss. In fact, unlike other MRI sequences, both enhancement and signal cancellation may be seen on contrast enhanced SWI (CESWI), depending on the condition of the pathological lesion. However, El-Koussy et al. showed that no quality degradation or signal contamination was observed after Gd injection. The aim of this study is to estimate the diagnostic value of CESWI in the assessment of intracranial brain neoplasm at 3 T MRI.Methods
35 brain neoplasm patients (6 women and 29 men, 52-83 years old (mean 68.9 years) at the time of diagnosis, 24 with metastases, and 11 with glioblastoma multiforme (GBM) s) were enrolled in this study. To investigate the effect of gadolinium on SWI image, an evaluation of the frequency of the intratumoral susceptibility signals (ITSS) in the SWI and CESWI was performed by visual assessment. We evaluated the visibility of the tumor margins and of the internal architecture of the tumors on postcontrast T1 weighted images (CET1), SWI, and CESWI to compare the diagnostic values of CET1, SWI, and CESWI.Results
There was no statistically significant difference of the frequency of the ITSS between SWI and CESWI (Table 1). The CET1 and CESWI were statistically superior to the SWI with regard to the visibility of the tumor margins of the GBMs. The CESWI was statistically superior to the SWI with regard to the visibility of the tumor margins of the brain metastases (p < 0.05, Wilcoxon signed rank test)(Table 2-4). Statistically significant differentiation was achieved between brain metastases and GBMs using the grading of the visibility of the tumor margins and the internal architecture of the tumors in the CESWI and using the grading of the visibility of the tumor margins in the CET1 scan (p < 0.05, Mann-Whitney test)(Table 5).Discussion
Our results showed that the SWI can be performed after gadolinium injection without information loss or signal change and the CESWI clearly visualized the characteristics and the architecture of brain neoplasm. Precontrast SWI showed better visibility of internal architecture in GBMs than brain metastases, but better visibility of tumor margin in brain metastases than in GBMs. These findings suggest that there were different characteristics between GBMs and brain metastases on SWI due to the profound difference in histologic feature of capillary between the two tumor types. The visibility of internal architecture of the GBM represents the complex immature neovascularity and blood leakage and the visibility of tumor margin in the metastasis represents the mechanical disruption of the BBB lack capillaries and prominent feeding or draining vessels. Intracranial tumor detection involves the use of the postcontrast images to find lesions of enhancement that result from contrast material deposition due to a blood–brain barrier breakdown or increased lesion vascularity. Tumor margins are often seen as high signal on postcontrast images because of prominent feeding or draining vessels. Enhancement of the tumor core varies according to its compositions. In our study, the CET1 and CESWI were statistically equivalent to each other for the analysis of the internal architecture and tumor margin. The CESWI was statistically superior to the SWI with regard to the visibility of tumor margin in brain metastases and GBM. The CET1 was statistically superior to the SWI with regard to the visibility of tumor margin in brain metastases. On statistical analysis of the pathological comparison of the grading of the visibility of tumor margins and the internal architecture of tumors, the CESWI showed better visibility of tumor margin as well as internal architecture in GBMs than in brain metastases. The CET1 showed also better visibility of tumor margin as well as internal architecture in GBMs than in brain metastases. These findings suggest that the GBMs have more prominent blood–brain barrier breakdown or increased lesion vascularity and more feeding or draining vessels than brain metastases.Conclusion
The CESWI can be a match to the CET1 with regard to the visibility of tumor margin and internal architecture in intracranial tumors without information loss or signal change.Acknowledgements
No acknowledgement found.References
1. El-Koussy M, Schroth G, Gralla J, Brekenfeld C, Andres RH, Jung S, et al. Susceptibility-weighted MR imaging for diagnosis of capillary telangiectasia of the brain. AJNR Am J Neuroradiol. 2012 Apr;33(4):715-720. 2. Pinker K, Noebauer-Huhmann IM, Stavrou I, Hoeftberger R, Szomolanyi P, Weber M, et al. High-field, high-resolution, susceptibility-weighted magnetic resonance imaging: improved image quality by addition of contrast agent and higher field strength in patients with brain tumors. Neuroradiology. 2008 Jan;50(1):9-16. Epub 2007 Sep 18. 3. Rauscher A, Sedlacik J, Barth M, Mentzel HJ, Reichenbach JR. Magnetic susceptibility-weighted MR phase imaging of the human brain. Am J Neuroradiol 2005;26:736–742. 4. Hsu CC, Watkins TW, Kwan GN, Haacke EM. Susceptibility-Weighted Imaging of Glioma: Update on Current Imaging Status and Future Directions. J Neuroimaging. 2016 Jul;26(4):383-390. 5. Hori M, Ishigame K, Kabasawa H, Kumagai H, Ikenaga S, Shiraga N, et al. Precontrast and postcontrast susceptibility-weighted imaging in the assessment of intracranial brain neoplasms at 1.5 T. Jpn J Radiol. 2010 May;28(4):299-304. 6. Franceschi AM, Moschos SJ, Anders CK, Glaubiger S, Collichio FA, Lee CB, et al;. Use of Susceptibility-Weighted Imaging (SWI) in the Detection of Brain Hemorrhagic Metastases from Breast Cancer and Melanoma. J Comput Assist Tomogr. 2016 Sep-Oct;40(5):803-805. 7. Lin W, Mukherjee P, An H, Yu Y, Wang Y, Vo K, et al. Improving high-resolution MR bold venographic imaging using a T1 reducing contrast agent. J Magn Reson Imaging. 1999 Aug;10(2):118-123.Figures
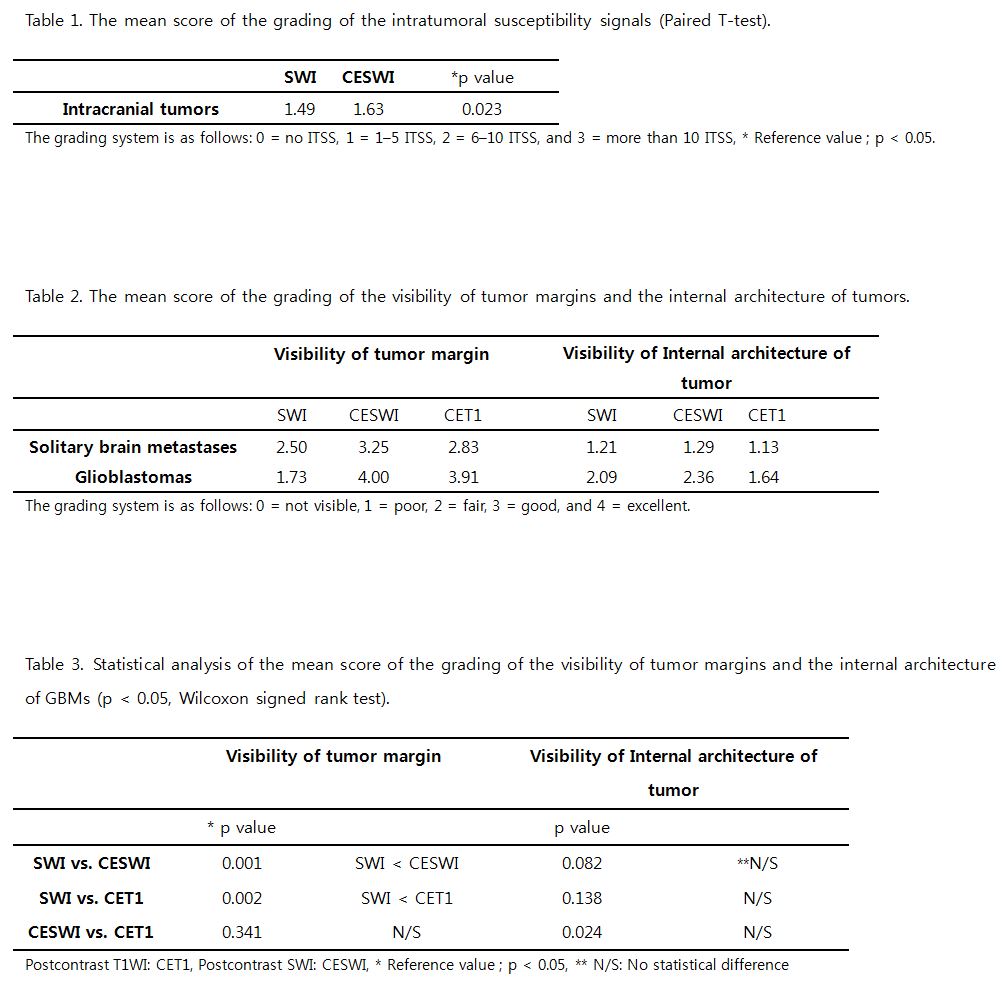
Table 1, 2, 3.
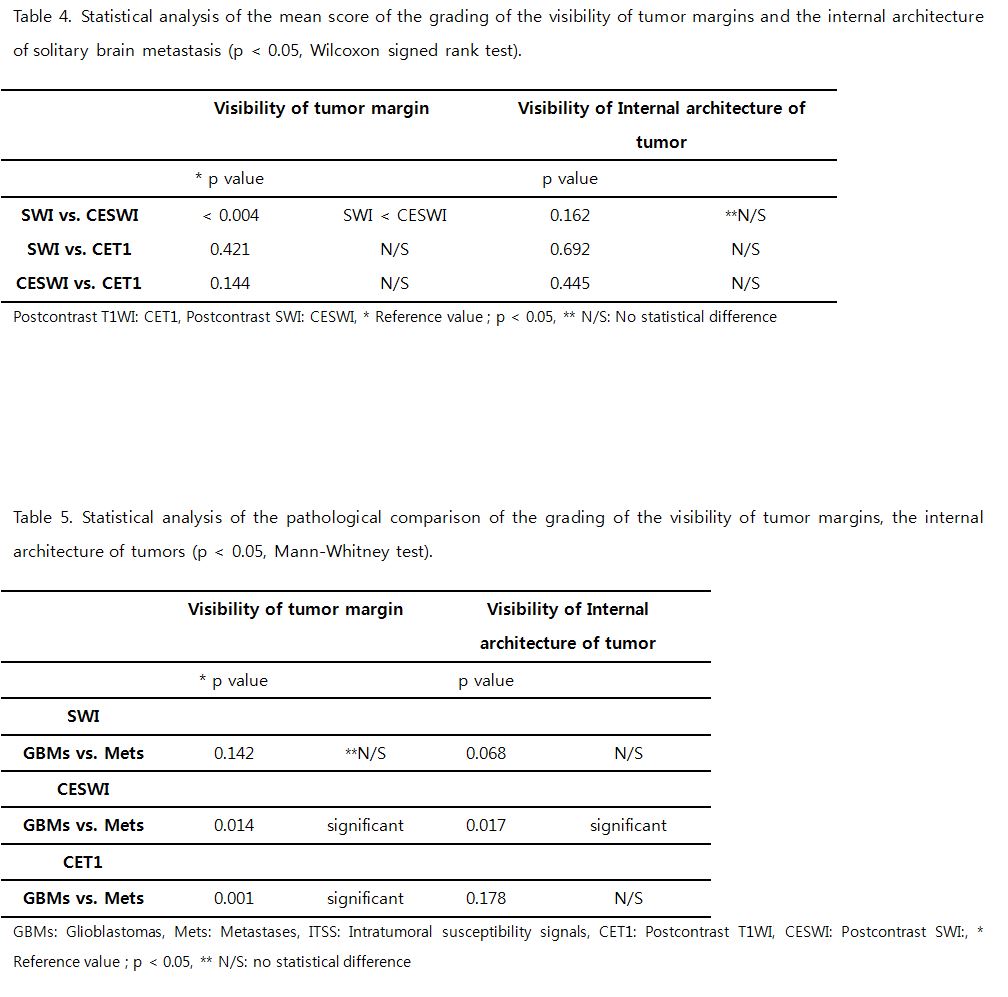
Table 4, 5.
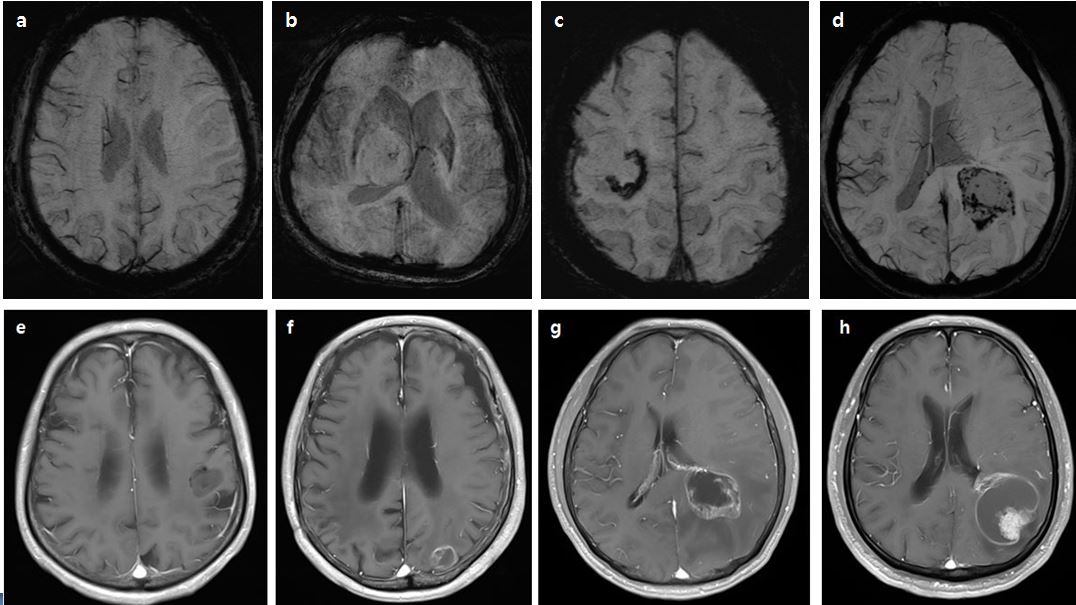
Figure 1. The grades of visibility of tumor margin on SWI (A-D)
(arrows) and the grades of visibility of internal structure on CET1 (E-H).
Grade 0 is defined as no pertinent imaging characteristics, Grade 1 as poorly
visualized characteristics, Grade 2 as fairly visualized characteristics ,
Grade 3 as good visualized characteristics and Grade 4 as well defined, easily
interpreted characteristics.
Figure
2. Male 72-year-old patient with glioblastoma.
A:
The lesion is barely visible with poor degree tumor margin delineation on T1 (arrow).
B:
Postcontrast T1 shows intratumoral heterogeneity (arrow). Strong enhancement
sharply delineates the margins of the lesion (grade 4).
C:
Grade 2 ITSS indicates 6-10 dot-like or linear low intensity structures on SWI (arrow
head).
D:
Postcontrast SWI shows the internal structure and the margins of the lesion
more clearly than noncontrast SWI (arrow).
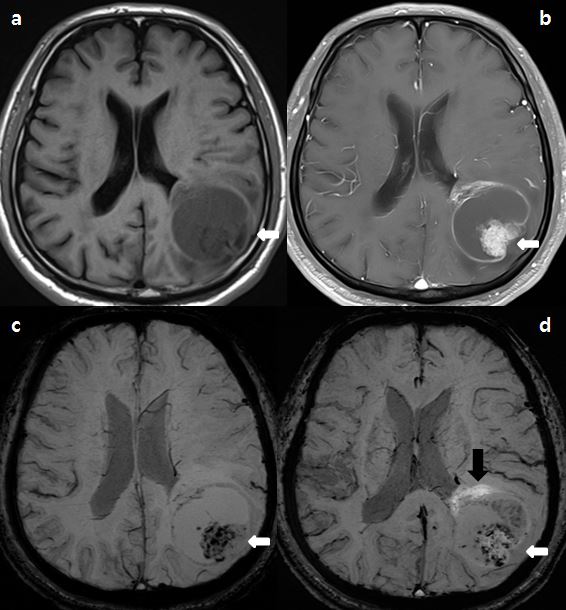
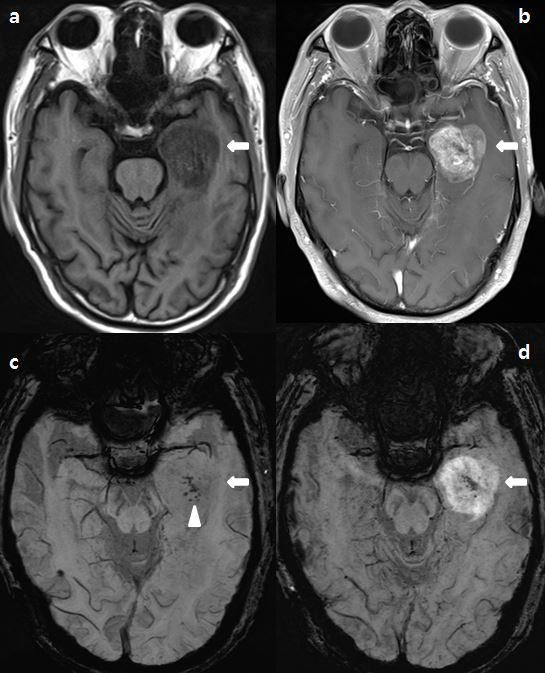
Figure
3. Male 68-year-old patient with
metastasis of lung adenocarcinoma.
A:
The lesion is barely visible with poor degree tumor margin delineation on T1 (arrow).
B:
Postcontrast T1. Strong enhancement sharply delineates the margins of the
lesion (grade 4). Intense enhancing solid component and no enhancing necrotic
portion are seen (arrow).
C:
Marked hypointense foci are seen in a solid part of the lesion on SWI,
suggesting an increased venous vasculature and hemorrhages (arrow).
D:
Postcontrast SWI. Low signal foci are visible, which are interpreted to be
hemorrhage with good degree tumor margin (arrow). Moreover, bright enhancement
indicating both tumor parenchyma and breakdown of the blood-brain barrier are
seen along the tumor (black arrow).