2151
Comparison of R2* and quantitative susceptibility mapping in the characterizing tumor hypoxia in a mouse model of glioblastoma1Radiology, University of Calgary, Calgary, AB, Canada, 2Clinical Neuroscience, University of Calgary, Calgary, AB, Canada
Synopsis
Hypoxia (low levels of oxygen) is an important biomarker in many solid tumors, as it is responsible for promoting tumor angiogenesis and resistance to radiotherapy. Hypoxia can be indirectly monitored by measuring levels of deoxyhemoglobin with MRI, using either R2* or quantitative susceptibility mapping (QSM). We compared the two methods for brain tumor and hypoxia imaging in a mouse model of glioblastoma. We found that both methods were sensitive at detecting a decrease in deoxyhemoglobin due to 100% oxygen. However, QSM provided better anatomical information and was better at detecting tumor heterogeneity. QSM is a promising tumor imaging method.
Purpose
Hypoxia (low levels of oxygen) has a high prevalence and is an important biomarker in glioblastoma (GBM), one of the most aggressive brain cancers (1). Hypoxia can be indirectly probed in brain tumors by measuring the susceptibility induced by deoxyhemoglobin, with both R2* and quantitative susceptibility mapping (QSM). However, it is not clear which is superior for detection of hypoxia. The goal of our study is to compare the two MRI methods to determine their ability to detect changes in oxygenation in a mouse model of GBM. We used a 9.4T and a mouse model of GBM to compare R2* and QSM sensitivity at detecting a hyperoxia challenge.Methods
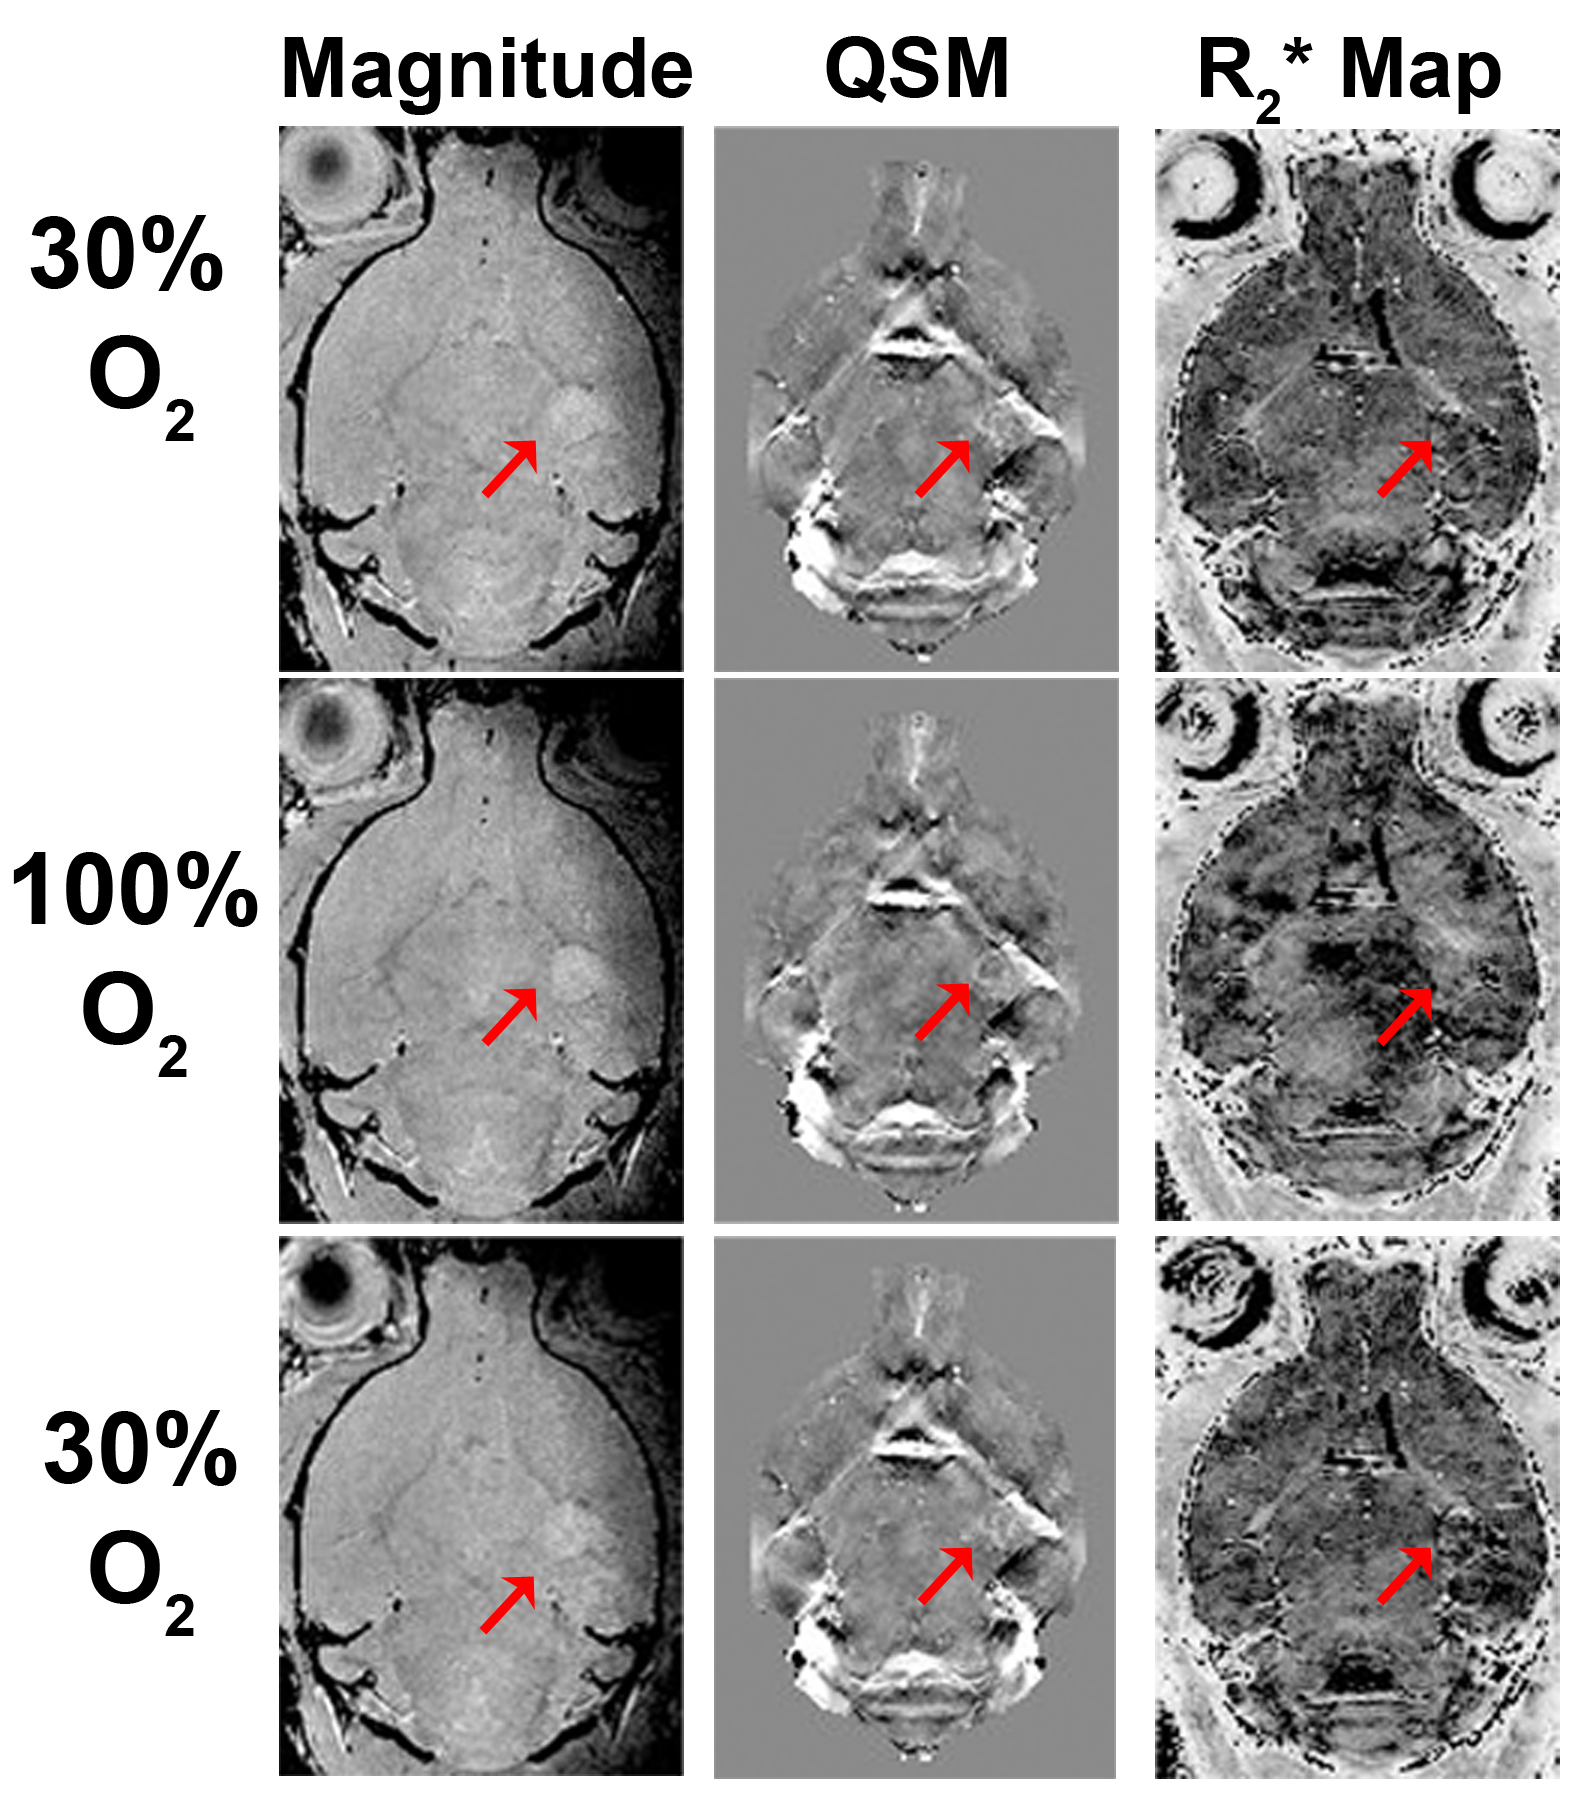
We implanted 25,000 mouse brain tumor initiating cells (BTICs) into the right striatum of 8-10 week old syngeneic C57BL/6 mice. MRI was performed with a 9.4T MRI (BRuker) and a helium cooled cryocoil. A 3D multiecho gradient echo sequence (TR/TE/α = 100ms/3.1, 7.1, 11.1, 15.1, 19.1 ms/15o, voxel size = 0.100mm isotropic; total acquisition time = 25.6 minutes) was used to generate QSM as well R2* maps. The acquisition was first collected at 30% O2/70% N2. The gas mixture was then switched to 100% O2. Pure oxygen (as opposed to carbogen) was used because of the goal of translation and the fact that it is better tolerated in patients. Subsequently, we switched back to 30% O2/70% N2. We waited 5 minutes in between each scan to allow the blood gas to stabilize. R2* map was generated using ImageJ with a mono-exponential fit. For QSM processing, the mouse brain binary mask was extracted semi-automatically using ITK-SNAP software. Raw phase images from 5 echo times were unwrapped using PRELUDE from FSL, followed by 2π jumps correction between echoes. A total field map was generated by applying a magnitude weighted least square fitting to the unwrapped phase maps. Background field was removed using the RESHARP ("Regularization Enabled Harmonic Artefact Reduction for Phase data") method (2), with the spherical kernel size of 300um and the Tikhonov regularization parameter of 5x10⁻⁴. Susceptibility map were obtained using the iLSQR method from the STI suite (3). The anatomical image was used to draw regions of interest, which was then transferred to the QSM and R2* maps for voxel based analysis using in house MATLAB software.Results
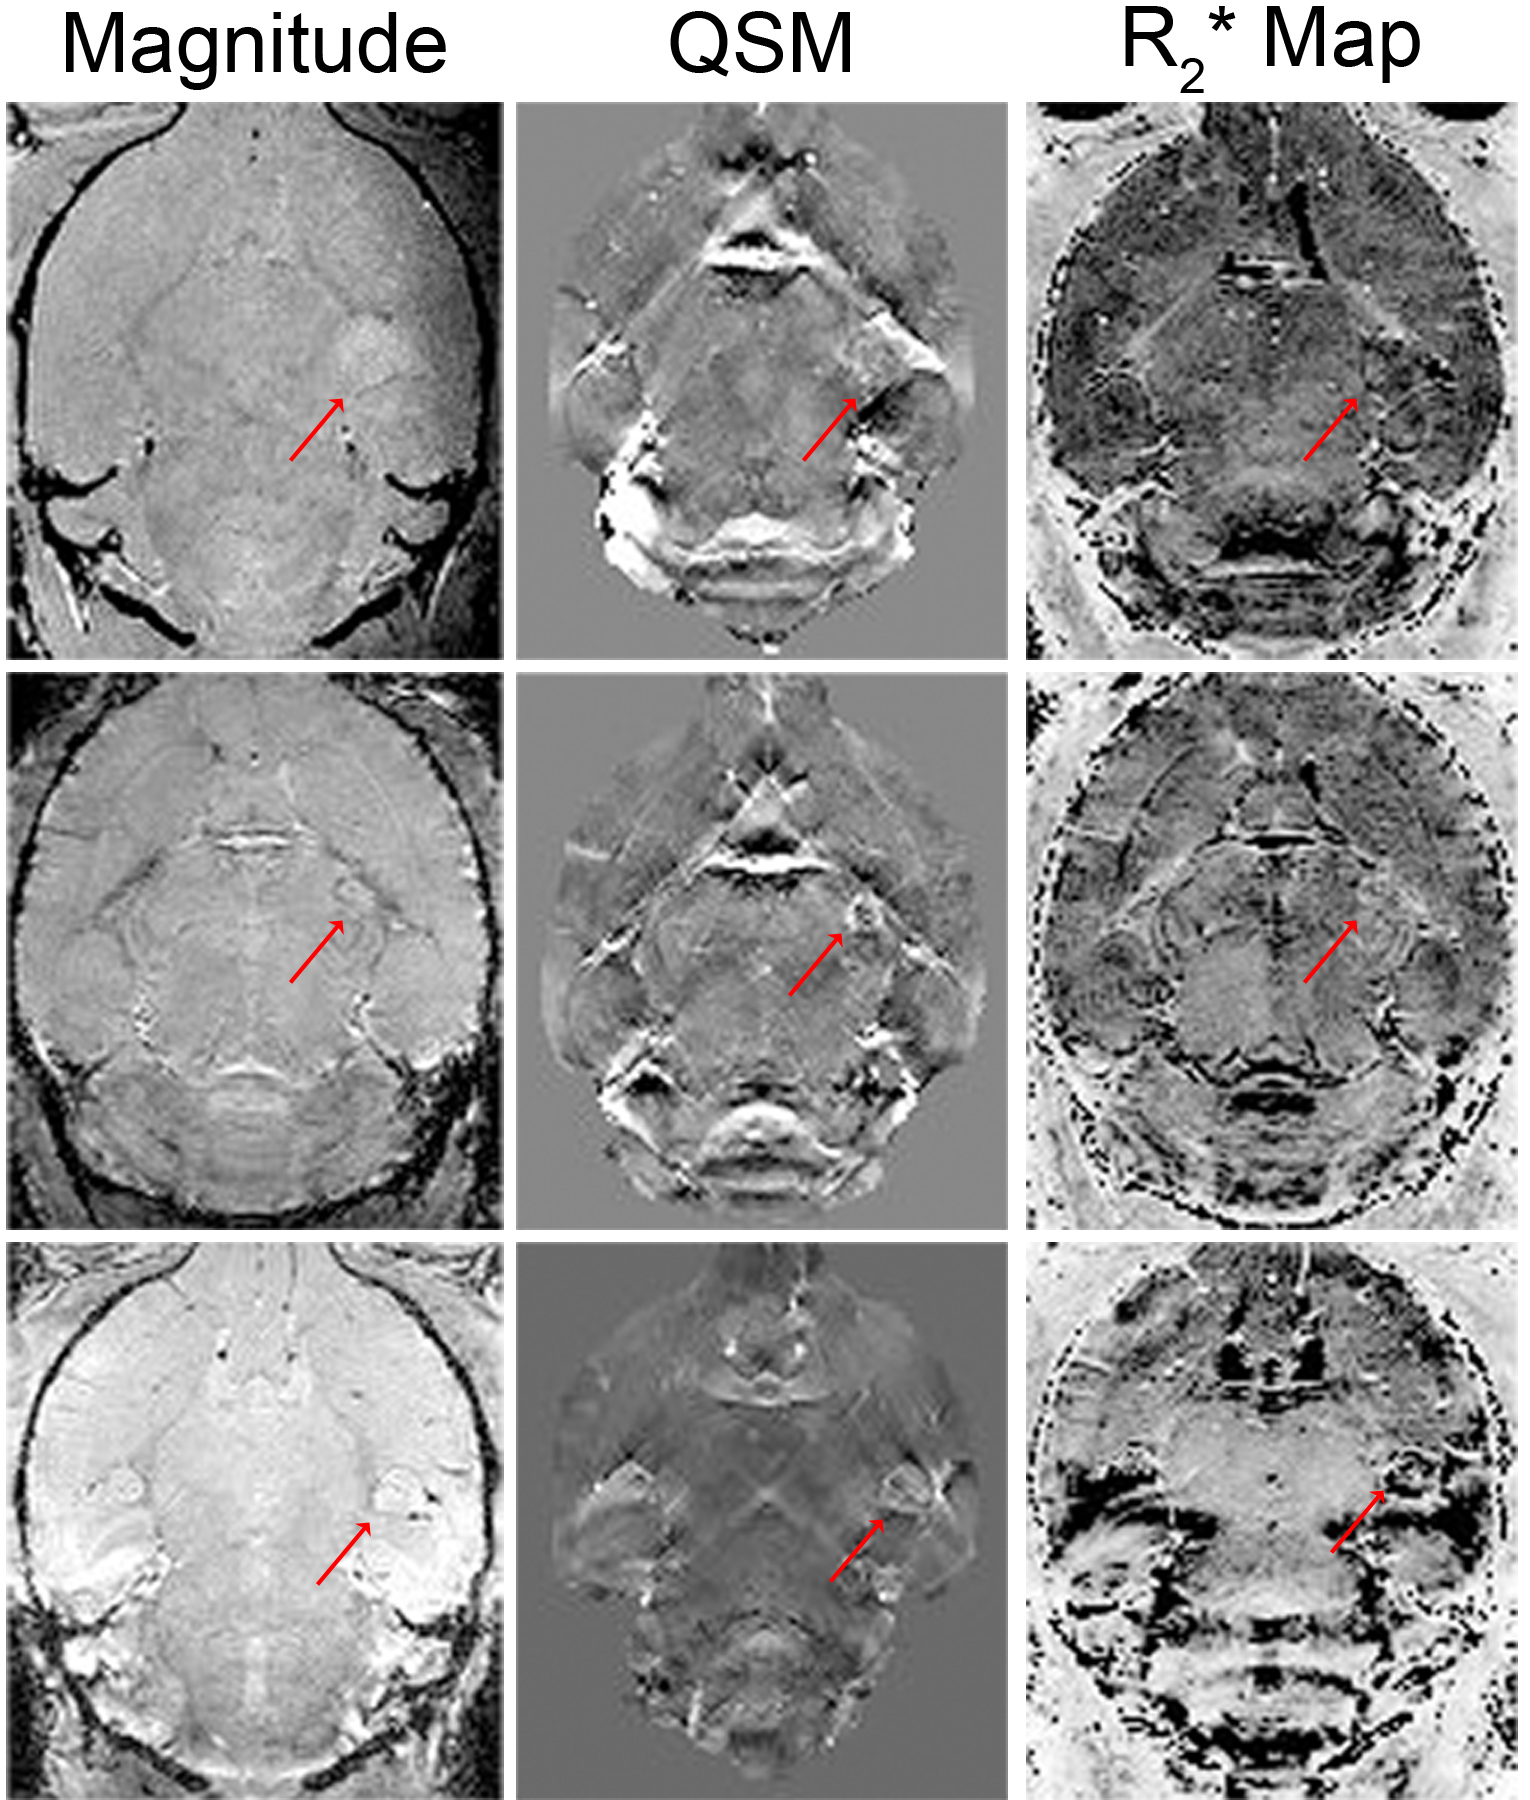
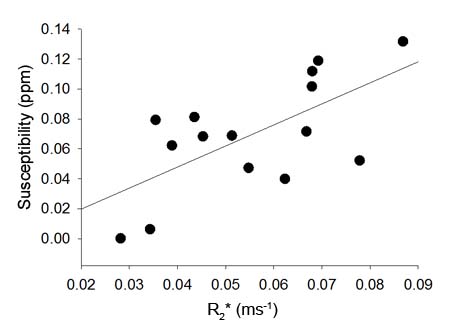
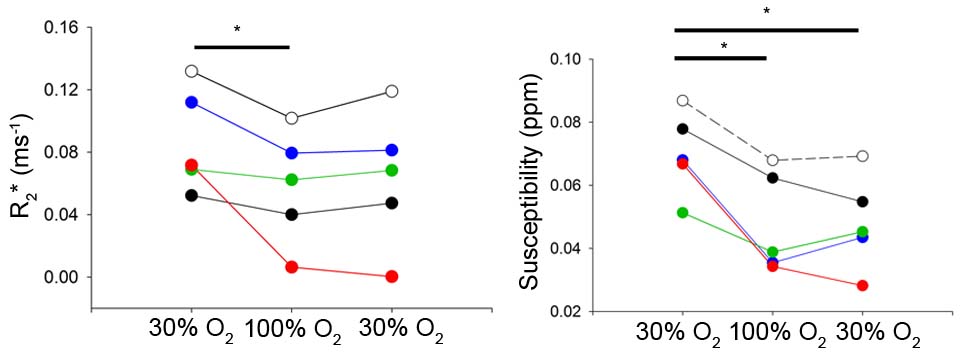
Quantitative susceptibility maps showed anatomy better than to R2* maps, as the tumor can be delineated on QSM, but was not very distinct on R2* (Figure 1). There was a significant correlation between absolute R2* and susceptibility (Figure 2, r = 0.692, p<0.001). Since tumors usually exhibit edema, we chose to look at only the hypoxic voxels of the tumor. We classified hypoxia as any voxel in the tumor that was 1 standard deviation below the mean of the tumor at normoxia. After giving 100% oxygen, there was a significant decrease in susceptibility as well as R2* (p<0.05, ANOVA with post-hoc tukey’s test) in the hypoxic voxels (Figure 3 and 4).Discussion
QSM showed anatomy better than R2* maps, as it was able to better detect the tumor as well as differentiate grey and white matter in the cerebellum. In addition, QSM enabled better visualization of the heterogeneity in the tumor compared to both the magnitude image as well as the R2* map. There was a decrease in R2* as well as susceptibility after pure oxygen, indicating that both methods detected a decrease in deoxyhemoglobin levels. There was a good correlation between measurements of susceptibility and R2*, as expected. The fact that susceptibility and R2* did not return to baseline was likely due to the possibility that 5 minutes was not enough time for tumor oxygen to return to baseline.Conclusion
Both R2* as well as QSM had similar ability to detecting the decrease in tumor deoxyhemoglobin in response to pure oxygen and they had good correlation with one another other. QSM gives better anatomical information compared to R2* and the magnitude image, which could be useful to visualize tumor heterogeneity. Although R2* has been used repeatedly for studies of hypoxia in GBM, it is clear that QSM has advantages and may be a useful addition for assessing heterogeneity in brain tumors.Acknowledgements
This study is funded by Alberta Innovates Health Solutions - Alberta Cancer Foundation Collaborative Research and Innovative Opportunities grant, Brain Canada Platform grant, and Alberta Innovates Health Solutions MD-PhD studentshipReferences
1. Singh, S.K., et al., Identification of human brain tumour initiating cells. Nature, 2004. 432(7015): p. 396-401.
2. Sun H, Wilman AH. Background field removal using spherical mean value filtering and Tikhonov regularization. Magn. Reson. Med. 2014; 71(3): 1151–1157.
3. Li W, Wang N, Yu F, Han H, Cao W, Romero R, Tantiwongkosi B, Duong TQ, Liu C. A method for estimating and removing streaking artifacts in quantitative susceptibility mapping. Neuroimage, 2015; 108: 111–122.
Figures