2150
Multiparametric metabolic and physiologic MR-Imaging models for differentiating tumor from treatment effects in patients suspected of recurrent glioblastoma1Department of Radiology and Biomedical Imaging, UCSF, San Francisco, CA, United States
Synopsis
Despite previous research on physiological and metabolic MR imaging techniques with standard clinical anatomical MRI of patients with recurrent glioma, there is still no one parameter that can differentiate recurrent glioblastoma (rGBM) from treatment-induced effects (TxE) with high enough accuracy to be used clinically. We assessed the value of incorporating anatomical, perfusion-weighted, diffusion-weighted, and spectroscopic imaging parameters to identify TxE in patients suspected of rGBM. nPH from DSC perfusion-weighted imaging and Choline-to-NAA Index from MR spectroscopic imaging were found to be the most related to pathological markers of tumor and TxE.
Introduction & Impact
No one MR-imaging parameter can differentiate recurrent glioblastoma (rGBM) from treatment-induced effects (TxE) with high enough accuracy to be used clinically.[1] Because these conditions have vastly different management strategies, there is urgent need to increase the sensitivity to determine presence of TxE that is indistinguishable from rGBM on routine anatomical MR imaging. The goal of this study is to use multi-parametric MRI and mixed-effects models to determine the link between metabolic and physiologic imaging metrics and pathologically confirmed tissue samples of TxE (as indicated by low tumor score and ki67) and rGBM.Methods
Patients & Samples: 48 patients with an original diagnosis of high-grade glioma were included in this study. Each patient was recruited prior to resection for suspected rGBM. A total of 100 samples were used for analysis. Each sample was evaluated for the presence of tumor (tumors score 0-3) and ki67 for cellular proliferation.
Image Acquisition: Patients were scanned on a 3T GE scanner with an 8-channel head coil. Standard anatomic imaging included T2-weighted FLAIR and FSE as well as T1-weighted pre- and post-gadolinium contrast images. Diffusion-weighted imaging (DWI), DSC perfusion-weighted imaging with T2*-weighted EPI images (TR/TE/flip angle = 1250–1500/35–54ms/30–35degrees, 128×128matrix, slice thickness=3–5mm, 60–80 timepoints), and 3D MRSI using PRESS volume localization and VSS pulses for lipid signal suppression (TR/TE =1104/144ms, FOV=16×16×16cm3, nominal voxel size=1×1×1cm3) were also acquired.
Image Processing: After aligning all images, maps of the normalized apparent diffusion coefficient (nADC) and normalized fractional anisotropy (nFA) were generated on a voxel-by-voxel basis after TOPUP distortion correction from the DWI. Normalized cerebral blood volume (nCBV), percent deltaR2* signal recovery (recov), and normalized deltaR2* peak height (nPH) were calculated from an average curve at the biopsy location using software developed by our lab. Lactate-edited MRSI data were reconstructed and the signal from the individual channels combined to quantify lactate (Lac) and lipid (Lip) levels. The z-scores of the Cho-to-NAA index (CNI) and the Cho-to-Cr index (CCRI) were generated from a linear regression–based algorithm. [2]
Statistical Analyses: Three outcomes were explored for their utility in distinguishing TxE from rGBM: 1) A binomial tumor score binning TS 0 with TS 1 and TS 2 with TS 3; 2) A multinomial tumor score 0 through 3; and 3) A continuous score of the proliferation index Ki-67. Wilcoxon rank sum tests or Kruskal-Wallis rank tests were used to evaluate significance between low and high TS or among tumor score (0-3) categories for each imaging feature. For the binomial outcome analyses, generalized equation estimations (GEE) were implemented using the geepack package in R with patient as a random effect [3], while the multgee package was used for multinomial outcomes. Linear mixed-effects models were employed to relate each imaging feature to ki67 using the nlme package in R. For all models, univariate analyses were first performed for each imaging metric and features with p<0.2 were included in the multivariate model. Step-wise model selection was performed on significant variables and the model with the smallest AIC was selected.
Results
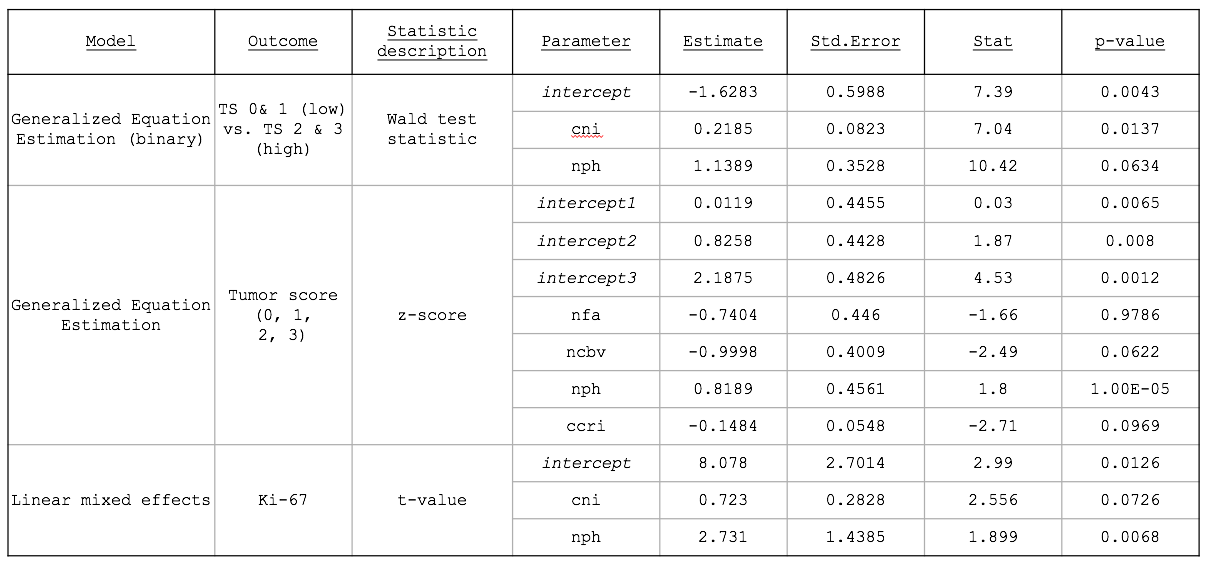
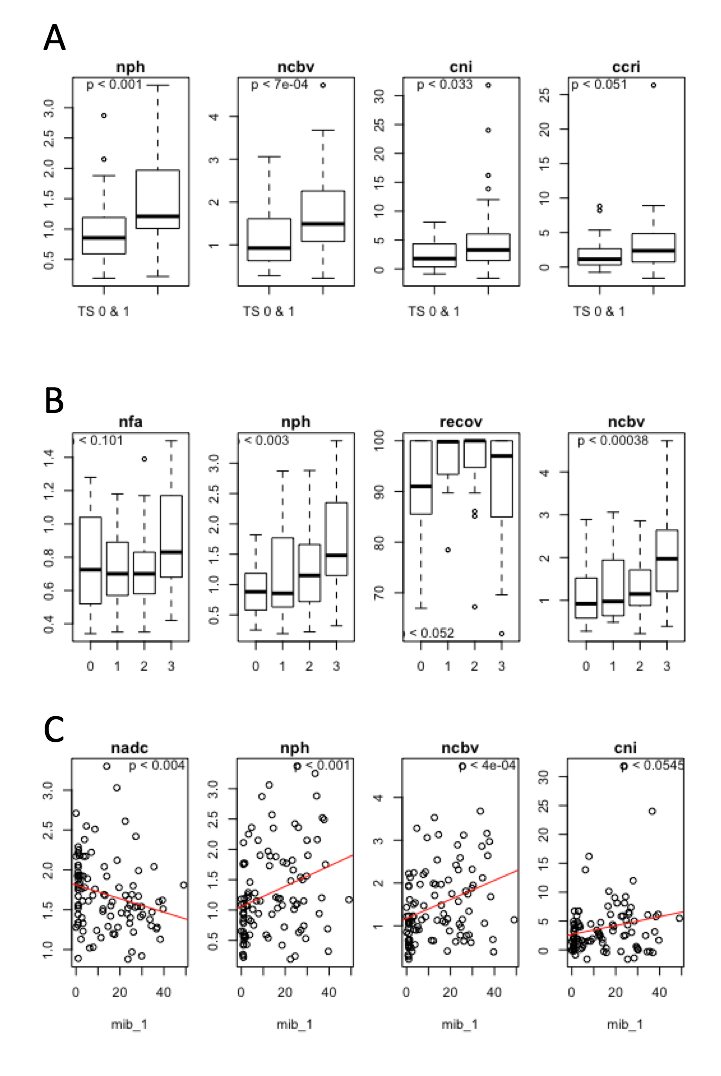
Tumor Score (high/low): Figure1A shows the differences in imaging metrics among tumor scores. nPH, nCBV, and CNI significantly distinguished between low and high tumor scores. After iterative removal of insignificant features in the multivariate analysis, only nPH and CNI remained as predictors (Table 1).
Tumor Score (0-3): Figure 1B shows differences among tumor score as an ordinal outcome. Although nFA and %recov showed trends with increasing TS, only nPH and nCBV were significant. The significance values of the coefficients that remain in the final model are listed in Table 1 and generally reflect the results we observe in the Kruskal-Wallis analysis, with the exception of CCRI, which impacts the model more than the initial evaluation suggests.
ki-67: Figure 1C shows a significant correlation between Ki-67 and nADC, nPH, nCBV and CNI. Univariate linear mixed models for each imaging feature resulted in an initial multivariate model with CCrI, CNI, nPH, nCBV and nADC included as covariates. After step-wise model selection, CNI and nPH remained in the final model, with coefficients listed in Table 1.
Conclusions
nPH from DSC-perfusion was significant in all statistical tests, with higher nPH values or more vasculature more indicative of tumor. CNI remained as a predictor in 2/3 of the analyses, highlighting its combined potential utility in modeling TxE vs rGBM. These basic statistical analyses are the first step in understanding the value in combining parameters from different imaging modalities.Acknowledgements
Funding: PO1CA118816References
[1] Verma N, Cowperthwaite MC, Burnett MG, Markey MK. Differentiating tumor recurrence from treatment necrosis: a review of neuro-oncologic imaging strategies. Neuro Oncol 2013;15(5):515-534. doi:10.1093/neuonc/nos307.
[2] McKnight TR, von dem Bussche MH, Vigneron DB, et al. Histopathological validation of a three-dimensional magnetic resonance spectroscopy index as a predictor of tumor presence. J Neurosurg 2002;97(4):794-802. doi:10.3171/jns.2002.97.4.0794.
[3] Halekoh U, Højsgaard S, Yan J. The r package geepack for generalized estimating equations. J Stat Softw 2006;15(2). doi:10.18637/jss.v015.i02.
[4] Barajas RF, Chang JS, Segal MR, et al. Differentiation of recurrent glioblastoma multiforme from radiation necrosis after external beam radiation therapy with dynamic susceptibility-weighted contrast-enhanced perfusion MR imaging. Radiology 2009;253(2):486-496. doi:10.1148/radiol.2532090007.
[5] Huang J, Wang A-M, Shetty A, et al. Differentiation between intra-axial metastatic tumor progression and radiation injury following fractionated radiation therapy or stereotactic radiosurgery using MR spectroscopy, perfusion MR imaging or volume progression modeling. Magn Reson Imaging2011;29(7):993-1001. doi:10.1016/j.mri.2011.04.004.
[6] Sugahara T, Korogi Y, Tomiguchi S, et al. Posttherapeutic intraaxial brain tumor: the value of perfusion-sensitive contrast-enhanced MR imaging for differentiating tumor recurrence from nonneoplastic contrast-enhancing tissue. AJNR Am J Neuroradiol 2000;21(5):901-909.
[7] Zeng Q-S, Li C-F, Zhang K, Liu H, Kang X-S, Zhen J-H. Multivoxel 3D proton MR spectroscopy in the distinction of recurrent glioma from radiation injury. J Neurooncol2007;84(1):63-69. doi:10.1007/s11060-007-9341-3.2.
[8] Weybright P, Sundgren PC, Maly P, et al. Differentiation between brain tumor recurrence and radiation injury using MR spectroscopy. AJR Am J Roentgenol2005;185(6):1471-1476. doi:10.2214/AJR.04.0933.
Figures