2149
Differentiating glioma histologic grade using histogram analyses of Amide Proton Transfer MRI1Department of Radiology, Zhujiang Hospital of Southern Medical University, Guangzhou, China, 2Philips Healthcare, Guangzhou, China, 3Division of MR Research, Department of Radiology, Johns Hopkins University School of Medicine, Baltimore, MD, United States
Synopsis
A correct preoperatively grading of glioma is always the important issue in clinic. APT imaging is designed to assess glioma on the level of cell and molecule. In this study we used the APT MRI histogram analyses ,to determine if it can help differentiate HGG from LGG.
Introduction
A correct preoperatively grading of glioma is always the most important issue in clinical settings. Although conventional contrast-enhanced MR imaging may indicate the degree of tumor malignancy, studies have revealed that the degree of contrast enhancement is not a reliable indicator of the tumor grade 1, 2. APT is a novel functional modalities, used to detect the amide protons of endogenous, mobile proteins and peptides in tissue. Here we explore the diagnostic performance of APT value and histogram-based APT parameters in preoperative grading of glioma.Method
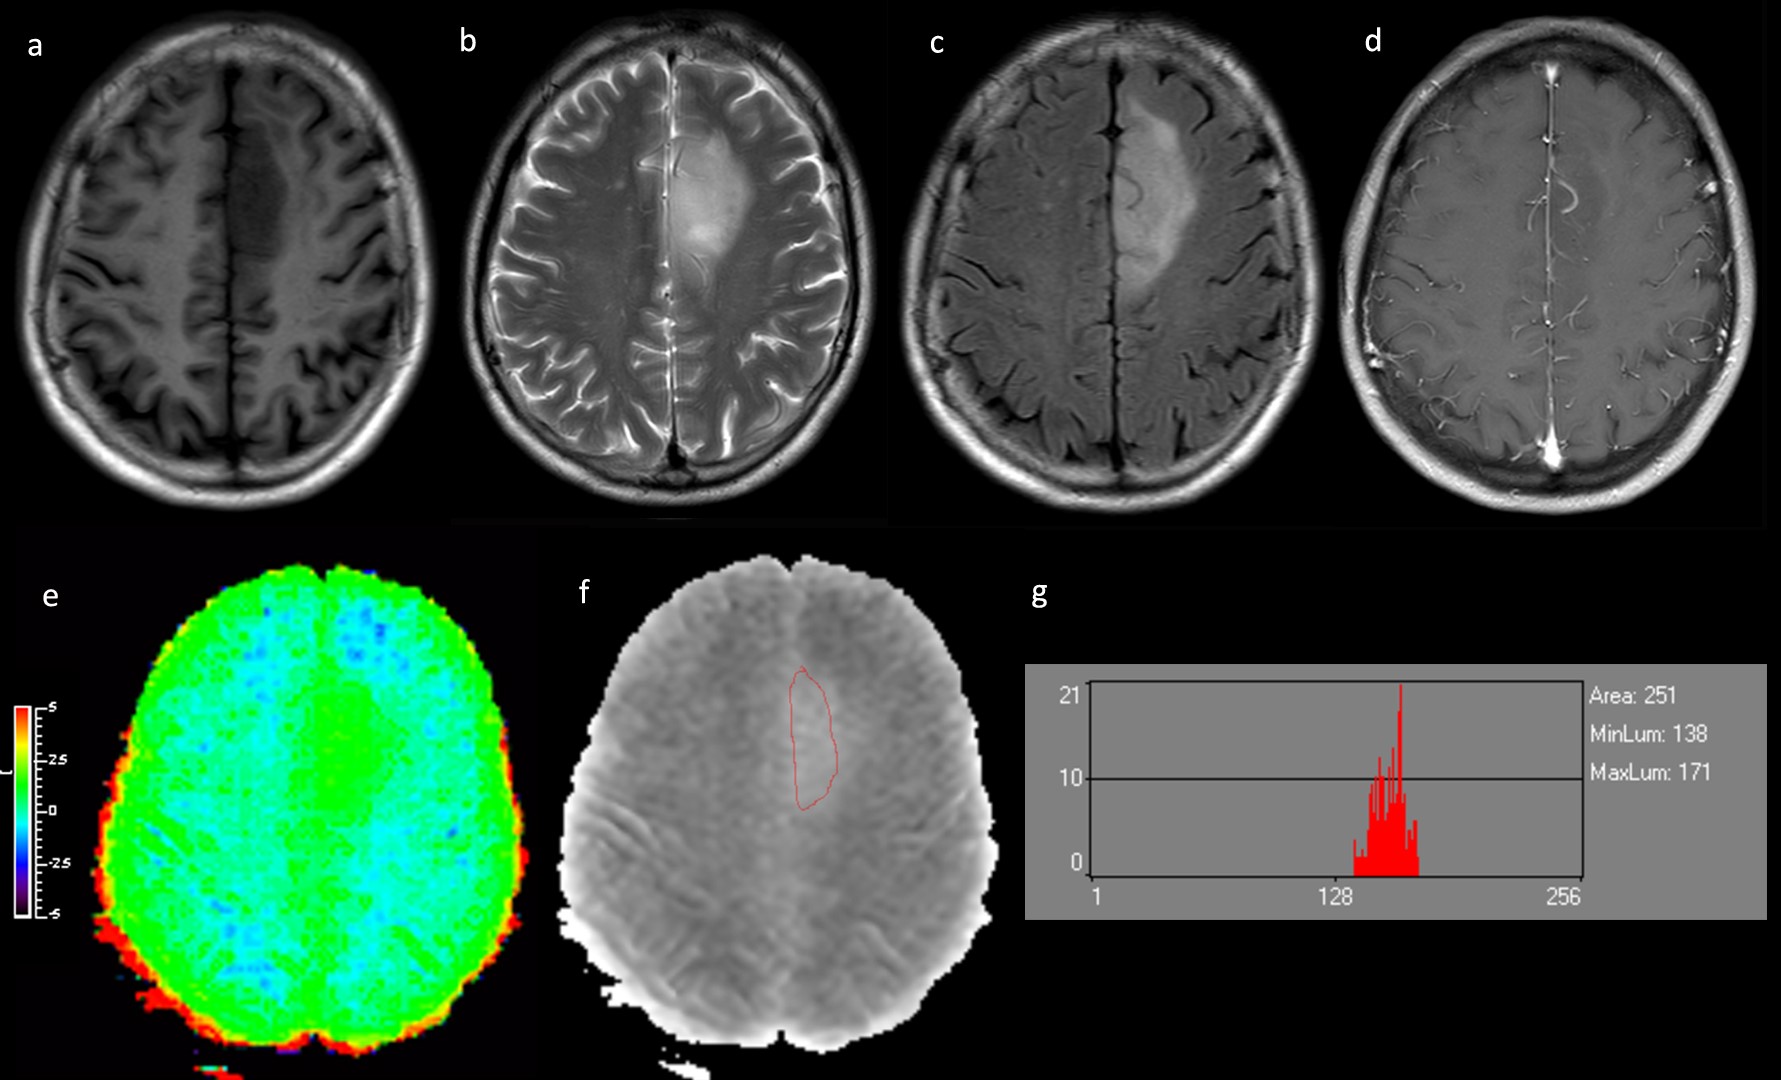
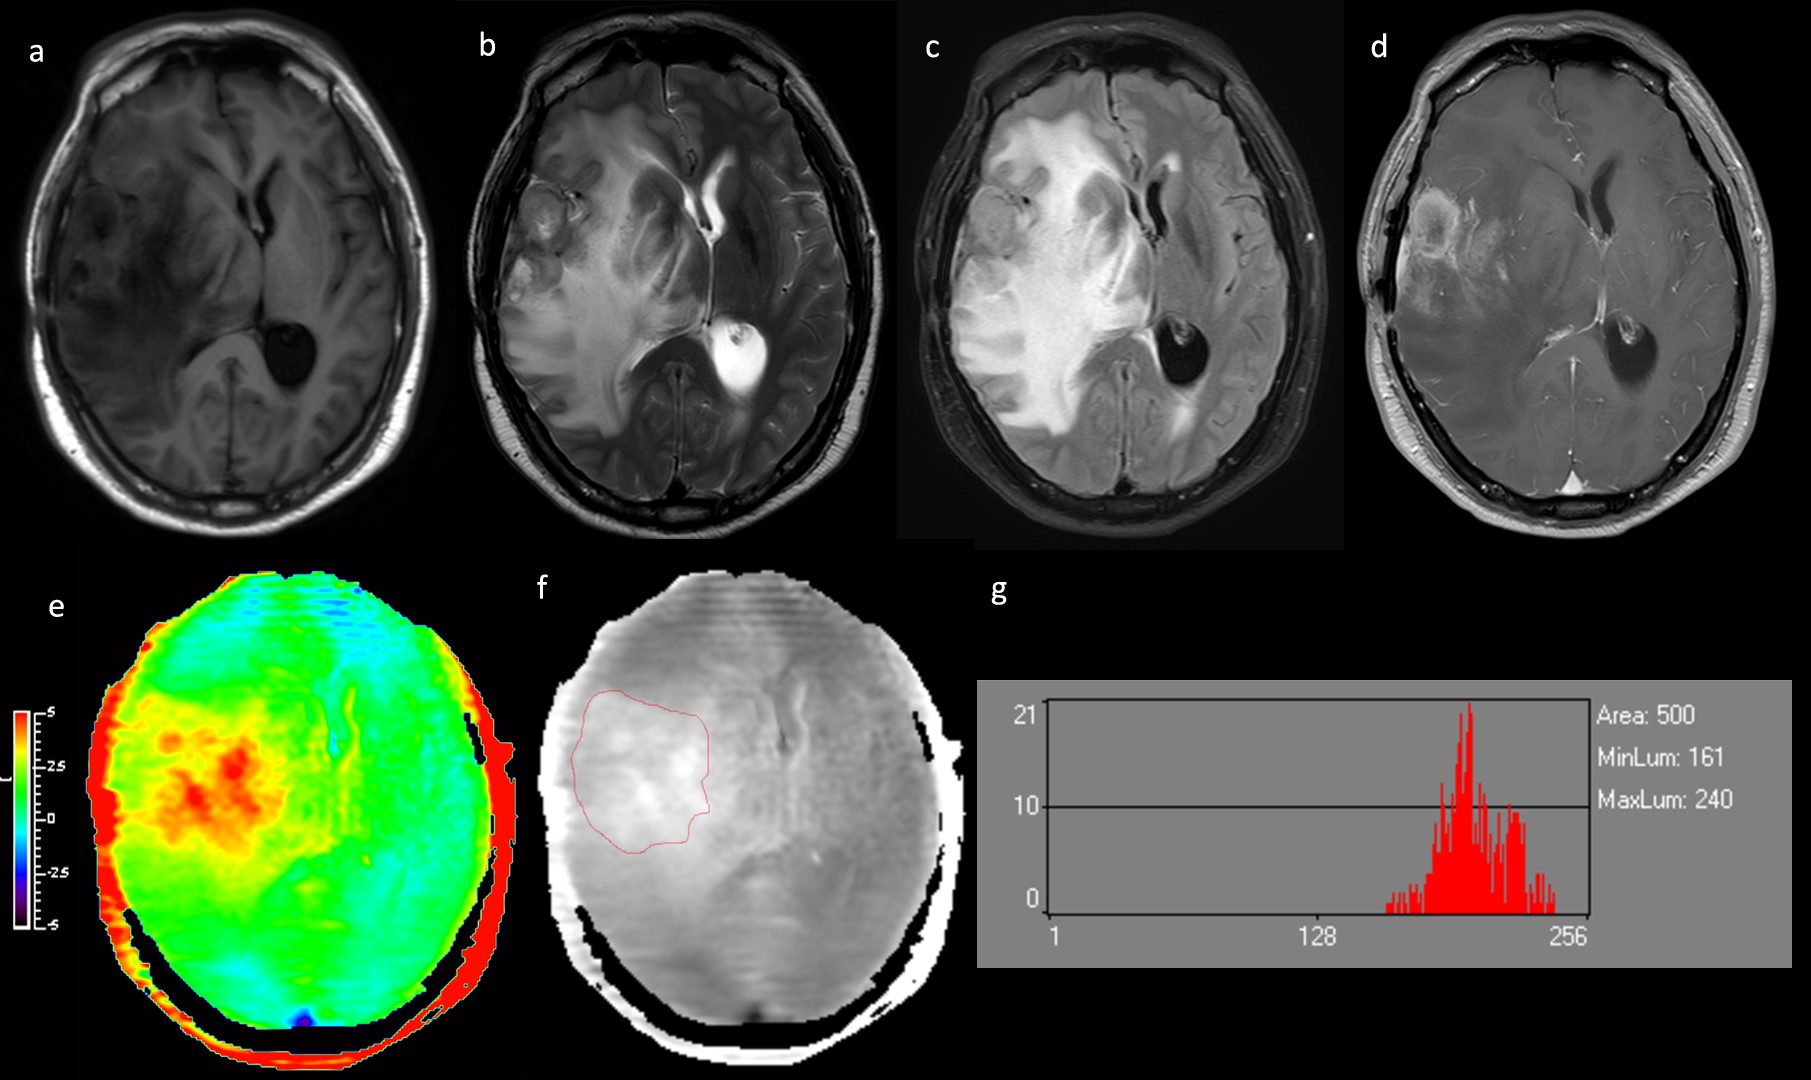
Local Ethics Committee approved the study, and informed consent was obtained from all patients. Eleven patients who underwent preoperative routine MRI scan as well as APT were retrospectively assessed. All MR scans were performed on a clinical 3.0T scanner (Ingenia, Philips). APT imaging was implemented using a 3D_TSE_DIXON sequence3 with following parameters: TR\TE: 4600\6ms; FOV: 212×212×83.6mm3; voxel size: 1.53×1.77×4.4mm3; saturation power: 2µT; RF saturation of 2 seconds was achieved by using multi-transmit techniques; frequency offsets: ±2.7ppm, ±3.5ppm; ±4.28ppm and -1540ppm; scan duration: 4:20min. B0 correction was performed with intrinsic B0 mapping. APT value was calculated automatically on console. Histogram analyses were performed by using Mazda (MaZda for Windows, B11 ver. 4.6, www.eletel.p.lodz.pl/programy/mazda/) 4. Mean values of histogram-based APT parameters (Mean, Variance, Skewness, 10th percentile, 50th percentile and 90th percentile) were compared between the groups of LGG and HGG using Student’s t test, or Mann-Whitney U test when not normally distributed. The regions of interst (ROI) were manually circumscribed in APTw image (Gray Scale) around the largest crosssectional area of the tumour, covering the whole area of abnormal intensity on the Gd-T1w image or FLAIR image. (Figure 1 and 2). The diagnostic performance of the parameters was assessed with receiver operating characteristic (ROC) curve and area under curve (AUC).Results
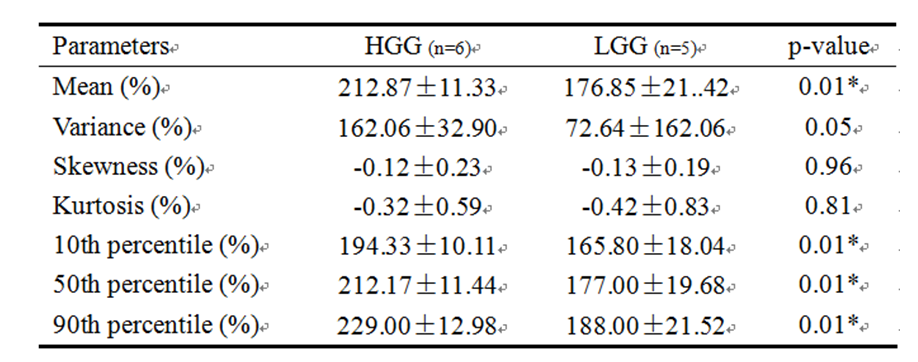
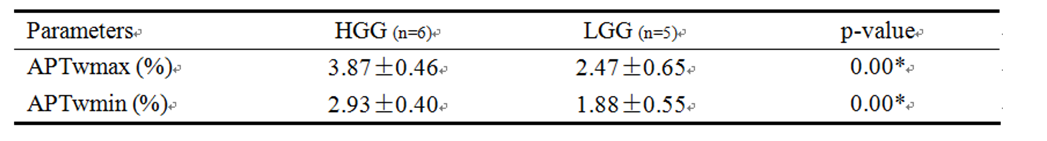
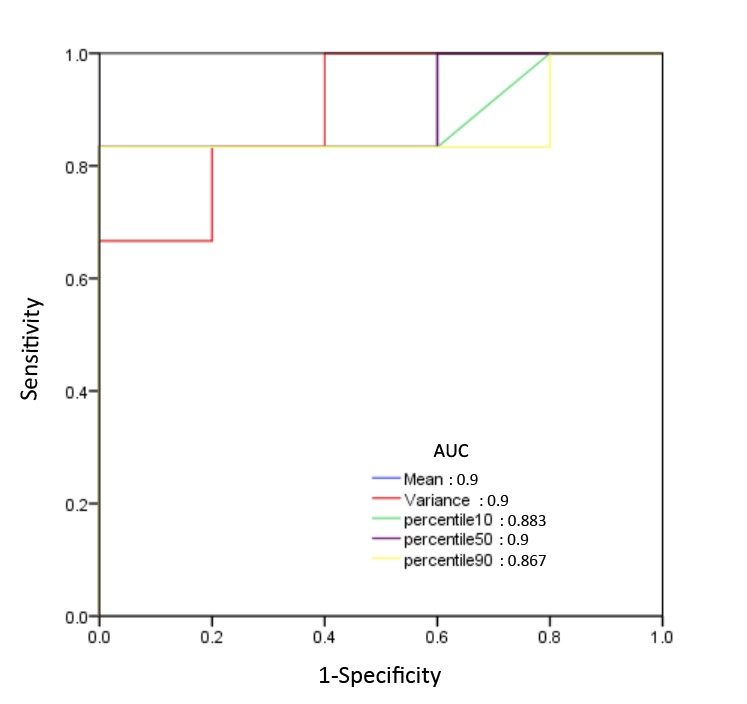
The mean values of histogram parameters (mean, variance, skewness, kurtosis, and 10th, 50th, and 90th percentile) are summarized in Table 1. The maximum APTw value (APTwmax), minimum APTw value (APTwmin) are summarized in Table 2. Mean, variance, 10th percentile, 50th percentile and 90th percentile were lower in the LGG group than that in HGG group. ROC curves for differentiation of grade of glioma with Histogram-derived parameters is shown in Figure 3.Conclusion
In this study, histogram-derived parameters for APTw imaging show that APT is a promising tool for differentiating HGG from LGG.Acknowledgements
No acknowledgement found.References
1. Lev MH, Rosen BR. Clinical applications of intracranial perfusion MR imaging. Neuroimaging Clin N Am 1999; 9(2): 309–331.
2.Law M, Oh S, Babb JS, et al. Low-grade gliomas: dynamic susceptibility-weighted contrast-enhanced perfusion MR imaging—prediction of patient clinical response. Radiology 2006;238(2):658–667.
3.Jochen Keupp, Jinyuan Zhou, and Osamu Togao. 3D Clinical APTw MRI with Improved Contrast Homogeneity. #1506, 2016 ISMRM
4.Szczypiński PM, Strzelecki M, Materka A et al. MaZda–a software package for image texture analysis. Comput Methods Prog Biomed 2009; 94(1):66–76
Figures