2148
Relationship Between Tumor Cellularity and Metabolic Activity in IDH-Mutant Gliomas: A Correlative Study with 2-Hydroxyglutarate MRSI and a Novel Diffusion MRI Method1Massachusetts General Hospital, Boston, MA, United States, 2Athinoula A. Martinos Center for Biomedical Imaging, Charlestown, MA, United States, 3Computer Assisted Clinical Medicine, Medical Faculty Mannheim, Heidelberg University, Mannheim, Germany
Synopsis
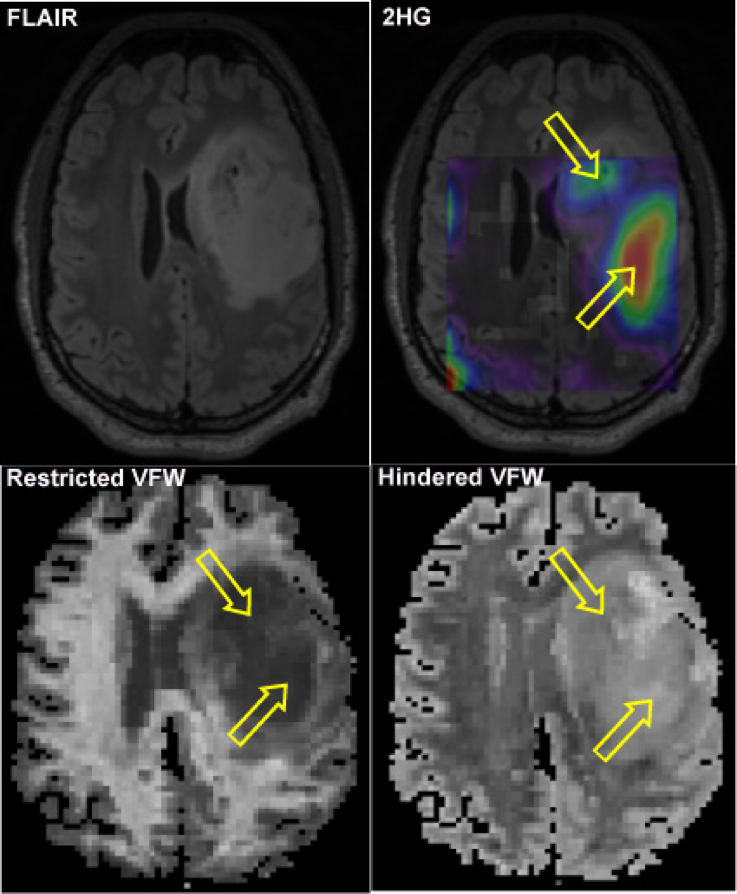
Anatomic T2/FLAIR sequences are the gold standard in the diagnostic and monitoring process of non-enhancing gliomas but do not provide accurate information about the underlying metabolic activity of the tumor. In this work, we investigated the combined use of 2-hydroxyglutarate (2HG) magnetic resonance spectroscopic imaging (MRSI) and a novel three-compartment diffusion MRI method (Linear Multi-Scale Model) to characterize isocitrate dehydrogenase-mutant gliomas, and found that high 2HG levels correlated with decreased restricted diffusion.
Introduction
Isocitrate dehydrogenase (IDH)-mutant gliomas constitute a subset of diffuse gliomas with particularly good prognosis. The IDH mutation results in increased production of the oncometabolite 2-hydroxyglutarate (2HG). 2HG can be reliably detected using 3D-magnetic resonance spectroscopic imaging (MRSI) and correlates with treatment outcome1. Recent work has shown an inverse correlation between 2HG levels and ADC2. However, given the strict dependence of ADC on a single Gaussian function, it does not accurately reflect underlying tissue microstructure. The Linear Multi-Scale Model (LMM) provides estimates of volume fractions of restricted, hindered, and free water over a range of length scales and orientation distributions by concatenating a non-Gaussian diffusion response function for restricted water within cylindrical structures and a Gaussian diffusion response function for hindered and free water3. Here, we investigate the relationship between 2HG levels and volume fraction of water (VFW) in restricted and hindered compartments in IDH-mutant gliomas.Methods
Data acquisition: Pre-surgical patients with non-enhancing FLAIR-hyperintense lesions suspicious for diffuse gliomas were enrolled. To obtain diffusion images, patients were scanned on a high-gradient 3T scanner (MAGNETOM CONNECTOM, Siemens; Scan 1) with maximum gradient strength=300 mT/m and maximum slew rate=200 T/m/s4. Sagittal 2-mm isotropic resolution diffusion-weighted spin-echo EPI images were acquired using SMS imaging4 and zoomed/parallel imaging5. We used δ/∆=8/19, 8/49ms, 4-5 diffusion gradient increments linearly spaced from 55-293 mT/m per ∆, TE/TR=77/3600ms, GRAPPA acceleration factor R=2, and SMS MB factor=2. Diffusion gradients were applied in 32-64 non-collinear direction with interspersed b=0 images every 16 directions. The maximum b-value at the longest diffusion time was 17,800 s/mm2. Total acquisition time, including T1-MPRAGE and T2-SPACE-FLAIR sequences, was 56 minutes. To obtain 3D-MRSI, patients underwent a second scan on a 3T scanner (TIM TRIO, Siemens; Scan 2). 3D-MRSI was obtained using 2HG spectral edited J-difference MEGA-LASER sequence1 with spiral spatial-spectral encoding and real-time motion and shim update (TR/TE=1600/68 ms, FOV=200 mm3, matrix=16x16x16). Total acquisition time for Scan 2, including a T1-MPRAGE sequence, was 21 minutes.
Data analysis: Following pre-processing6 of the diffusion data, spherical harmonics expansion of order 6/8 with Laplace-Beltrami regularization (λ=0.006)7 was used to interpolate the diffusion signal on each q-shell. Orientation distribution functions and VFW in restricted, hindered, and free compartments were obtained as previously described3. For 3D-MRSI, difference and OFF spectra were fitted with LCModel8 software and used to quantify metabolite levels. Linewidth <0.1 ppm and Cramer-Rao lower bound (CRLB)<25% were considered for goodness of fit of metabolites in difference spectra. CRLB<20% was considered for goodness of fit of metabolites in OFF spectra. 3D-metabolic maps were reconstructed using MINC, FSL, and MATLAB. Relative maps were calculated by dividing metabolites to healthy creatine averaged in a region of interest (ROI) in contralateral normal WM. Image interpolation was performed as follows: 1) co-registration of FLAIR, diffusion, and MPRAGE images from Scan 1, 2) co-registration of 2HG and MPRAGE images from Scan 2, and 3) co-registration of MPRAGE images from Scan 1 and 2. Using manual segmentation and excluding necrotic and hemorrhagic areas, the FLAIR-hyperintense region from Scan 1 was defined as the tumor ROI. VFW in the restricted, hindered, and free compartment within tumor and contralateral normal brain were obtained by averaging volume fraction estimates over all voxels. To test for correlation between VFW and 2HG levels, the Pearson correlation coefficient was calculated.
Results
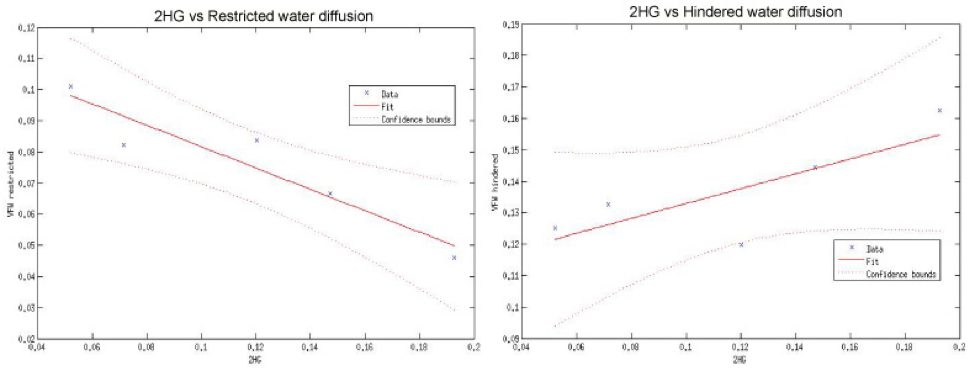
Six patients with histologically confirmed grade II or III IDH-mutant gliomas were scanned pre-surgery. In all patients, the tumor ROI demonstrated decreased restricted and increased hindered water compared to normal brain. There was a negative correlation between 2HG levels and all restricted length scales, which was significant for the 2-μm length scale (R2=-0.88, p=0.016). For the hindered length scales, there was also a trend towards negative correlation with 2HG levels except for the 1.53-μm2/ms length scale where a positive trend was observed (R2=0.62, p=0.11).Discussion
Given that 2HG is a validated marker of tumor cellularity9,10, our observation that high 2HG levels correlate with decreased restricted diffusion within the tumor suggests that, using the LMM, low restricted diffusion may be a marker of tumor cellularity. Based on simulation studies11, we postulate that decreased restricted and increased hindered water in the tumor may reflect increased cell permeability, allowing water to diffuse from the intracellular to extracellular space.Conclusion
Our data suggest a tight relationship between metabolic activity and tumor cellularity in IDH-mutant gliomas. Validation in more patients and with histopathology will be required. This multiparametric imaging approach may improve our understanding of IDH-mutant glioma biology and, eventually, aid in defining extent of metabolically active tumor and help assess treatment response.Acknowledgements
No acknowledgement found.References
1. Andronesi OC, Loebel F, Bogner W, et al. Treatment response assessment in IDH-mutant glioma patients by non-invasive 3D functional Spectroscopic Mapping of 2-Hydroxyglutarate. Clinical Cancer Research. 2016;22(7):1632-1641.
2. Jafari-Khouzani K, Loebel F, Bogner W, et al. Volumetric relationship between 2-Hydroxyglutarate and FLAIR hyperintensity has potential implications for radiotherapy planning of mutant IDH glioma patients. Neuro-Oncology. 2016;18(11):1569-1578.
3. Wichtmann B, Fan Q, Witzel T, Gerstner ER, Golby AJ, Rosen BR, Schad L, Wald LL, Nummenmaa A. Linear Multi-Scale Modeling of diffusion MRI data: A framework for characterization of orientational structures across length scales. ISMRM 24th Annual Meeting and Exhibition; 2016; Singapore.
4. Setsompop K, Kimmlingen R, Eberlein E, et al. Pushing the limits of in vivo diffusion MRI for the Human Connectome Project. Neuroimage. 2013;80:220-233.
5. Eichner C, Jafari-Khouzani K, Cauley S, et al. Slice accelerated gradient-echo spin-echo dynamic susceptibility contrast imaging with blipped CAIPI for increased slice coverage. Magn Reson Med. 2014;72(3):770-778.
6. Fan Q, Nummenmaa A, Witzel T, et al. Investigating the capability to resolve complex white matter structures with high b-value diffusion magnetic resonance imaging on the MGH-USC Connectom scanner. Brain Connect. 2014;4(9):718-726.
7. Descoteaux M, Angelino E, Fitzgibbons S, Deriche R. Regularized, fast, and robust analytical Q-ball imaging. Magn Reson Med. 2007;58(3):497-510.
8. Provencher SW. Estimation of Metabolite Concentrations from Localized in-Vivo Proton Nmr-Spectra. Magnetic resonance in medicine. 1993;30(6):672-679.
9. de la Fuente MI, Young RJ, Rubel J, et al. Integration of 2-hydroxyglutarate-proton magnetic resonance spectroscopy into clinical practice for disease monitoring in isocitrate dehydrogenase-mutant glioma. Neuro Oncol. 2016;18(2):283-290.
10. Santagata S, Eberlin LS, Norton I, et al. Intraoperative mass spectrometry mapping of an onco-metabolite to guide brain tumor surgery. Proc Natl Acad Sci U S A. 2014;111(30):11121-11126.
11. Wichtmann B, Fan Q, Witzel T, Gerstner, ER, Golby, AJ, Santagata S, Rosen BR, Schad L, Wald LL, Huang SY. Investigating micostructural signatures for low-grade gliomas using Linear Multi-scale Modeling of diffusion MRI data. ISMRM 25th Annual Meeting and Exhibition; 2017; Honolulu, HI.
Figures