2147
Effects of Glioblastoma (GBM) on quantitative MRI of Contralateral Normal Appearing White Matter1Physical Sciences, Sunnybrook Research Institute, Toronto, ON, Canada, 2Radiology & Biomedical Imaging, University of California, San Francisco, San Francisco, CA, United States, 3Sunnybrook Health Sciences Centre, Toronto, ON, Canada
Synopsis
Normal-appearing white matter on the contralateral hemisphere (cNAWM) of glioblastoma (GBM) has been shown with MRS and DTI to be abnormal which might be due to tumor cell infiltration into these distant normal appearing brain structures. Chemical exchange saturation transfer (CEST), quantitative magnetization transfer (
Purpose
To investigate the abnormalities in the contra-lateral normal-appearing white matter (cNAWM) of glioblastoma (GBM) patients with quantitative MRI.Introduction
GBM is the most common malignant primary brain tumor in adults and has a dismal survival rate1,2. It has been shown with diffusion tensor imaging (DTI) and magnetic resonance spectroscopy (MRS) that cNAWM of GBM patients is different from that of healthy controls. In this study, we investigated abnormalities in cNAWM of GBM patients with chemical exchange saturation transfer (CEST), quantitative magnetization transfer (qMT) and T2 mapping.Materials & Methods
Subjects: 13 newly diagnosed GBM patients (8M/5F, Age 54±9years) and 9 healthy controls (7M/2F, Age 48±12years) were recruited (REB approved) and were MRI-scanned. Patients were scanned before chemo-radiation treatment but after surgical resection of the tumor.
MRI: was performed on a 3T Philips Achieva scanner. An axial slice passing through the tumor was imaged with TFE (TR/TE=7.78/4.5ms, Matrix=144×144, FOV=20×20cm,slice=3mm).
CEST imaging covered offsets between -5.9ppm and 5.9ppm with 0.2ppm increments, with 4 references at ~780ppm at the beginning and another 4 references at the end of the spectrum. RF saturation included 4 block pulses of 242.5ms each (970ms total), and B1=0.52µT3,4. CEST imaging was repeated twice for a total of 4.8min.
qMT imaging: six MT spectrums were acquired. MT preparation involved 2 & 4 block pulses of 242.5ms each (total duration=970ms & 485ms), and for each duration three RF powers of 1.5/3/5µT were used. MT spectrum covered 250Hz to 100kHz with 14 offsets (with equal log scale separation).
T2 mapping: was performed using a T2-weighted spin echo sequence with 10 echo times and by fitting a mono-exponential function to the data.
Analysis: All images (CEST/MT/T1/T2 were co-registered to the first acquired CEST image.
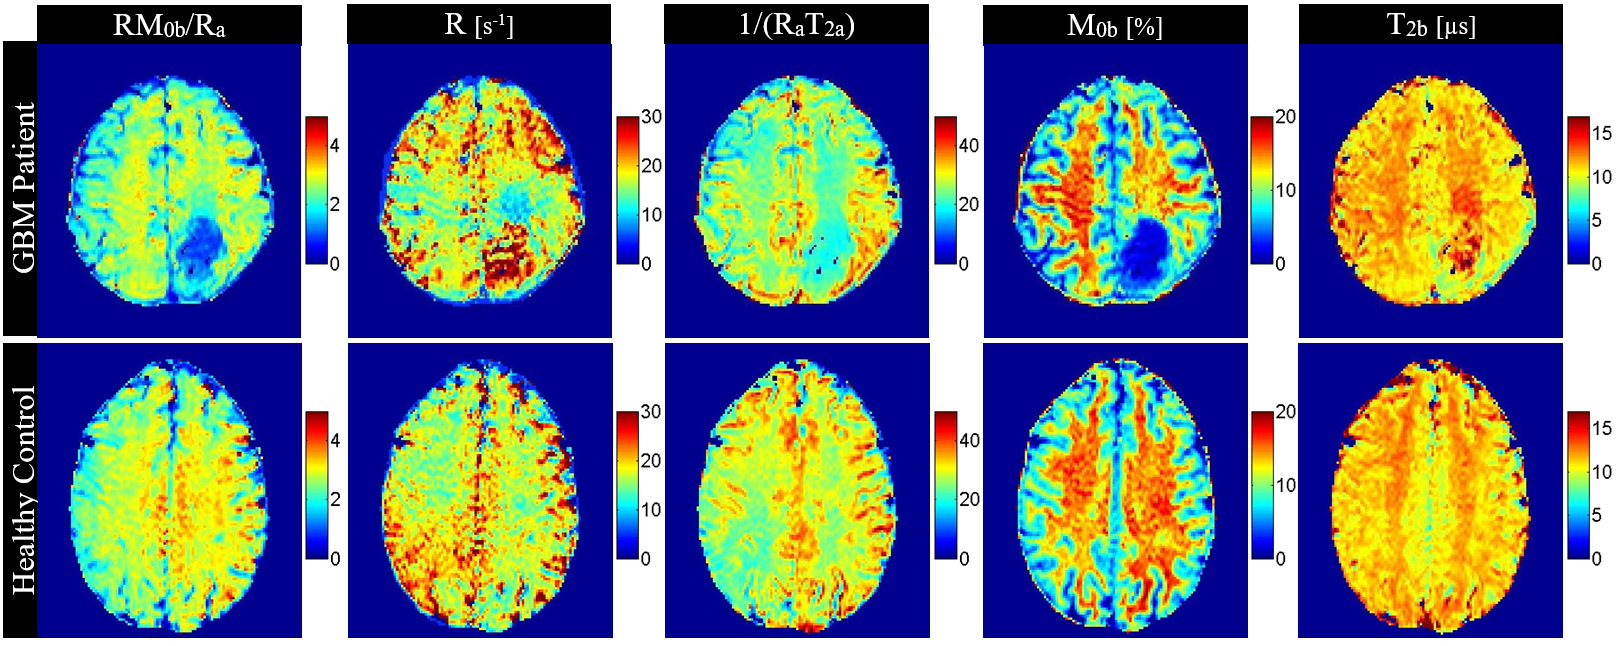
qMT modeling: the six MT spectrums were fit to the two-pool MT model proposed by Henkelman5 in transient state, and the four model parameters exchange rate (R), the size of the macromolecular pool (M0b) and [R, T2b,RM0b/Ra,1/(RaT2a)] were calculated. RM0b/Ra, M0b, R represent amount of magnetization transfer, macromolecular pool size, and exchange rate respectively.
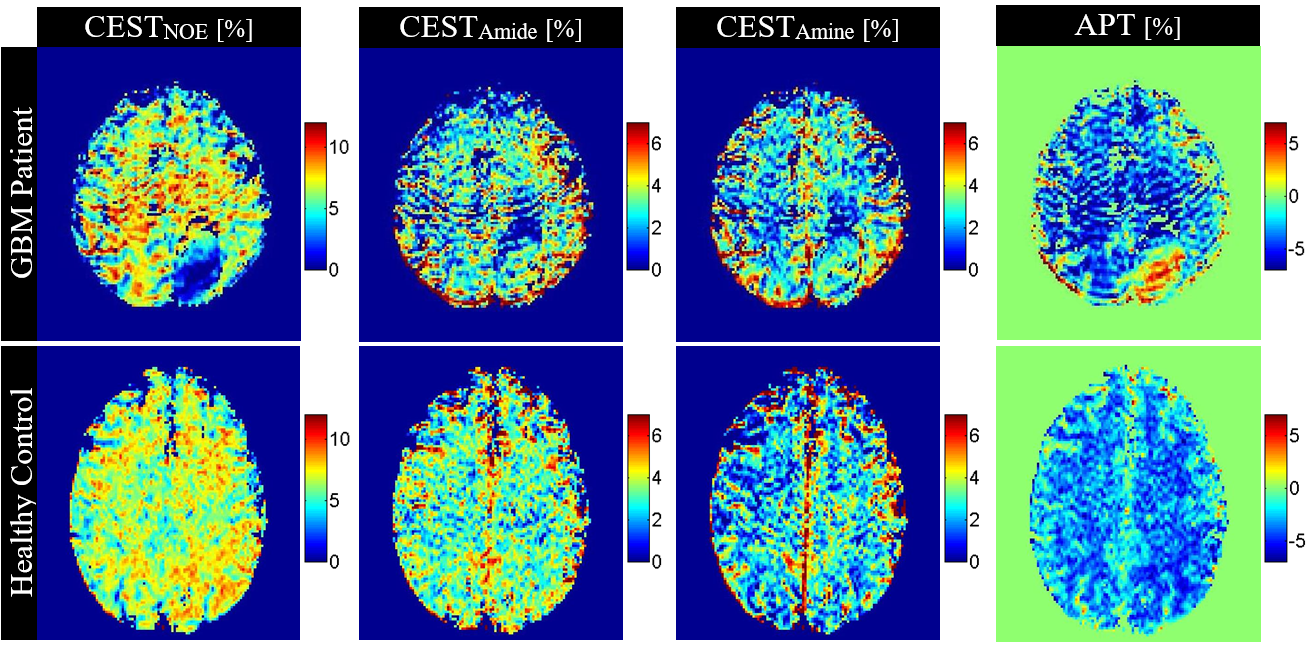
CEST analysis: B0 and drift correction was performed3 and then each spectrum was normalized to its reference. MT signal was simulated using the qMT analysis results and was extrapolated into the CEST imaging range. The two normalized CEST spectra were then averaged and the simulated MT curve was subtracted from it to provide the CEST signals. The amplitude of this CEST curve corresponding to Amide (3.5ppm), Amine (2.2ppm), and Nuclear Overhauser Effect (NOE) (-3.5ppm) were then used as the CESTAmide, CESTAmine, and CESTNOE signals respectively. Lorentzian decomposition of the original CEST spectrum into a constant MT (for offsets between ‑5.9ppm to 5.9ppm) and four Lorentzian line-shapes (Amide, NOE, Amine, bulk water) was also performed, and Area under the curve of NOE, Amide, and Amine CEST peaks (AUCNOE, AUCAmide, AUCAmine) were calculated.
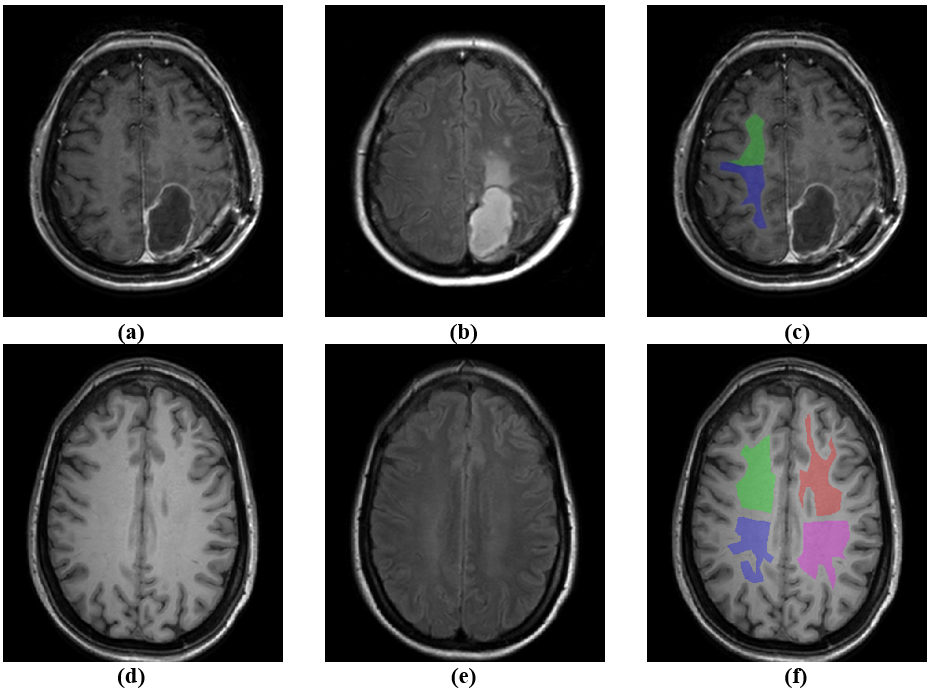
NAWM ROI: For each patient two ROIs on the cNAWM were selected (26 ROIs in total). For each control four ROIs on the NAWM (two on each hemisphere) was selected (36 ROIs in total).
Results
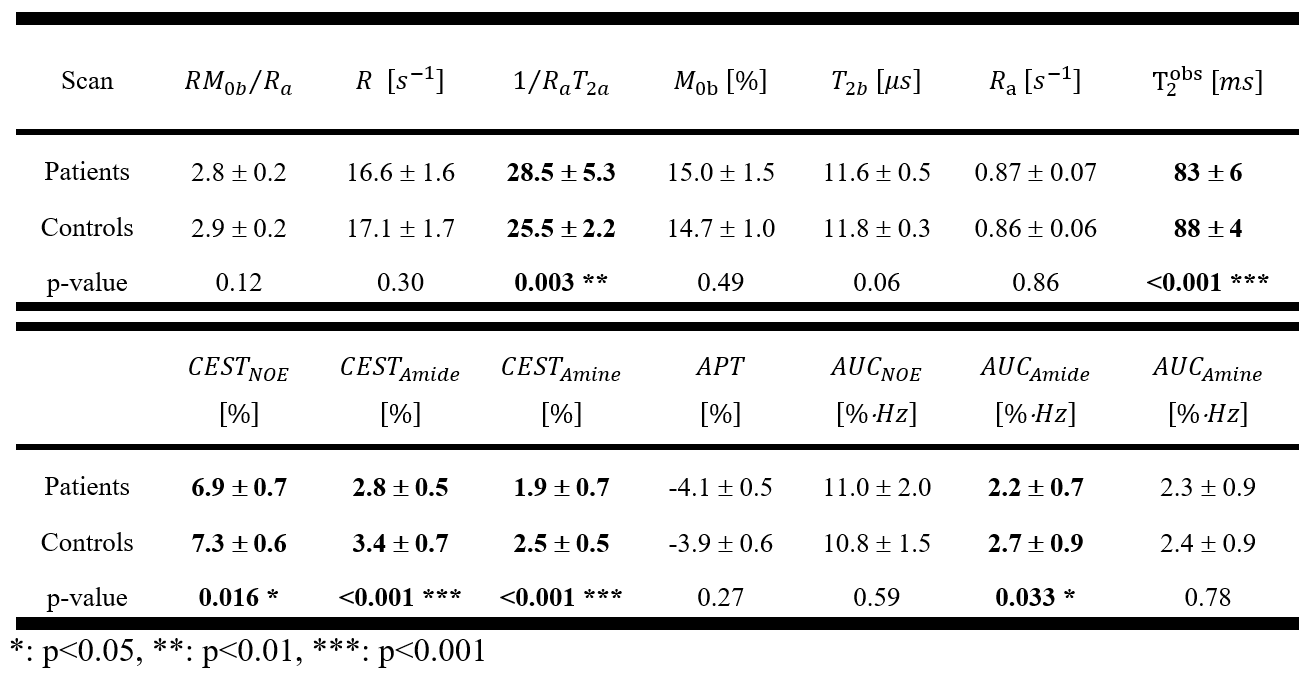
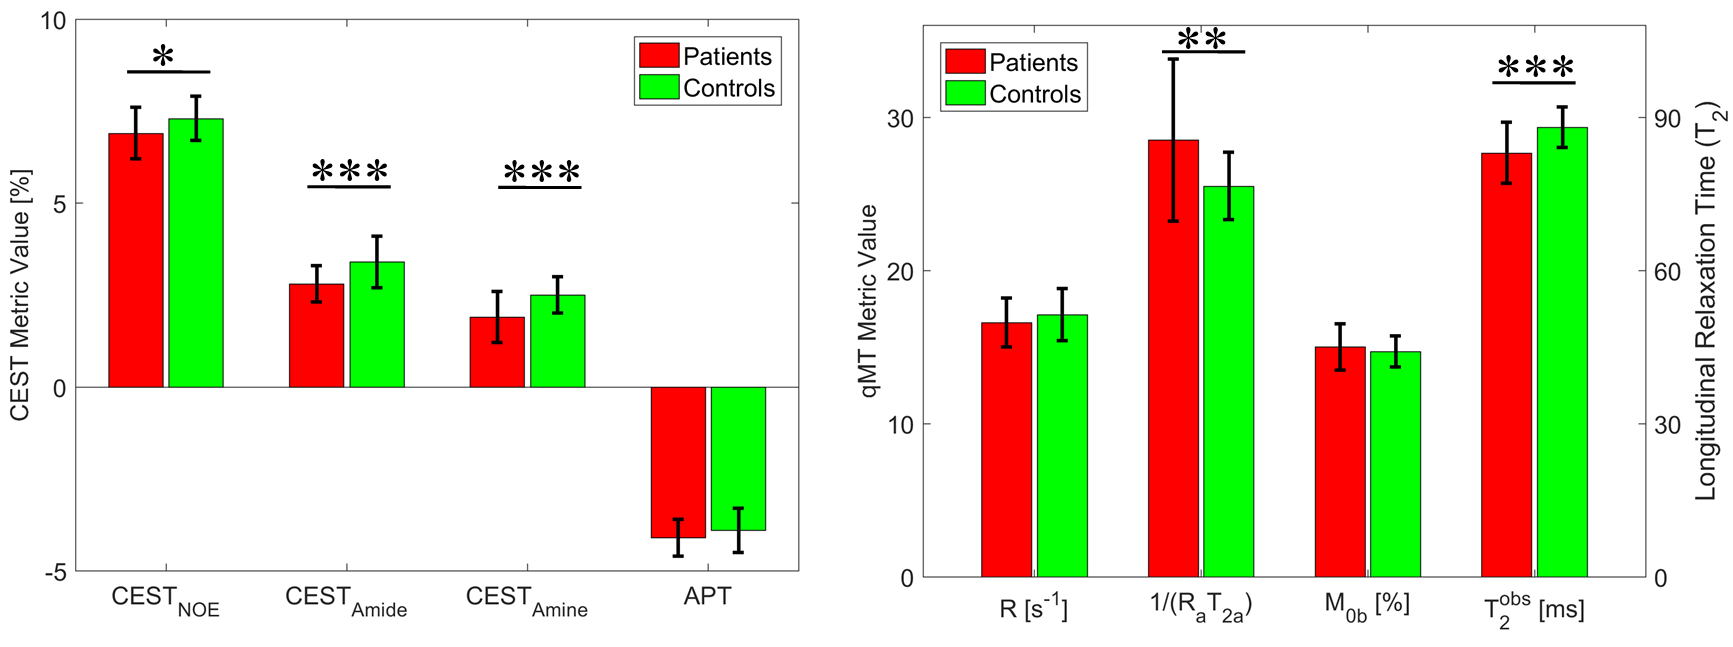
CEST and qMT metrics were calculated voxel-by-voxel and were then averaged over each cNAWM ROI. Figure1 shows representative ROIs for a GBM patient and a healthy control. Figure2 shows the parametric maps of qMT model for a representative GBM patient and a healthy control subject. Figure3 shows parametric maps of CEST signals for a representative GBM patient and a healthy control. Table1 reports the distribution of T2, qMT, and CEST parameters for cNAWM of GBM patients and NAWM of healthy controls. Figure4 graphically shows the CEST and qMT metrics that were statistically significantly different between the two cohorts as well as the APT signal.Discussions & Conclusions:
There was no difference between GBM patients and normal controls in the qMT properties of the macromolecular pool (R,T2b,RM0b/Ra). However, the free water pool spectrum was statistically significantly different (1/(RaT2a)patient=28.5±5.3, 1/(RaT2a)control=25.5±2.2, p=0.003). This difference could be attributed to the difference in their transverse relaxation time (T2,patient =83±6, T2,control=88±4, p<0.001)), CEST signal for NOE, Amide and Amine in cNAWM of GBM patients were statistically significantly lower than controls with the CESTAmide having the largest difference between the two cohorts (CESTAmide,patient=2.8±0.5, CESTAmide,control=3.4±0.7, p<0.001). CEST in cNAWM of GBM patients was lower than healthy controls which could be caused by tumor cell infiltration or modified brain metabolism due to the presence of tumor. There was no difference in MT properties of patients and controls. However, the differences in free water pool properties were mainly due to reduced T2 relaxation time in cNAWM of GBM patients (i.e. resulting from structural changes in tissue).Acknowledgements
This study was funded by Terry Fox Research Institute (TFRI project 1034), Canadian Cancer Society Research Institute (CCSRI 701640) and Brain Canada grant (CCSRI 705083).References
1. Ryken, T. C. et al. The role of imaging in the management of progressive glioblastoma: A systematic review and evidence-based clinical practice guideline. J. Neurooncol. 118, 435–460 (2014).
2. Koshy, M. et al. Improved survival time trends for glioblastoma using the SEER 17 population-based registries. J. Neurooncol. 107, 207–212 (2012).
3. Mehrabian, H., Desmond, K. L., Soliman, H., Sahgal, A. & Stanisz, G. J. Differentiation between radiation necrosis and tumor progression using chemical exchange saturation transfer. Clin. Cancer Res. 23, clincanres.2265.2016 (2017).
4. Desmond, K. L. et al. Chemical exchange saturation transfer for predicting response to stereotactic radiosurgery in human brain metastasis. Magn. Reson. Med. 78, 1110–1120 (2017).
5. Henkelman, R. M. et al. Quantitative interpretation of magnetization transfer. Magn. Reson. Med. 29, 759–766 (1993).
Figures