2145
Association between pharmacokinetic parameters from DCE-MRI and metabolic parameters from dynamic 18F-fluoromethylcholine PET in human brain glioma1Department of Surgery and Cancer, Imperial College London, London, United Kingdom, 2Department of Computer, Control and Management Engineering Antonio Ruberti, La Sapienza University of Rome, Rome, Italy, 3Department of Imaging, Imperial College Healthcare NHS Trust, London, United Kingdom, 4Department of Medicine, Imperial College London, London, United Kingdom, 5Centre for Clinical Brain Sciences, The University of Edinburgh, Edinburgh, United Kingdom
Synopsis
Magnetic resonance imaging (MRI) is the standard imaging technique in the diagnosis of primary brain lesions. However, novel PET imaging techniques such as choline-PET are currently being investigated in the clinic to characterize tumour metabolism. In this study, we compared pharmacokinetic parameters resulting from the modelling of dynamic contrast enhanced (DCE) MRI data, using the Tofts model (TM) and shutter speed model (SSM), with metabolic macroparameters derived from the application of the spectral analysis (SA) to dynamic PET data. We observe a correlation between some pharmacokinetic parameters and the parameters obtained through spectral analysis of the dynamic choline-PET data.
Abstract
Introduction
Gliomas are the most common primary brain tumour and there is a wide interest in imaging techniques that stratify tumour behaviour and therapeutic response. PET scans performed with choline based radiotracers are being studied as imaging markers of cell proliferation as choline is a key component of cell membranes. The basis for choline-PET is that primary brain tumours show increased levels of choline uptake when tumour cells are rapidly dividing1. In this study, we compared the results of the quantification of both DCE-MRI and dynamic 18F-fluoromethylcholine (FMC) PET on 14 patients with primary untreated glioma. In particular, we applied the Tofts model (TM) and the shutter-speed model (SSM) to DCE-MRI data and spectral analysis (SA) to dynamic FMC-PET data.
Methods
14 patients (7 male, 7 female; aged 23-73 years, mean 40 years) with suspected primary supratentorial glioma were recruited to this study. Ethical approval was given by the local ethics committee and informed consent was obtained from all patients. MR images were acquired on a 3T Siemens Verio MRI system using a 32 channel head coil; including pre- and post-contrast T1-weighted images, T2-FLAIR images and a DCE sequence with a variable flip angle pre-contrast T1 map acquisition. PET/CT was performed on a Siemens Biograph 6 scanner with 285MBq of 18F-fluoromethylcholine (PETNET Solutions Inc., UK), using a dedicated 45-minute brain dynamic list mode acquisition. One patient did not have PET imaging and was excluded from this study.
VOIs were drawn by a Radiologist and confirmed by a Consultant Neuroradiologist for each patient around T2-FLAIR hyperintense regions and on a 2cm diameter circular region on contra-lateral white matter. Pharmacokinetic analysis was performed with TM2 and SSM3 and resulted with 3D parametric maps of Ktrans (contrast agent plasma/interstitium transfer rate constant), Kep (intravasation rate constant), ve (extravascular and extracellular volume fraction) and τi (mean capillary water lifetime). The mean values over the whole tumour of these DCE-derived parameters were correlated with tumour to background ratio (TBR) measured on PET and defined as the ratio of SUVmax in tumour to SUVmean in contralateral white matter for the 7-17 minute static PET images. Dynamic PET data were quantified with SA on a subgroup of six patients for whom metabolite data were available. SA provided 3D parametric maps of K1, the net uptake of the tracer in the tissue and Ki, the rate at which the tracer is irreversibly trapped in the tissue during the experimental time4. Correlations among parameters were assessed with Pearson and Spearman tests.
Results
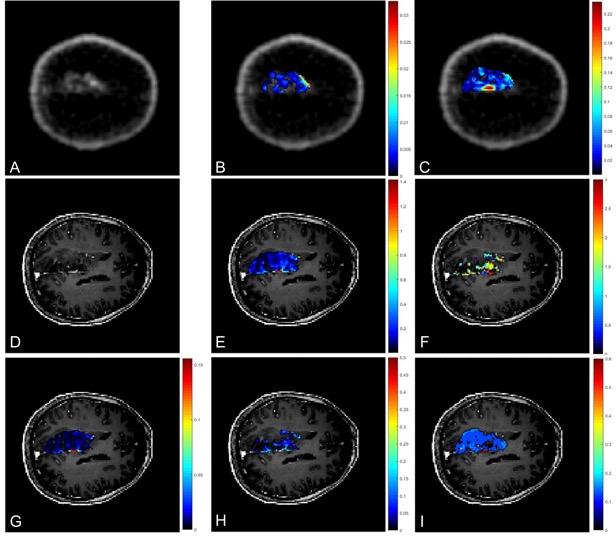
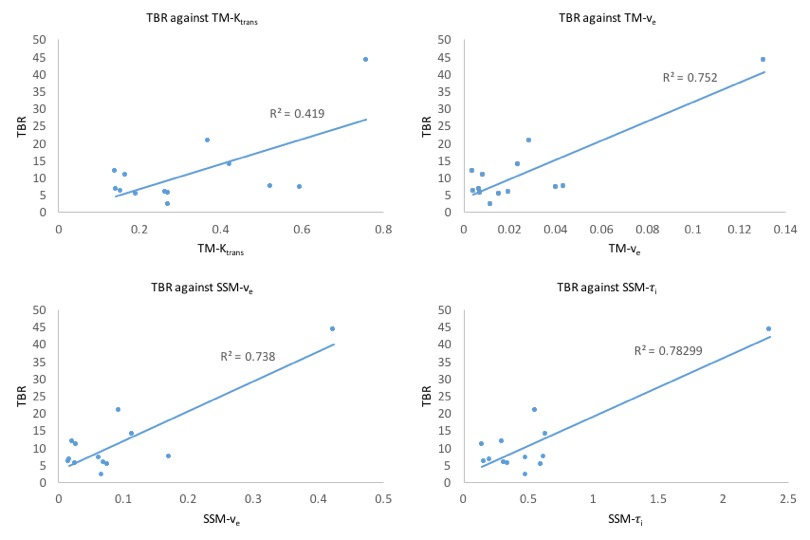
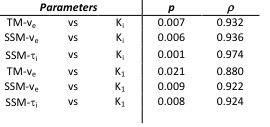
3D parametric maps of TM and SSM estimates of Ktrans, ve and τi and of spectral Ki and K1 for one axial slice of a non-enhancing tumour are shown in Fig.1. The non-parametric Spearman correlation test showed strong correlations between spectral K1 and Ki with pharmacokinetic TM-ve (r = 0.8802, r = 0.9320), SSM-ve (r = 0.9220, r = 0.9382) and SSM-τi (r = 0.9243, r = 0.9740) as shown in Table 1. Pearson correlation test between TBR and DCE pharmacokinetic results showed a significant correlation for TM-Ktrans, TM-ve, SSM-ve and SSM-τi (Fig.2). There was no significant correlation between SSM-Ktrans and TBR.
Discussion
Dynamic contrast-enhanced MRI and dynamic FMC PET are two imaging modalities that can provide valuable insight into the characterization of tumour tissue. The two imaging techniques are functionally very different and the extent of their agreement or discordance is not well understood. Therefore, the primary purpose of this study was to evaluate the association between pharmacokinetic parameters resulting from the analysis of DCE MRI data with TM and SSM and metabolic parameters derived from the application of the SA to dynamic PET data. Results showed a high correlation between the irreversible trapping of the tracer in the tissue and the volume of distribution of the gadolinium based contrast agent. Furthermore, static PET TBR confirmed these correlations and showed also a weak correlation with the TM-Ktrans.
Conclusion
Dynamic MRI provides complimentary information to blood volume and permeability that may augment interpretation of PET data; and help address questions such as the degree to which tracer uptake is dominated by blood brain barrier permeability rather than metabolic activity. Further studies need to be carried out to better understand how the two could be usefully combined for tumour characterisation and for assessing tumour response to treatment.
Acknowledgements
MI and MGS contributed equally to this work. The study was part funded by the National Institute for Health Research Imperial Comprehensive Biomedical Research Centre, the Brain Tumour Charity and the Brain Tumour Research Campaign. MR and PET acquisitions were carried out at the Imperial College Clinical Imaging Facility.References
[1] Mertens, K., Ham, H., Deblaere, K., Kalala, J. P. O., Van den Broecke, C., Slaets, D., ... & Goethals, I. (2012). Distribution patterns of 18F-labelled fluoromethylcholine in normal structures and tumors of the head: a PET/MRI evaluation. Clinical nuclear medicine, 37(8), e196-e203.
[2] Tofts, P.S.. (2010). T1-weighted DCE imaging concepts: Modelling, acquisition and analysis. MAGNETOM Flash. 3. 30-39.
[3] Yankeelov TE, Rooney WD, Li X, Springer CS. Variation of the relaxographic "shutter-speed" for transcytolemmal water exchange affects the CR bolus-tracking curve shape. Magnetic Resonance in Medicine. 2003; 50:1151-69.
[4] Cunningham, V. J., & Jones, T. (1993). Spectral analysis of dynamic PET studies. Journal of Cerebral Blood Flow & Metabolism, 13(1), 15-23.
Figures