2144
Quantitative proton density values compared to 1H MRSI in areas of contrast enhancement of glioma patients after surgical resection.1National Center for Tumor Diseases, partner site Dresden, Germany, Dresden, Germany, 2Institute of Neuroradiology, University Hospital Carl Gustav Carus and Medical Faculty of Technische Universität, Dresden, Germany, 3Department of Radiotherapy and Radiooncology, University Hospital Carl Gustav Carus and Medical Faculty of Technische Universität, Dresden, Germany, 4OncoRay - National Center for Radiation Research in Oncology, Faculty of Medicine and University Hospital Carl Gustav Carus, Technische Universität Dresden, Helmholtz-Zentrum Dresden - Rossendorf, Dresden - Rossendorf, Germany, 5Institute of Radiooncology - OncoRay, Helmholtz-Zentrum Dresden-Rossendorf, Rossendorf, Germany, 6German Cancer Consortium (DKTK), partner site Dresden, Dresden, Germany
Synopsis
In this study we measured mean proton density (PD) values in MR spectroscopic imaging (MRSI) voxels showing contrast enhancement of glioma patients 30 days ± 12 days after surgical resection. MRSI voxels with (partial) overlap with contrast enhancing areas were manually selected. Mean PD values showed a significant inverse correlation with NAA/Cho indicating that areas with higher PD are more likely to contain residual tumour tissue rather than surgery-related tissue damage. There was, however, no correlation of PD with Cho/Cr, which suggests that quantitative PD values are unable to determine tumour aggressiveness.
Introduction
Brain tumours are generally characterised by higher proton density (PD) compared to normal appearing brain1. The aim of this study was to report mean quantitative PD values within MRSI voxels showing contrast enhancement in glioma patients in between surgical tumour resection and the start of radio(chemo)therapy. These regions are likely a mix of residual tumour tissue and surgery-related tissue damage. It has been shown that NAA/Cho ratio inversely correlates with tumour cell density in gliomas2, and thus lower NAA/Cho values are more likely to indicate residual tumour tissue rather than treatment related effects. Hence, we compared the obtained PD values with NAA/Cho ratio. Additionally, we compared the Cr/Cho ratios, a measure of tumour aggressiveness3, with PD values.Methods
31 glioma patients who have undergone primary tumour resection were scanned as part of an ongoing study before initiation of radio(chemo)therapy. Data was acquired on a 3T Philips Ingenuity TF PET/MR scanner using an 8 channel head coil and included: 3D gradient spoiled echo (FA=3°/20°, TR/TE=10/3.7ms, 1x1x1mm³), B1 mapping4, 2D-FFE (TR=1355ms, TE=5.8/9.1/12.4/15.8/19.1ms, 2x2mm², slice thickness/gap=2/1mm), 3D T1w gradient spoiled echo after administration of intravenous contrast agent (Gadovist, double-dose at 0.2 mmol/kg ) and 2D single slice PRESS MRSI (TR/TE/TE1=1300/97/32ms). PD maps were calculated and scaled to cerebrospinal fluid (CSF) as described by Volz et al.5 and reported in percentage units (pu). Receive coil non-uniformity in the PD images was removed by masking out all abnormal tissue and performing SPM12 tissue segmentation and simultaneous bias field correction6. The resulting bias field was applied to the original PD images including the abnormal tissue. 2D MRSI data was analysed with TARQUIN7 to determine NAA/Cho and Cr/Cho ratios.
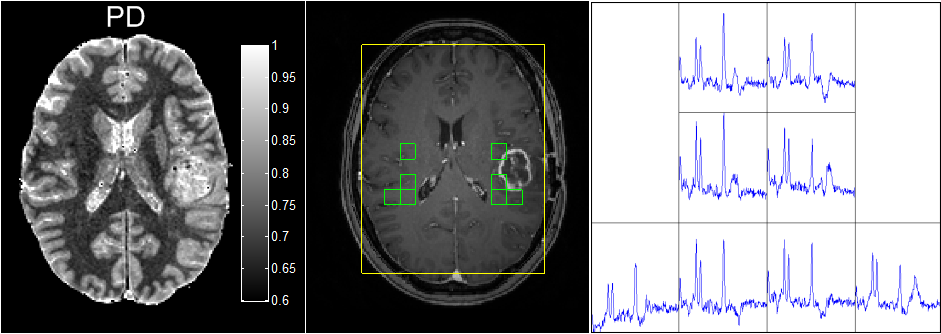
In eleven patients (1 grade II, 4 grade III, 6 grade IV, mean age ± std: 51y ± 16y, mean time after resection ± std: 30d±12d), MRSI spectra with acceptable quality and at least partial overlap with areas of contrast enhancement on T1w imaging were available and manually selected while taking care to avoid MRSI voxels with large partial volumes with CSF, resection cavities and necrosis (see example in Figure 1). Additionally, MR spectra corresponding to normal appearing brain (NAB) were manually selected from the contralateral parts of the brain in patients in whom the tumour occupied only one hemisphere (see Figure 1). In one case, the tumour occupied the frontal parts of the brain and consequently NAB MRSI voxel were selected from the parietal parts of the brain. In a second case, no NAB voxels were selected due to poor spectral quality. PD values from these MRSI voxel locations were subsequently extracted and averaged. Within the NAB MRSI voxels, only PD values with a combined grey matter (GM) and white matter (WM) probability threshold larger than 0.9 following SPM12 segmentation were used to reduce partial volume effects with CSF. Regression analysis was performed in MATLAB using Pearson’s correlation with a significance threshold of p=0.05.
Results
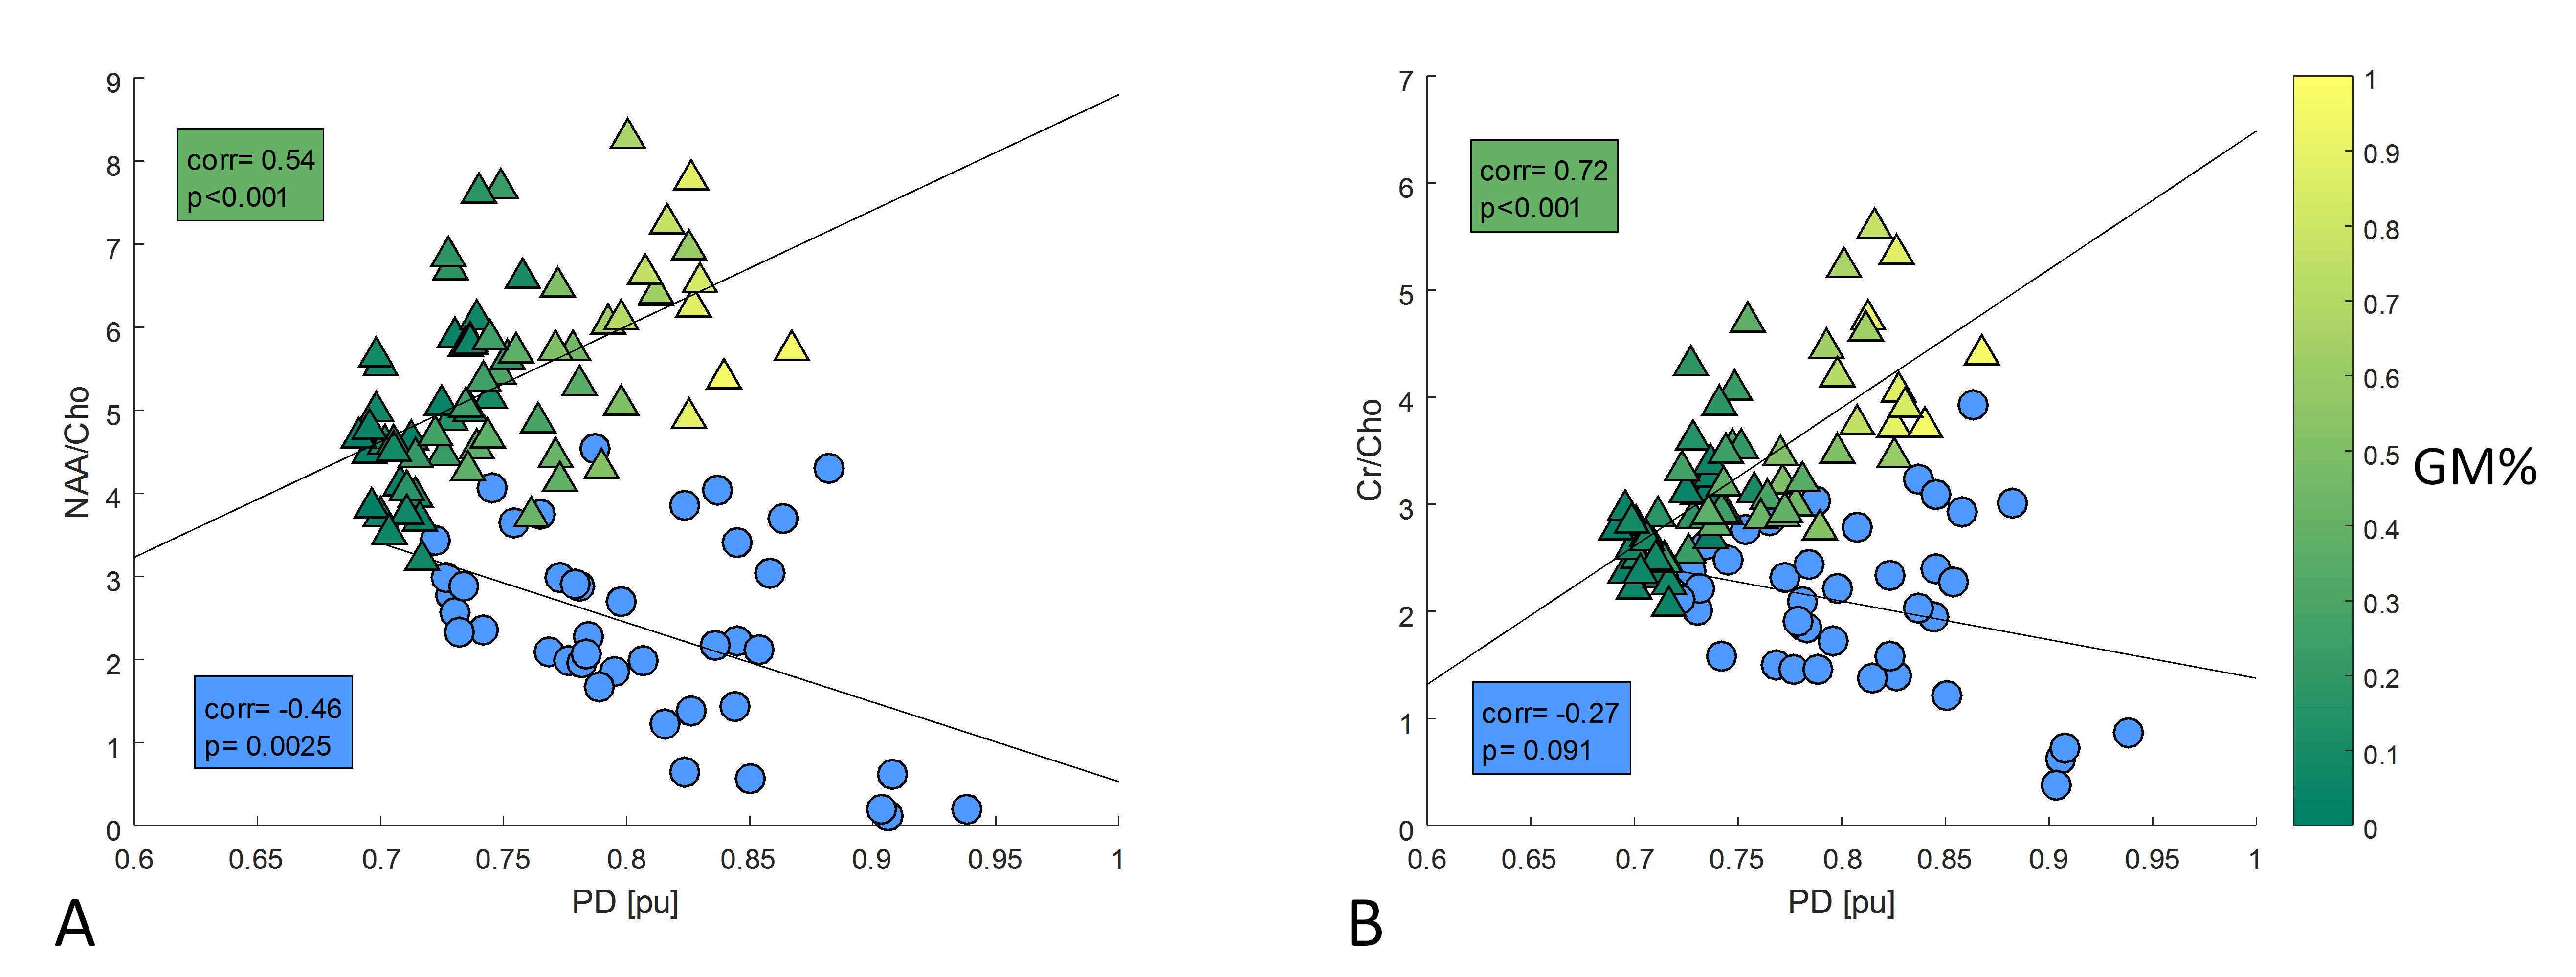
Mean PD values from abnormal MRSI locations ranged from 0.72 – 0.94 pu (mean ± std: 0.81pu ± 0.06pu) and inversely correlated with NAA/Cho (r=-0.46, p=0.003, Figure 2a). No significant correlation of mean PD values with Cr/Cho was found (r=-0.27, p=0.09, Figure 2b).Discussion
Quantitative PD values in contrast-enhancing subvolumes of glioma patients post resection appear higher compared to pure WM and thus might enable a threshold-based separation demarcating the microscopic target volume in radiotherapy. However, there was significant overlap of abnormal PD values with those found in GM.
The results of this study also highlight the need to take increased PD into account when performing absolute metabolite quantification using MRSI in gliomas.
The lack of a significant inverse correlation of PD with the Cr/Cho ratio indicates that tumour aggressiveness in a MRS voxel is not a major factor driving the observed PD increase. Instead, the PD increase may be driven by a number of factors such as (i) increased vascularity of the residual tumour tissue, (ii) cytotoxic and vasogenic oedema, (iii) increased tumour cell density and (iv) cell membrane breakdown and/or demyelination increasing the MR visible concentration of protons. Potential confounding factors of our findings are non-tumorous changes following resection, different tumour locations, varying locations of NAB MRSI voxels and subject age which has shown to correlate with PD in normal appearing WM8.
Further work is needed to increase subject numbers and understand the underlying microstructural and vascular changes causing the PD increase, using diffusion and perfusion imaging respectively.
Conclusion
PD in residual tumour tissue is higher compared to that of normal appearing WM. Mean PD significantly increases with decreasing NAA/Cho ratio, although increasing tumour cell density is only one of a number of potentially driving factors.Acknowledgements
No acknowledgement found.References
1. Blystad et al. PloS One 2017;12:e0177135.
2. Cordova et al. Neuro-Oncology 2016;18:1180-1189
3. Horska et al. Neuroimaging Clinics of North America 2010;20:293-310
4. Cunningham et al. Magnetic Resonance in Medicine 2006;55:1326-1333.
5. Volz et al. Neuroimage 2012;63:540-552.
6. Ashburner and Friston. Neuroimage 2005;26(3):839-51.
7. Wilson et al. Magnetic Resonance in Medicine 2011;65:1-12
8. Raschke et al. ESMRMB 2017:p809
Figures