2143
Diffusion kurtosis imaging (DKI) can help to differentiate low- and high-grade gliomas in pediatric patients: a prospective single centre experience with the simultaneous multislice (SMS) technique1Medical Physics Department, IRCCS Bambino Gesù Children’s Hospital, Rome, Italy, 2Imaging Department, IRCCS Bambino Gesù Children’s Hospital, Rome, Italy, 3Department of Pediatric Onco-Hematology and Transfusion Medicine, IRCCS Bambino Gesù Children’s Hospital, Rome, Italy
Synopsis
Pediatric brain glioma is a very devastating brain tumour and the most frequent solid tumour in children. Differentiating low- from high-grade glioma without the use of invasive biopsy is important to optimize patient management strategies yet difficult with imaging alone. Diffusion kurtosis imaging is then an emerging technique that has shown the ability of discriminating grades in adults. We make use of multislice approach to acquire and evaluate kurtosis metrics in brain gliomas and show how estimation of the heterogeneity of the tumour might be indicative of its grade.
Introduction
Pediatric brain glioma is a very devastating brain tumour among children, with an annual incidence of approximately three per 100 000 (1). Differentiating low- from high-grade glioma without the use of invasive biopsy is important to optimize patient management strategies and determine the time point when benign tumors begin to transform into malignant lesions. Unlike low-grade, high-grade brain gliomas can have a higher degree of tissue heterogeneity. Diffusion kurtosis imaging is an emerging technique based on non-gaussian diffusion of water in biologic systems. The method provides complementary information to the traditional diffusion and its application to brain tumor to identify novel biomarkers has been considered very promising in adults (2). Unfortunately, diffusion kurtosis suffers from long time acquisition, which tends to reduce the applicability to clinical environment. This issue is even more pronounced when the kurtosis data are acquired in children because of either scarce compliance or the use of general anesthesia. However, a recent technique, named simultaneous multi-slice (SMS) acquisition, allows multiple slices acquisition thus drastically reducing the acquisition time. The aim of this study is to test whether kurtosis parameters may help us to differentiate low from high grade gliomas in children when acquiring a feasible protocol via SMS approach.Materials and Methods
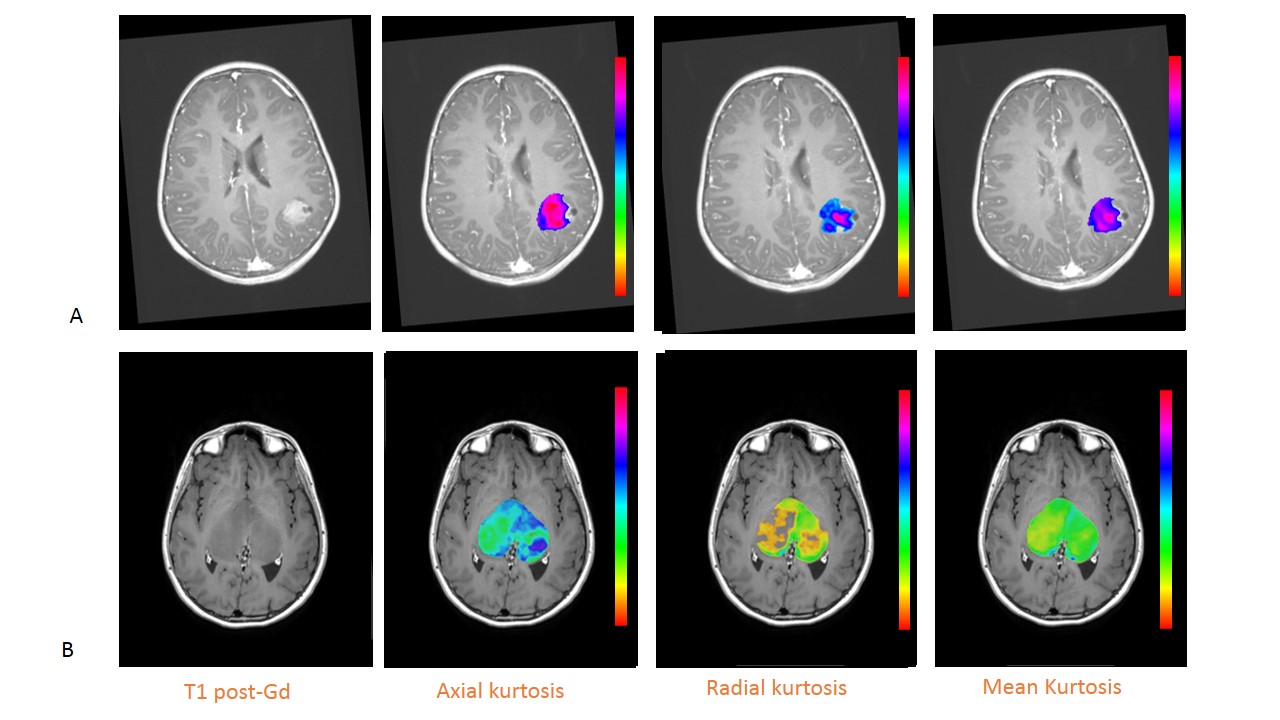
After obtaining informed consent and during a period of time of 18 months, thirty-two consecutive children (median age 8.5 years, 17 M) affected by histologically confirmed brain gliomas were prospectively studied on a 3T magnet equipped with a 32-channel head coil. Along with a standard protocol for brain tumour, a diffusion SMS protocol (total acquisition time=8 minutes; FOV = 256x256mm, 46 slices, TR/TE = 4600/113ms, BW = 1562Hz/px, matrix resolution = 128x128, slice thickness = 2.0mm, GRAPPA factor = 2, Slice acceleration factor =2, Verse factor=2.2, 30 directions, b values=0,1000,2000 s/mm2) was acquired using a prototyping sequence from Siemens. Diffusion images were preprocessed in matlab to account for eddy current and moving artifact by using ACID toolbox for SPM. The data were also denoised and the diffusion and kurtosis tensors were computed by making use of mrtrix package (http://www.mrtrix.org/) (3). The actual kurtosis maps (kFA, kmean, Krad and Kax) were computed in Matlab (4). The post contrast MPRAGE was used to manually segment the areas of contrast uptake and the kurtosis maps were warped to the MPRAGE via diffeomorphic registration from ANTs (http://stnava.github.io/ANTs/). The mean and the 30th percentile of the highest values (H30%) within the segmented areas were then computed for the 4 maps. T-tests between the two groups along with the ROC curve were performed.Results
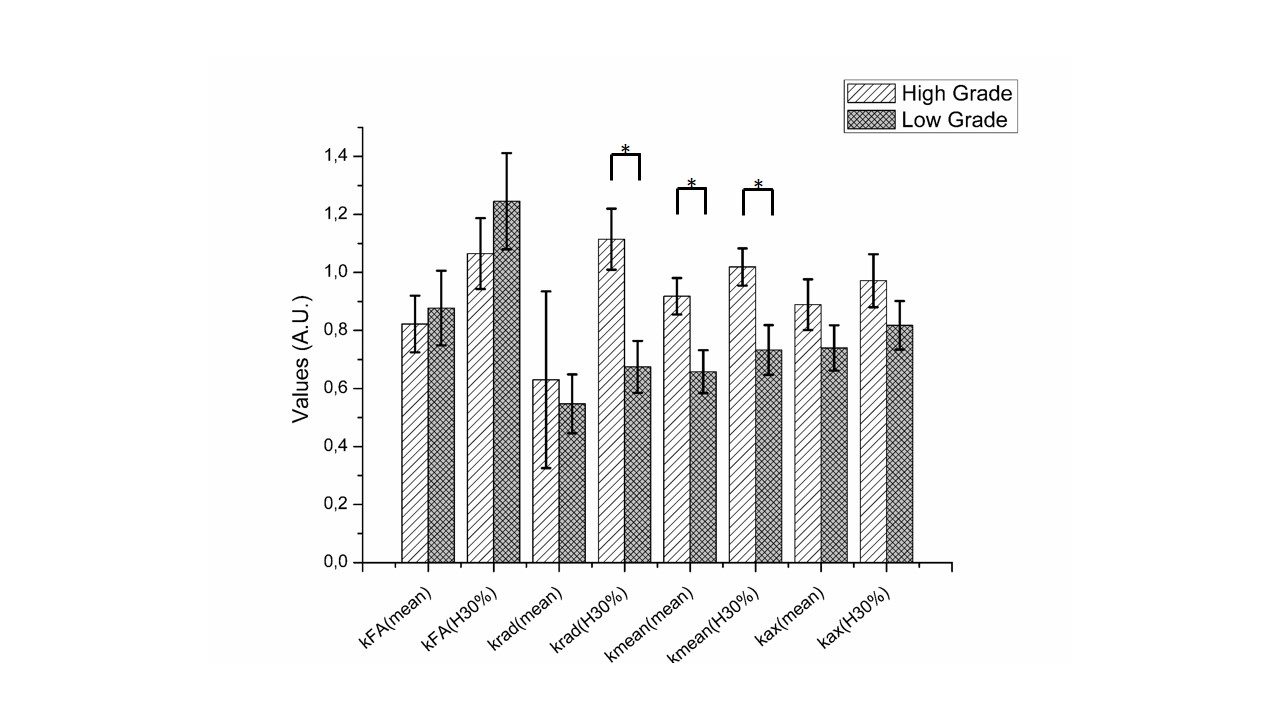
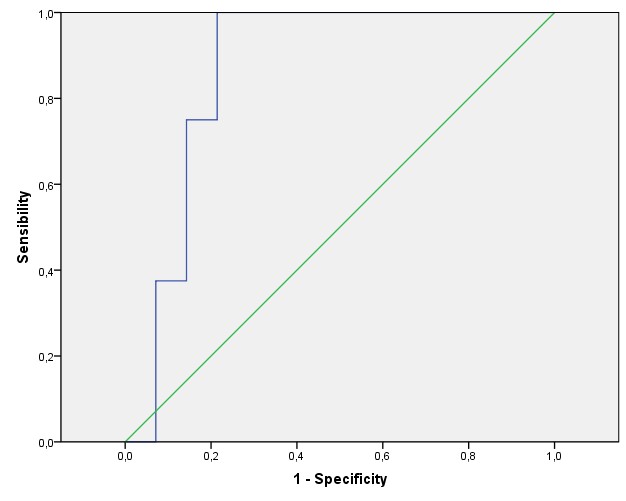
After excluding three patients for motion artifacts and six for absence of contrast uptake, the scans of twenty-two children (14 LGG and 8 HGG) were analyzed (Fig. 1). Significantly different H30% Krad, mean and H30% Kmean were found in the enhancing tumor VOI between LGG and HGG (p<0.006, p<0.03 and p<0.03 respectively) (Fig. 3). The ROC analysis showed a good performance of the H30% Krad with an area under the curve of 0.866 and an asymptotic significance equals to 0.005. A cutoff value of 0.82 for H30% Krad shows a sensibility of 75% and 21% for specificity (Fig 3).Discussion
To the best of our knowledge this is the first study investigating the application of this technique to gliomas in paediatric population. The kurtosis values and in particular the values of radial kurtosis has been shown to be lower in low grade gliomas and similarly the mean values of mean kurtosis. The hot spots of krad (H30%) compared to the mean values of krad could be indicative of the complexity of the tumour brain heterogeneity.Conclusion
This study indicates how the use of diffusion kurtosis acquired via multi-slice acquisition in children leads to a good differentiation between low and high grade tumours. The 8 minutes acquisition protocol is then a good compromise to acquire enough number of directions to be able to fit the kurtosis tensor and shows the clinical feasibility of the SMS diffusion acquisition protocol.Acknowledgements
No acknowledgement found.References
1) Paldino MJ, Faerber EN, Poussaint TY. Imaging tumors of the pediatric central nervous system. Radiol Clin North Am 2011;49(4):589–616,
2) Wu EX, Cheung MM. MR diffusion kurtosis imaging for neural tissue characterization. NMR Biomed 2010; 23:836–848
3) Veraart, J.; Sijbers, J.; Sunaert, S.; Leemans, A. & Jeurissen, B. Weighted linear least squares estimation of diffusion MRI parameters: strengths, limitations, and pitfalls. NeuroImage, 2013, 81, 335-346
4) Tabesh A, Jensen JH, Ardekani BA, Helpern JA. Estimation of tensors and tensor-derived measures in diffusional kurtosis imaging. Magn Reson Med 2011; 65:823-836.
Figures