2142
A Large Scale Radiomics Profiling Strategy for Glioma Overall Survival Prediction1Medicine and Therapeutics, The Chinese University of Hong Kong, Hong Kong, China, 2Research Center for Medical Image Computing, The Chinese University of Hong Kong, Hong Kong, China, 3Philips Healthcare, Hong Kong, China
Synopsis
Glioma is the most common brain intracranial malignancy, which accounts for about 80% of malignant brain tumors in adults and its median survival rate is 12 months. In clinical, how to accurately predict the glioma overall survival (GOS) is a crucial work and it will be beneficial to monitor tumor progression, execute surgery as well as plan radiotherapy and follow-up studies. However, the glioma generally has highly heterogeneity degrees in the histological tumor sub-regions. we propose a comprehensive multi-modality MRI radiomics way of predicting the GOS. Different features are proposed committing to different image modalities. A feature selection strategy is applied for the optimal features and then random forest is contributed to the classification of short-survivors and long-survivors. With the performance evaluation criteria, our model showed promising classification ability for the brain tumor.
Introduction
Glioma is the most common brain intracranial malignancy, which accounts for about 80% of malignant brain tumors in adults1 and its median survival rate is 12 months2. In clinical, how to accurately predict the glioma overall survival (GOS) is a crucial work and it will be beneficial to monitor tumor progression, execute surgery as well as plan radiotherapy and follow-up studies. However, the glioma generally has highly heterogeneity degrees in the histological tumor sub-regions3. Radiomics is an emerging filed which focuses on converting imaging data into high dimensional mineable quantitative features to extract more valuable information from imaging.4, 5 It provides a non-invasive way of exploring the relationship between GOS and image descriptors such as tumor appearance, shape, size, intensity, position and texture. 6Methods
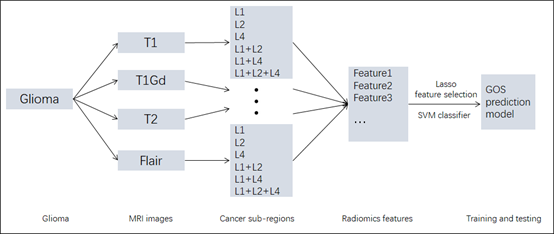
We use the Brain Tumor Image Segmentation Challenge (BRATS)7 dataset which contains 163 glioma patient MRI images provided T1, T1Gd, T2, FLAIR MRI modalities and corresponding tumor regions. We divide the patients into two groups, the short-survivors group (survival time ≤ 12 months, 82 patients) and the long-survivors group (survival time > 12 months, 81 patients).
The framework includes following parts. Firstly, quantitative features extraction. The features include First-order Statistics (19 kinds) features, Gray Level Co-occurence Matrix (GLCM, 27 kinds) features, Gray Level Run Length Matrix (GLRLM, 16 kinds) features, Gray Level Size Zone Matrix (GLSZM, 16 kinds) features. Besides, the Laplacian of Gaussian (LoG, with sigma 2.0, 3.0, 4.0 and 5.0) and Wavelet (eight types, HHH, HHL, LLH, HLL, LHH, LHL, LLH and LLL) are applied combined with the above 78 kinds of features so that 78 * 4 kinds of LoG = 312 and 78 * 8 kinds of Wavelet = 624 features are extracted. And Shape-based (16 kinds) features are also extracted. Therefore, for one cancer region in one kind of MRI modality, totally 78 + 312 + 624 + 16 = 1030 features are extracted. We have three kinds of cancer regions standing for different cancer progressing and they are labeled as Lesion1 (L1), Lesion(L2) and Lesion(L4), which stand for the necrotic and non-enhancing tumor, the peritumoral edema and the GD-enhancing tumor respectively. To explore the relationship between the survival and the different lesion types, we combine the lesions and apply the 1030 features to them respectively. So that for one MRI modality, we get 1030 * 7 kinds of lesion regions (L1, L2, L4, L1+L2, L1+L4, L2+L4, L1+L2+L4) = 7210 features. Finally, for the four types MRI modality images (T1, T1Gd, T2, FLAIR), we get 7210 * 4 = 28840 features. Besides, patient age is also included for the GOS prediction. Secondly, training the GOS prediction model. Z-score normalization is applied to make all the extracted features have zero mean and unit variance and Least Absolute Shrinkage and Selection Operator (LASSO)8 is applied to remove irrelevant and redundant features. Support vector machine (SVM)9 model is then used for classification of the short-survivors and long-survivors groups. Finally, ten-fold cross-validation10 is applied to evaluate the generalization performance for GOS.
Results
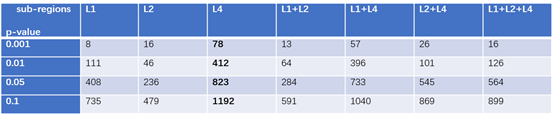
Identifiable quantitative features in group-level are beneficial for assisting tumor diagnosing and improving medical decision-support.4 Therefore, for all the 28841 features in the two groups, we performed independent two-sample t-test to find differentiable features which may be useful for the survival prediction between the two groups. Here the tumor sub-regions were explored and a series of significant level p values (e.g. p < 0.001, p< 0.01) were employed to find significant group level different features.
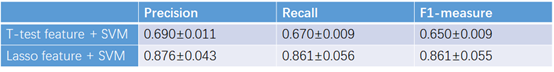
Lasso feature selection was performed on the t-test significant group level features and SVM was conducted after the feature selection to build the prediction model. We found that the GLCM features combined with Wavelet and LoG transform have great discrimination for the short-survivors and long-survivors group classification. Besides, the shape features as well as patient age also survive after the lasso feature selection. To evaluate the effectiveness of the extracted feature and the selected feature, we respectively employed SVM model to the group significant different features at p < 0.01 level (totally 1256 kinds) and the selected features (44 kinds) by lasso. Recall and precision as well as F1-measure are calculated for ten-fold cross-validation.
Conclusion
In this paper, we propose a comprehensive multi-modality MRI radiomics way of GOS prediction model. Numerous features are extracted for acquiring more information from the MRI images and lasso feature selection strategy is applied for the optimal features. SVM is contributed to the classification of short-survivors and long-survivors. With the performance evaluation criteria, our model showed promising classification ability for the glioma tumor survival prediction.Acknowledgements
We acknowledge the researchers contributing to the BRATS dataset.
References
1. Ostrom, Q.T., et al., The epidemiology of glioma in adults: a “state of the science” review. Neuro-oncology, 2014. 16(7): p. 896-913.
2. Marko, N.F., et al., Extent of resection of glioblastoma revisited: personalized survival modeling facilitates more accurate survival prediction and supports a maximum-safe-resection approach to surgery. Journal of Clinical Oncology, 2014. 32(8): p. 774-782.
3. Menze, B.H., et al., The multimodal brain tumor image segmentation benchmark (BRATS). IEEE transactions on medical imaging, 2015. 34(10): p. 1993-2024.
4. Aerts, H.J., et al., Decoding tumour phenotype by noninvasive imaging using a quantitative radiomics approach. Nature communications, 2014. 5.
5. Lambin, P., et al., Radiomics: extracting more information from medical images using advanced feature analysis. European journal of cancer, 2012. 48(4): p. 441-446.
6. Dai, L., et al., Computer-aided diagnosis of diagnostically challenging lesions in breast MRI: a comparison between a radiomics and a feature-selective approach. 2016. 9871: p. 98710H.
7. Bakas, S., et al., Advancing The Cancer Genome Atlas glioma MRI collections with expert segmentation labels and radiomic features. Scientific Data, 2017. 4: p. sdata2017117.
8. Tibshirani, R., Regression shrinkage and selection via the lasso. Journal of the Royal Statistical Society. Series B (Methodological), 1996: p. 267-288.
9. Cortes, C. and V. Vapnik, Support-vector networks. Machine learning, 1995. 20(3): p. 273-297. 10. Kohavi, R. A study of cross-validation and bootstrap for accuracy estimation and model selection. in Ijcai. 1995. Stanford, CA.
Figures