2140
Robust Quantification of Changes in Arterial Cerebral Vasculature Post Radiation Therapy in Pediatric Brain Tumor Survivors1Department of Radiology and Biomedical Imaging, University of California, San Francisco, San Francisco, CA, United States, 2Department of Neurology, University of California, San Francisco, San Francisco, CA, United States, 3Department of Neurological Surgery, University of California, San Francisco, San Franciso, CA, United States
Synopsis
With the improved long-term survival of children with brain tumors, understanding the late effects of their therapy on small arterioles is of great importance. We developed a method for robust segmentation of arteries and quantification of their thickness using TOF-MRA at 7T and estimated the vessel radii distribution in irradiated patients compared to controls. Radiation-induced damage to the microvasculature resulted in a higher fraction of small vessels observed with time from radiation therapy, likely due to vessel thinning.
Purpose:
Although cranial radiation therapy (CRT) plays an important role in the treatment of pediatric brain tumors, it is often associated with significant long-term side effects that include cognitive deficits1-4. Although late toxicities of RT that include vascular injury in the form of cavernous malformations, atherosclerosis, small vessel occlusive disease and cerebral microbleeds (CMBs)5 have been reported, the effects of RT on the arteriole thinning in the brain, a known risk factor for vascular events6, has not been explored in this setting. The goal of this study was to develop a pipeline for robust segmentation and thickness quantification of arteries in order to evaluate the long-term effects of RT on arteriole thinning.Methods:
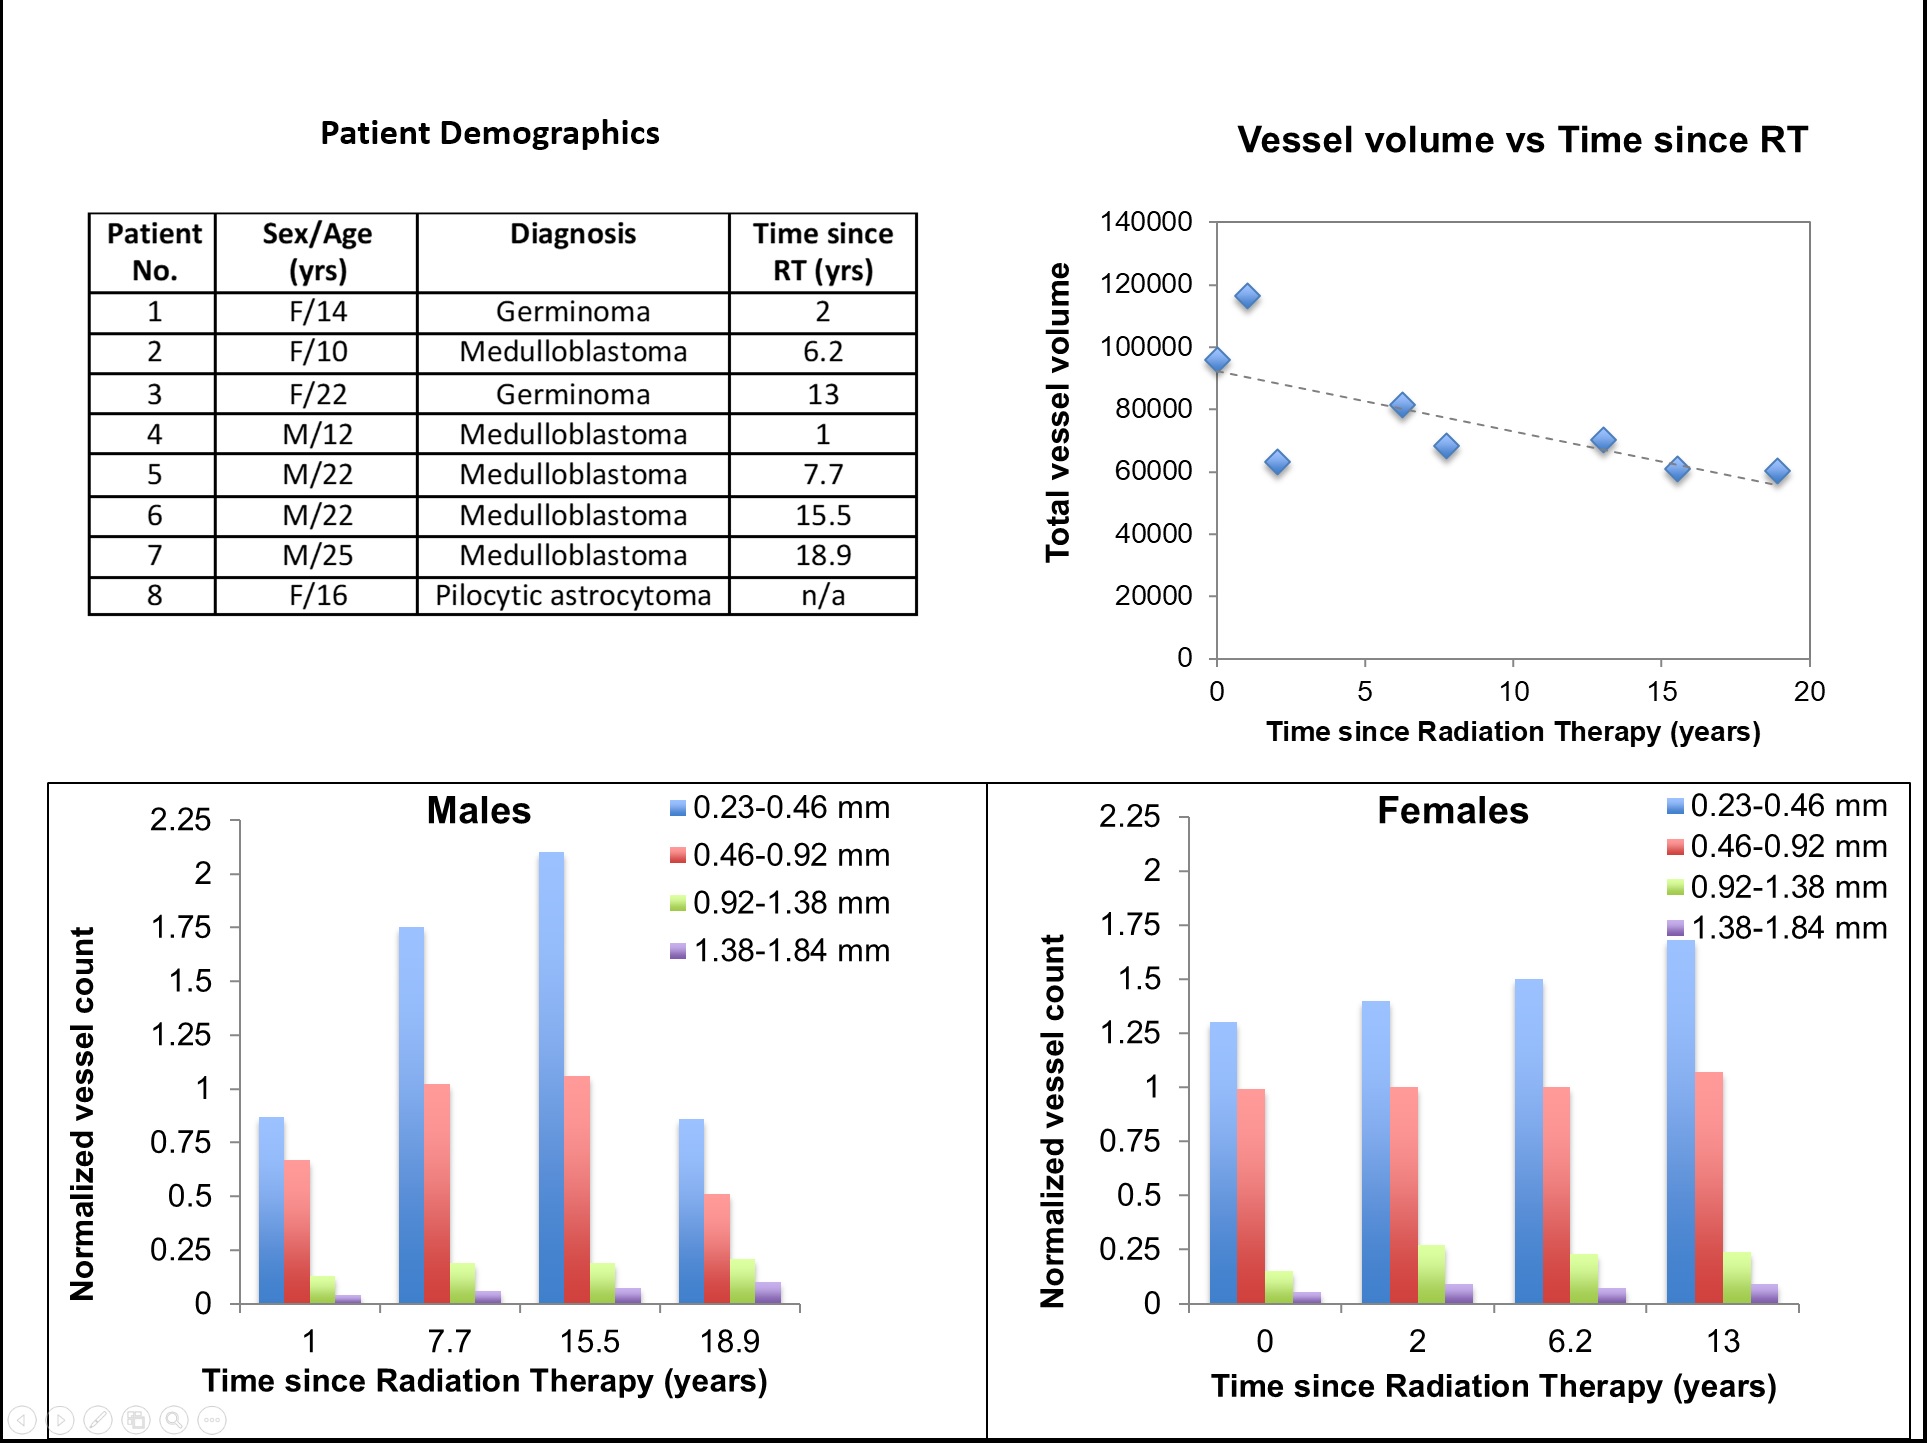
Subjects & Data Acquisition: Three healthy younger-adult volunteers (mean age 25 ± 2.2years; 2 scanned twice) and nine young adult patients who were treated for a posterior fossa tumor as children (5 female, 4 male; mean age 17.6 ± 5.0) were scanned at 7T with a 32-channel phased-array coil and a protocol that consisted of a high-resolution TOF-MRA as part of a multi-echo SWI/TOF-MRA sequence7 (FOV: 24x24x7.2cm, in-plane resolution: 0.46x0.46mm, slice thickness: 1mm, flip angle:25, TR:40ms). The pediatric patients were treated with uniform whole-brain CRT approximately 5 months to 19 years’ prior for brain tumor.
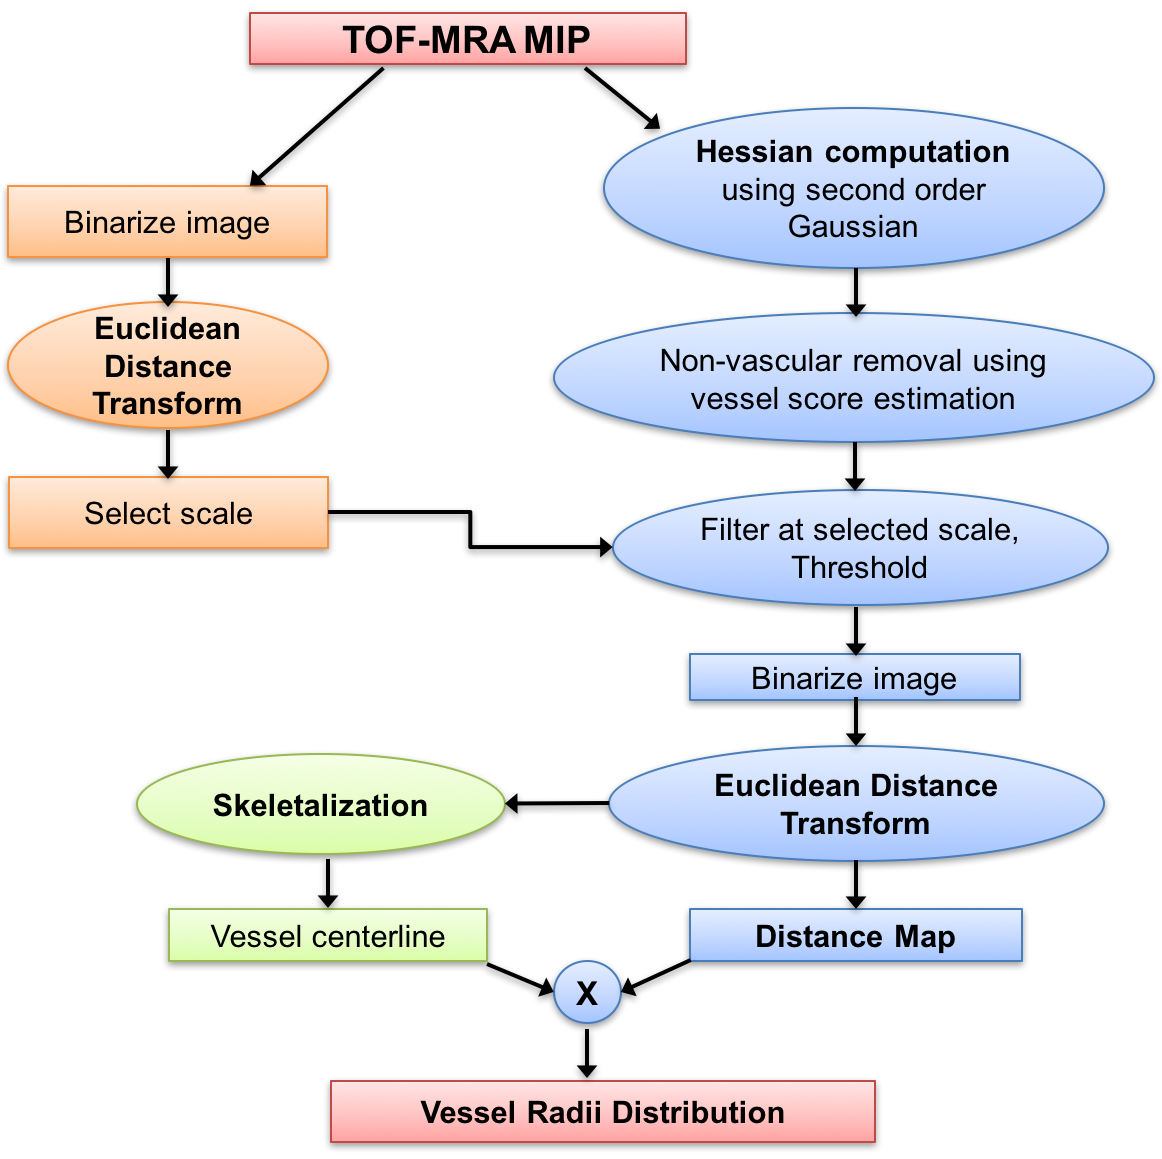
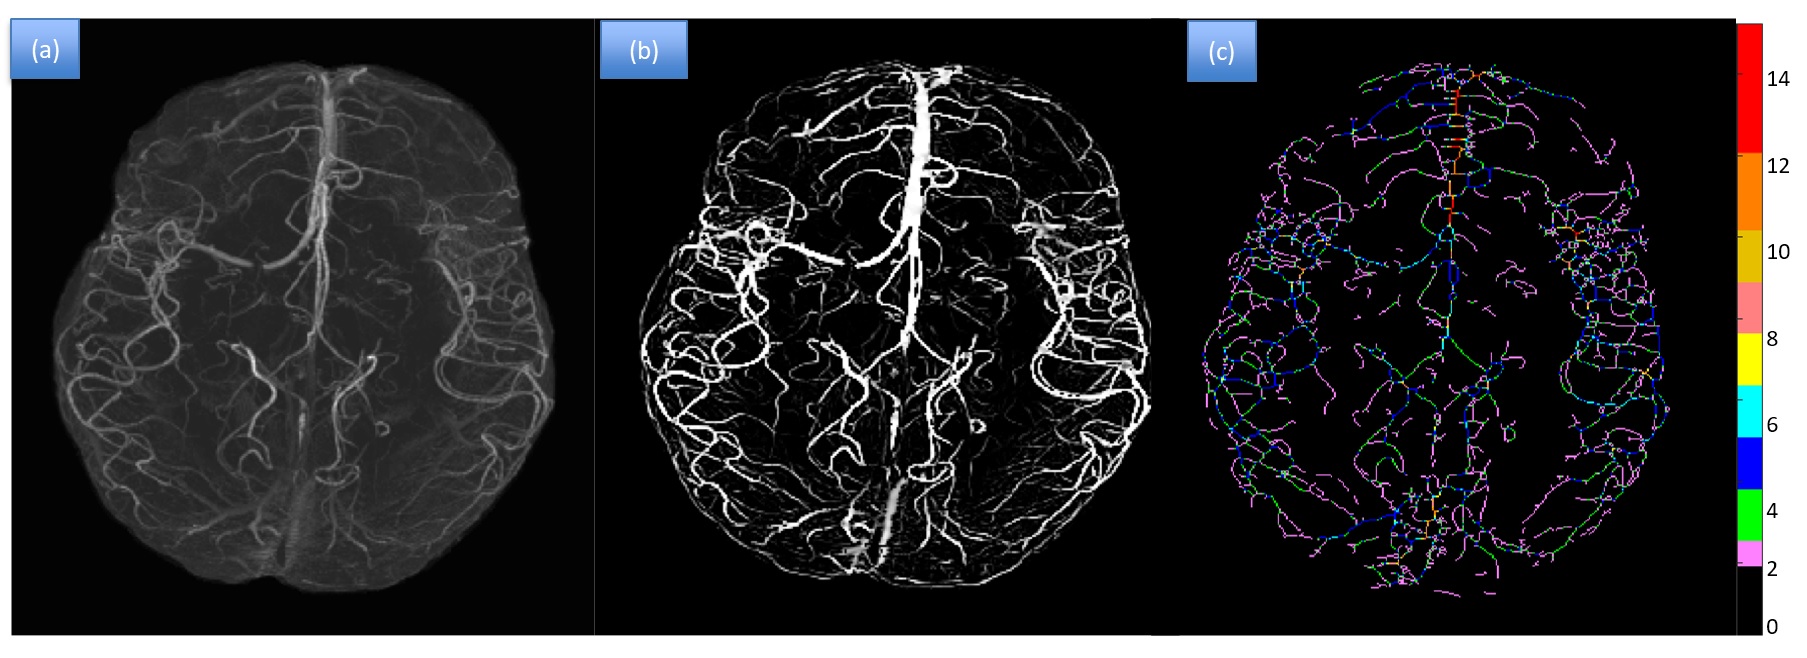
Image Processing: Brain extraction was first performed using FSL BET8 and the TOF-MRA echo was resampled to 0.2mm isotropic resolution using bi-cubic interpolation. An eroded brain mask was applied on the image in order to exclude the outer boundary of the brain from analysis. Analysis was performed on both a 2D Maximum Intensity Projection (MIP) image and the whole 3D volume using MATLAB9. Maps of vessel radii were then generated using the pipeline described in Figure 1, where an adaptive Frangi filter10 based on Gaussian derivatives combined with thresholding was applied to segment arteries from background tissue. A 2D Euclidean Distance Transform (EDT) map, which labels each pixel of the image with the distance to the nearest boundary pixel, is then calculated and multiplied with the skeleton of the binary image to yield the final vessel radii map11 (Figure 2).
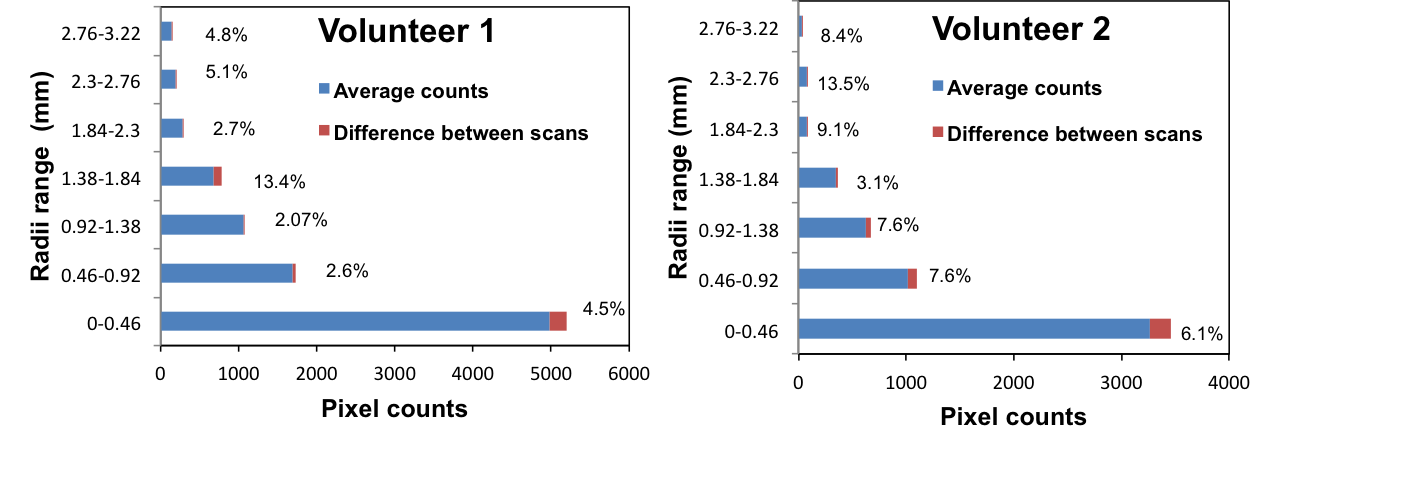
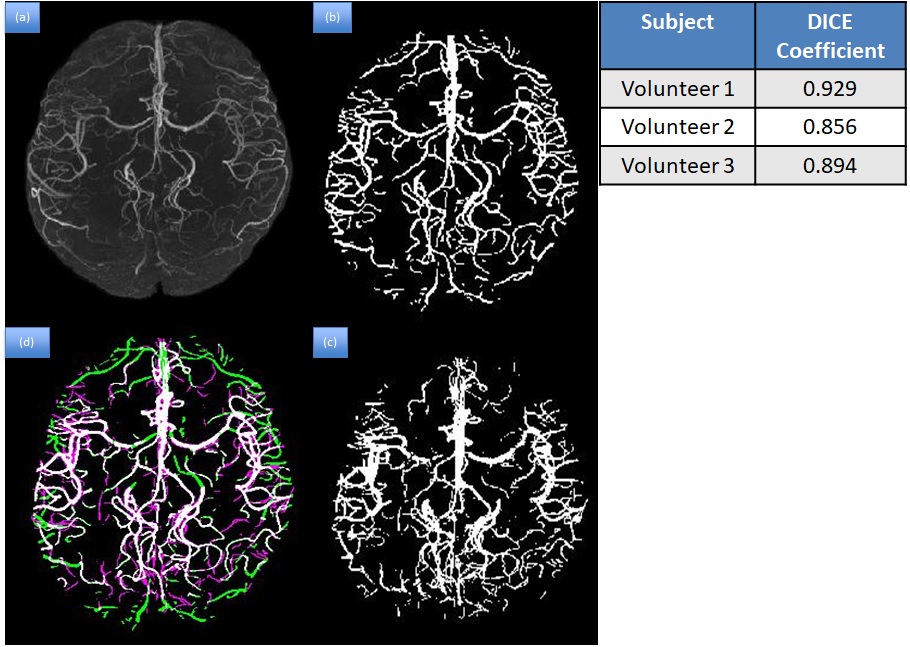
Analysis: The performance of the method was compared to the results from manual segmentation by a radiologist in the 3 volunteers using a DICE coefficient. Repeatability of the segmentation was also assessed from the repeated volunteer scans. The vessel radii distribution was normalized by the imaged head volume and segmented arterial volume. Histograms of arterial thickness were then plotted and compared among patients and volunteers. Since vessel radii depend on gender12, the vessel distribution normalized by the total vessel volume was obtained separately for males and females.
Results & Discussion:
Figure 2 shows the results of the segmentation and thickness
map for one of the patients. The repeatability test done on the
volunteers demonstrated that the percentage difference between the two scans varied
from 2.6% to 13.5% (Figure 3). Overall, good correlation was found between the
manual and auto segmentation, with the mean Dice coefficient for the 3
volunteer images equal to 0.893 (Figure 4). The total volume of vessels reduced
as the time since RT increased (Figure 5b). The normalized vessel count for the smallest arteries
(0.23-0.46 mm) increased with respect to time since RT for both males
and females (Figure 5c,d), suggesting arterial narrowing due to radiation, whereas no obvious trends were observed in
the medium and high radii vessel counts.Conclusion:
Our preliminary analyses demonstrate the feasibility of quantifying changes in arterial thickness due to RT with our method. As hypothesized, it appears that smaller arteries become narrower over time since receiving RT. We anticipate that the pipelines developed in this paper will greatly facilitate future analyses that will assess radiation-induced vascular injury in larger cohorts.Acknowledgements
The authors would like to acknowledge the support received from the grant R01HD079568References
[1] Armstrong GT. Long-term survivors of childhood central nervous system malignancies: the experience of the Childhood Cancer Survivor Study. European journal of pediatric neurology: EJPN: official journal of the European Paediatric Neurology Society. 2010;14(4):298–303
[2] Mulhern RK, Palmer SL, Reddick WE, et al. Risks of young age for selected neurocognitive deficits in medulloblastoma are associated with white matter loss. Journal of clinical oncology: official journal of the American Society of Clinical Oncology. 2001;19(2):472–479
[3] Reeves CB, Palmer SL, Reddick WE, et al. Attention and memory functioning among pediatric patients with medulloblastoma. J Pediatr Psychol. 2006;31(3):272–280
[4] Robinson KE, Kuttesch JF, Champion JE, et al. A quantitative meta-analysis of neurocognitive sequelae in survivors of pediatric brain tumors. Pediatr Blood Cancer. 2010;55(3):525–531
[5] Taphoorn M, Klein M. Cognitive deficits in adult patients with brain tumors. Lancet Neurol. 2004;3(3):159–168
[6] Gutierrez, J., Cheung, K., Bagci, A., Rundek, T., Alperin, N., Sacco, R. L., … Elkind, M. S. V. (2015). Brain Arterial Diameters as a Risk Factor for Vascular Events. Journal of the American Heart Association: Cardiovascular and Cerebrovascular Disease, 4(8), e002289
[7] Bian, W., Banerjee, S., Kelly, D. A. C., Hess, C. P., Larson, P. E. Z., Chang, S. M., …Lupo,J.M. (2015). Simultaneous imaging of radiation-induced cerebral microbleeds, arteries and veins, using a multiple gradient echo sequence at 7 Tesla. Journal of Magnetic Resonance Imaging
[8] Jenkinson, M., M. Pechaud, and S. Smith, BET2: MR-Based Estimation of Brain, Skull and Scalp Surfaces, in In Eleventh Annual Meeting of the Organization for Human Brain Mapping. 2005
[9] MATLAB 8.6, The MathWorks, Inc., Natick, Massachusetts, United States
[10] Frangi, A. F., Niessen, W. J., Vincken, K. L., & Viergever, M. A. (1998). Multiscale vessel enhancement filtering. Medical Image Computing and Computer-Assisted Intervention, 1998
[11] Dury, R. J., Mason, S. L., Cicchetti, F., Drouin-Ouellet, J., Barker, R. A., Gowland, P. A., & Francis, S. T. (n.d.). Assessment of cerebral vascular abnormalities in Huntington’s Disease at 7Tesla. ISMRM 2017
[12] Bullitt, E., Zeng, D., Mortamet, B., Ghosh, A., Aylward, S. R., Lin, W., … Smith, K. (2010).The effects of healthy aging on intracerebral blood vessels visualized by magnetic resonance angiography. Neurobiology of Aging, 31(2), 290–300
Figures