2138
Gadolinium concentration map based on synthetic MRI and its application to brain metastases1Department of Radiology, Juntendo University School of Medicine School of Medicine School of Medicine, Tokyo, Japan, 2Graduate School of Medicine, The University of Tokyo, Tokyo, Japan, 3Graduate School of Human Health Sciences, Tokyo Metropolitan University, Tokyo, Japan
Synopsis
Signal intensity measured on T1-weighted image is not proportional to the gadolinium concentration in vivo after administration of contrast agent. Thus, some calculations are required to estimate gadolinium concentration using quantitative values before and after gadolinium administration. We created gadolinium concentration maps that directly show the amount of contrast agent using quantitative maps calculated using synthetic MRI. The gadolinium concentration map we created using phantoms showed high accuracy and precision. The gadolinium concentration map could reliably measure the concentration of gadolinium in metastatic brain tumors.
Background and Purpose
Signal intensity on T1-weighted image is not proportional to the gadolinium concentration in vivo after administration of contrast agent(1). Thus, some calculations are required to estimate gadolinium concentration using quantitative values. In contrast to signal intensity, the absolute concentration could be reliably used for diagnosis or follow-up of brain diseases. In this study, we created gadolinium concentration maps using quantitative values acquired by synthetic MRI, which enables quantification of T1 and T2 values from one quantitative scan(2,3). The gadolinium concentration map can directly show the concentration of contrast agent in vivo. The aim of this study was to assess the accuracy and precision of gadolinium concentration maps created using synthetic MRI, and to evaluate the applicability of gadolinium concentration maps to brain metastases.Materials and Methods
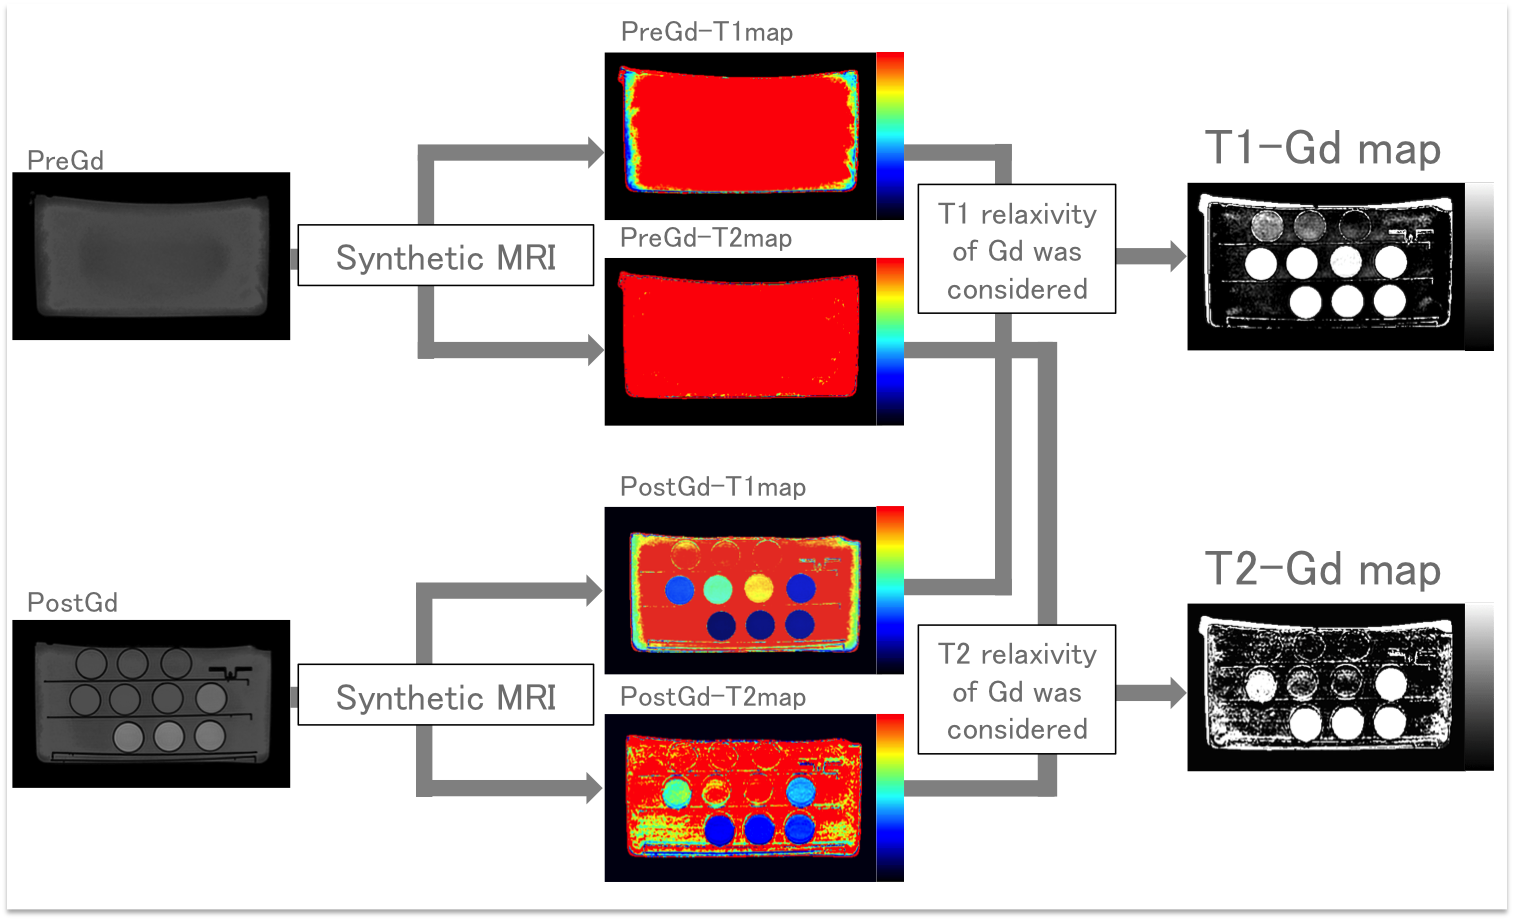
The phantoms of water and 9 kinds of diluted gadolinium solutions (0.021–1.00 mmol/L) were scanned by synthetic MRI on a 3.0-T MRI system (Discovery MR750w, GE Healthcare, Milwaukee, USA), and quantitative maps were created on SyMRI software (SyntheticMR AB, Linköping, Sweden). Two types of gadolinium concentration maps (T1-Gd map and T2-Gd map) were created using T1 and T2 quantification maps each from water and diluted gadolinium solutions, respectively (Fig.1). We performed region-of-interest (ROI) analysis on each phantom on these two maps and recorded mean values and standard deviations (SDs). To assess the accuracy of the gadolinium concentration maps, we compared measured gadolinium concentrations to the known values. To assess the precision, we compared SDs between T1-Gd and T2-Gd maps. For statistical analysis, we used the Wilcoxon signed rank test. P values less than 0.025 (corrected with Bonferroni method) and 0.05 were considered to be significant for accuracy and precision assessment, respectively.
Ten patients with metastatic brain tumors (8 men and 2 women; mean age, 64.8 years; age range, 44-75 years, 152 lesions) were scanned by synthetic MRI. Contrast agent used was Prohance (Gadoteridol :Eisai Co., Ltd.). We created gadolinium concentration map as described previously. ROI analysis was performed on these tumors and maximum values were recorded.
Results
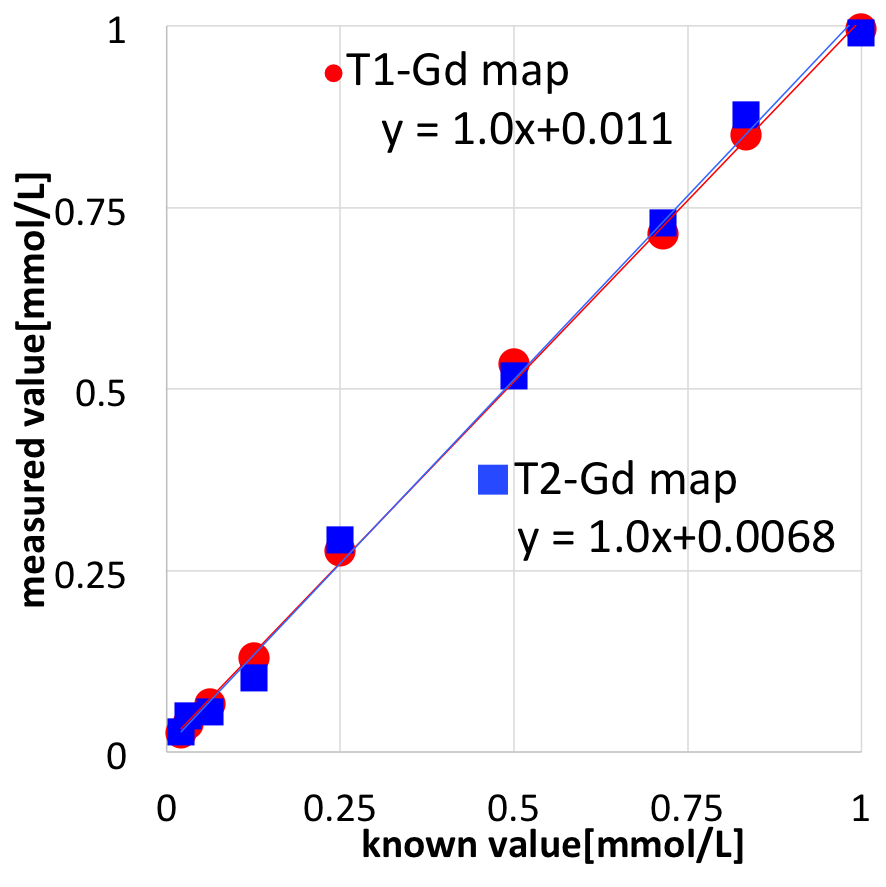
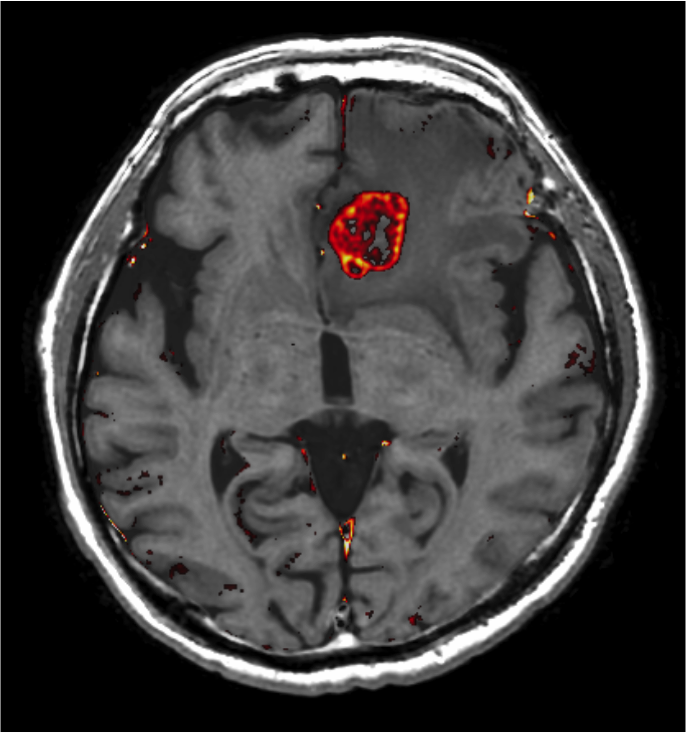
For the phantom study, measured and known values showed linear proportionality on Gadolinium concentration maps, with slopes on regression analysis to be 1.00 and 1.01 for T1-Gd and T2-Gd maps, respectively (Fig. 2). The results of accuracy assessment showed no significant difference between measured values on each Gd map and known values (P = 0.027 and 0.25 for Gd-T1 and Gd-T2 maps, respectively). On assessment of precision, SDs of T1-Gd map was significantly smaller than those of T2-Gd map (P = 0.0039). Based on the results of the phantom experiment, we decided that T1-Gd map had better quality than T2-Gd map. Thus, we adopted T1-Gd map for evaluation of gadolinium concentration maps with application to brain metastases. Out of 152 metastases identified on conventional contrast-enhanced T1-weighted images, 7 lesions could not be identified on T1-Gd map, thus, 145 lesions were measured on the T1-Gd map. The maximum value of measured values was in the range of 0.049–0.96 [mmol/L], which was within the range of values evaluated in the previous phantom study (Fig.3).Discussion
In the phantom study, linear proportionality between measured values and known values were shown for T1-Gd and T2-Gd maps, and no significant difference between measured and known values were detected for these Gd maps, validating the high accuracy of these Gd maps. On the other hand, SDs of T2-Gd map were significantly larger than those of T1-Gd map. This means that precision of T1-Gd map was better than T2-Gd map. Because B1 inhomogeneity can affect calculation of T1 value(4), on synthetic MRI, B1 maps are acquired to correct B1 inhomogeneity(2,3). Synthetic MRI was performed by using fast spin-echo pulse sequence. In fast spin-echo, effects of eddy currents are variable in each echo, which can result in unevenness and artifacts of images(5). On synthetic MRI, T2 values were calculated based on 2 different echoes without correction of eddy currents, which may have resulted in higher SDs for T2 Gd-map. The reason why 7 lesions could not be identified on Gd-maps was mainly because of the misregistration between pre- and post-gadolinium images due to 2D acquisition method. Realization of 3D acquisition is still awaited for solving this problem.Conclusion
This study showed the high accuracy and precision of gadolinium concentration maps created using synthetic MRI. T1-Gd map showed comparable accuracy and higher precision compared with T2-Gd map. The maximal gadolinium concentration in the metastatic tumors was within the range of the values evaluated in the phantom study, showing the validity of gadolinium concentration maps in use of clinical settings.Acknowledgements
This work was funded by ImPACT Program of Council for Science, Technology and Innovation (Cabinet Office, Government of Japan).References
1. Horsthuis K, Nederveen AJ, de Feiter MW, Lavini C, Stokkers PC, Stoker J. Mapping of T1-values and Gadolinium-concentrations in MRI as indicator of disease activity in luminal Crohn's disease: a feasibility study. J Magn Reson Imaging 2009;29(2):488-493.
2. Warntjes JB, Leinhard OD, West J, Lundberg P. Rapid magnetic resonance quantification on the brain: Optimization for clinical usage. Magn Reson Med 2008;60(2):320-329.
3. Hagiwara A, Warntjes M, Hori M, et al. SyMRI of the Brain: Rapid Quantification of Relaxation Rates and Proton Density, With Synthetic MRI, Automatic Brain Segmentation, and Myelin Measurement. Invest Radiol 2017;52(10):647-657.
4. Kingsley PB, Ogg RJ, Reddick WE, Steen RG. Correction of errors caused by imperfect inversion pulses in MR imaging measurement of T1 relaxation times. Magn Reson Imaging 1998;16(9):1049-1055.
5. Zhou XJ, Tan SG, Bernstein MA. Artifacts induced by concomitant magnetic field in fast spin-echo imaging. Magn Reson Med 1998;40(4):582-591.
Figures