2137
Growth patterns of non-enhancing glioma assessed on DTI-derived isotropic and anisotropic maps are not associated with IDH and 1p19q codeletion statusRenske Gahrmann1, J.K.H. Spoor2, MMJ Wijnenga3, S Leenstra2, AJPE Vincent2, M de Groot4, PJ French3, MJ van den Bent3, and M Smits1
1Radiology and Nuclear Medicine, Erasmus MC, University Medical Center, Rotterdam, Netherlands, 2Neurosurgery, Erasmus MC, University Medical Center, Rotterdam, Netherlands, 3The Brain Tumor Center, Erasmus MC, University Medical Center, Rotterdam, Netherlands, 4Medical Informatics, Erasmus MC, University Medical Center, Rotterdam, Netherlands
Synopsis
Previous reports show that IDH-mutation status can be determined in glioblastoma using DTI-derived isotropic (p) and anisotropic (q) maps to measure infiltrative growth along white matter tracts by determining the extent or pattern of p/q mismatch: abnormal p overlaps normal q-areas by >0.5cm. We use this method in presumed low-grade (i.e. non-enhancing) gliomas to see if infiltrative growth patterns correlate with IDH-mutation and 1p19q codeletion status, which in turn are correlated with prognosis.
Introduction
The World Health Organization (WHO) classification distinguishes between astrocytomas with and without a mutation in isocitrate dehydrogenase (IDH) 1 or 2, while characterizing oligodendrogliomas by the presence of an IDH-mutation (IDHmt) in combination with a codeletion of chromosomal arms 1p and 19q.1 Many of these gliomas show no enhancement on T1-weighted (T1w) post-contrast images. On occasion, non-enhancing gliomas are diagnosed as glioblastoma (WHO grade IV) due to accompanying hallmark genetic changes (IDH wild-type/wt, EGFR amplification, and loss of chromosome 10). While on imaging these tumors do not appear aggressive, their prognosis is almost as dismal as that of glioblastoma. It is therefore important to predict different molecular subtypes in non-enhancing glioma as it may influence treatment. Differentiating between slow-growing and more aggressive glioblastomas by measuring infiltrative growth along white matter tracts by using Diffusion Tensor Imaging (DTI)-derived isotropic (p) and anisotropic (q) maps has been reported by Price et al.2 The extent of infiltration was predictive for molecular status (IDHmt or IDHwt) in this patient group. We use the same technique in non-enhancing (presumed low-grade) gliomas to determine its predictive value for IDH- and 1p19q codeletion status in these tumors.Methods
All patients with a presumed low-grade glioma undergoing presurgical DTI between 2004 and 2013 from a single center were included. A targeted Next-Generation Sequencing panel (NGS) was used to determine the presence of IDHmt and 1p19q codeletion. FSL-DTIFit was used to extract eigenvectors, eigenvalues, and mean diffusivity. FSLmaths was used to calculate the p- and q-maps (see Figure1).3 A volume of interest (VOI) was drawn on the p-map and subsequently overlayed on the q-map to determine overlap with high-intensity areas (i.e. white matter tracts). A mismatch was present in case p overlapped q with >0.5mm in all directions (see Figure2).4 Two independent observers scored the following patterns of mismatch: I) no indication of infiltration (i.e. no p/q mismatch), II) single focus of infiltration, III) multifocal infiltration, IV) expansion of lesion into white matter tracts, and V) infiltration following white matter tracts (see Figure3). Patterns found in IDHmt and IDHwt and 1p19q codeleted and non-codeleted were compared with a Mann-Whitney U test and interobserver agreement evaluated with kappa.Results
A total of 84 patients with presurgical DTI for presumed low-grade glioma (i.e. non-enhancing) were identified. Of these, our sequencing panel revealed that four gliomas were IDHwt, 29 were IDHmt with a 1p19q codeletion, and 51 were IDHmt with intact 1p19q. In contrast to the previous publication by Price on glioblastoma, the four IDHwt gliomas all had a different pattern of infiltrative growth and could not be distinguished from the IDHmt gliomas using p/q maps. In addition, within the IDHmt tumors, no significant differences in pattern of growth between codeleted and non-codeleted tumors was found (Mann-Whitney U=759.5, p=0.816) (see Figure4). The interobserver agreement was moderate with a kappa of 0.473 (SE=0.068) or 62.7%.Discussion
Tumor infiltration along white matter tracts can be determined by an image intensity mismatch between isotropy (increased) and anisotropy (normal range). This mismatch has been successfully used to determine different infiltrative patterns in patients with glioblastoma in association with IDH-mutation status by Price et al.2,5 These promising results led us to apply this technique in presumed low-grade gliomas (i.e. non-enhancing tumors without necrosis). However, we were unable to distinguish different molecular subtypes based on pattern of infiltration. The two main possible explanations for this lack of ‘positive’ findings are that growth patterns in different molecular subtypes are quite similar, or that different patterns cannot be reliably distinguished with p/q mapping. The interobserver agreement of 62.7% is quite low, which could be explained by our study group (non-enhancing glioma only) as well as the number of categories used to describe the mismatch. There is selection bias in our study: only patients with non-enhancing tumors that underwent pre-surgical DTI were included. This is likely the reason only four patients with IDHwt glioma were found.Conclusion
Because of overlap in growth patterns between IDHwt and IDHmt and 1p19q codeleted and non-codeleted gliomas and the suboptimal interobserver concordance, this DTI-derived technique does not allow for the distinction of possible different molecular subtypes in non-enhancing gliomas.Acknowledgements
No acknowledgement found.References
- Louis DN, Perry A, Reifenberger G, et al. The 2016 World Health Organization classification of tumors of the central nervous system: a summary. Acta Neuropathol. 2016;131(6):803-820.
- Price SJ, Allinson K, Liu H, et al. Less invasive phenotype found in isocitrate dehydrogenase-mutated glioblastomas than in isocitrate dehydrogenase wild-type glioblastomas: a diffusion-tensor imaging study. Radiology. 2017;27(4):436-441.
- Price SJ, Pena A, Burnet NG, et al. Tissue signature characterization of diffusion tensor abnormalities in cerebral gliomas. Eur Radiol. 2004;14(10):1909-1917.
- Price SJ, Jena R, Burnet NG, et al. Improved delineation of glioma margins and regions of infiltration with the use of diffusion tensor imaging: an image-guided biopsy study. AJNR Am J Neuroradiol. 2006;27(9):1969-1974.
- Mohsen LA, Shi V, Jena R, et al. Diffusion tensor invasive phenotypes can predict progression-free survival in glioblastoma. Br J Neurosurg. 2013;27(4):436-441.
Figures
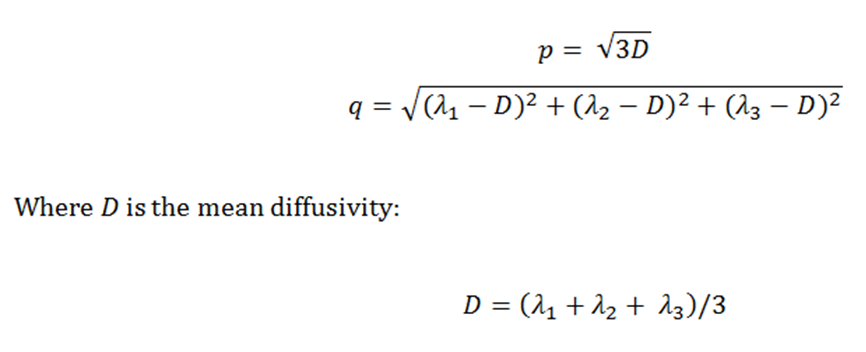
Figure1: Definition by Price et al.4 used
to create a pure isotropic (p) and
anisotropic (q) map.
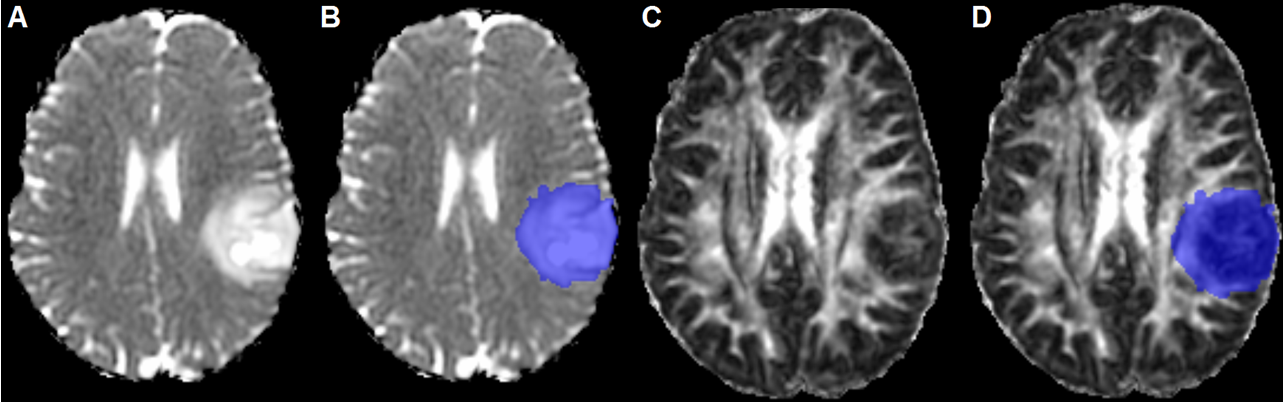
Figure2: Example of non-enhancing tumor clearly
visible on the p-map before (A) and
after (B) tumor segmentation. The
segmentation was overlayed on the q-map (C,
D). This example was scored as ‘expansion of lesion into white matter tracts’.
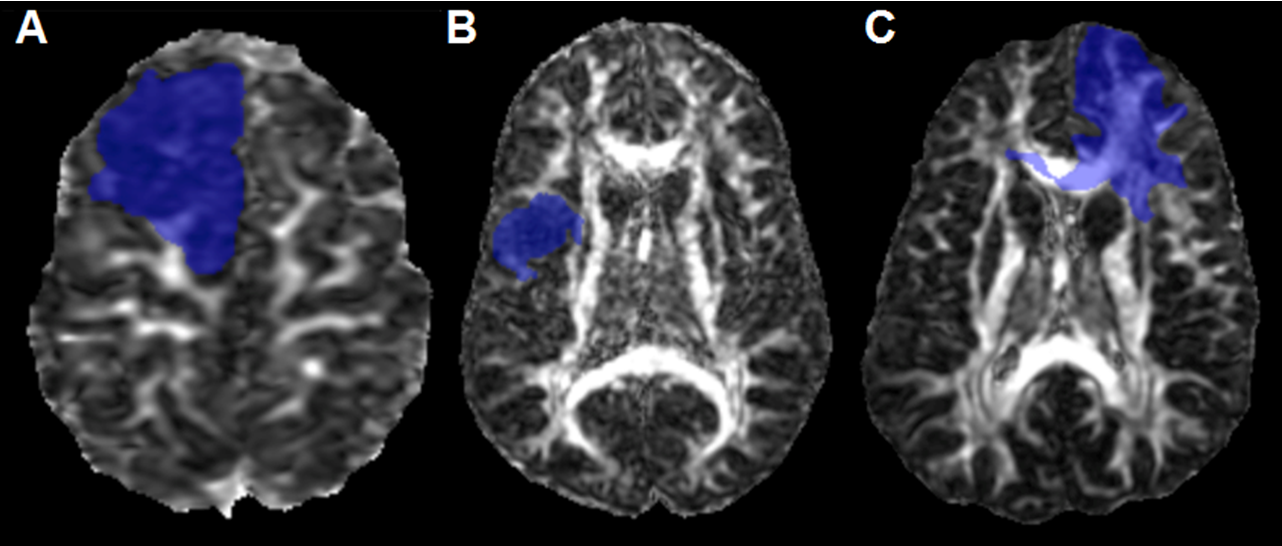
Figure3: Examples of different p/q mismatch
patterns: ‘single focus of infiltration’ (A),
‘multifocal infiltration’ (B), and
‘infiltration following white matter tracts’ (C).
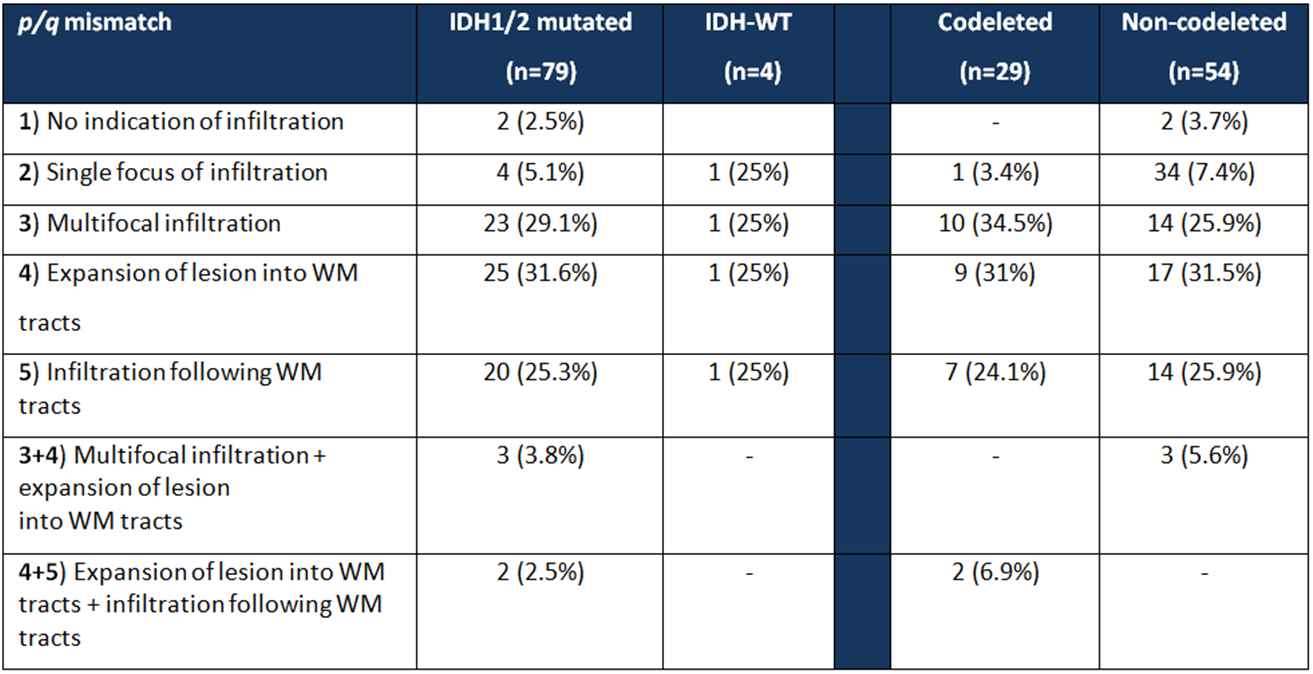
Figure4: Incidence of types of p/q mismatch assessment in IDHmt versus IDHwt and 1p19q codeleted
versus non codeleted. WM=white matter.