2134
Quantifying individual and collective prediction accuracy of MR contrasts for glioma tissue compartment classification1Radiology and Imaging Sciences, Indiana University, Indianapolis, IN, United States, 2Health Sciences, Purdue University, West Lafayette, IN, United States, 3Neurosurgery, Dayton Children's Hospital, Dayton, OH, United States
Synopsis
The purpose of this work was to evaluate the relative contributions of MR contrasts to tumor tissue classification. Seventeen (17) glioma patient datasets (WHO grade II-IV) containing T1, T1+gad, T2, FLAIR, and ADC were studied using multinomial logistic regression. T2 images had the highest individual classification accuracy (78.1%). Classification accuracy improved with each additional contrast, leading to an overall accuracy of 84.1% for all 5 contrasts. The multinomial logistic regression showed that together the 5 contrasts had greater tumor tissue classification accuracy than individually, but that the improvement in accuracy was not linear and decreased as more MR data was included. Lower grade gliomas and GBM could be predicted by the percentage of voxels classified as suspicious by the regression model, but not by any other class. These results may aid in clinical protocol development and optimization for neuro-oncologic imaging, especially in situations where overall scan time is limited.
Introduction
Intra-tumoral heterogeneity provides gliomas with a diverse set of cellular and genomic adaptation mechanisms in the presence of cytotoxic agents1, and is the primary cause of treatment failure and therapeutic resistance2-9. The accelerated development of multimodal and multiparametric imaging is rapidly increasing the volume of information available on tumor anatomy, function, and chemical makeup during treatment10, but the relative contributions of these image contrasts to classification of tumor tissues and compartments has not been quantitatively described. The purpose of this work was to evaluate the relative contributions of MR contrasts to tumor tissue classification.Methods
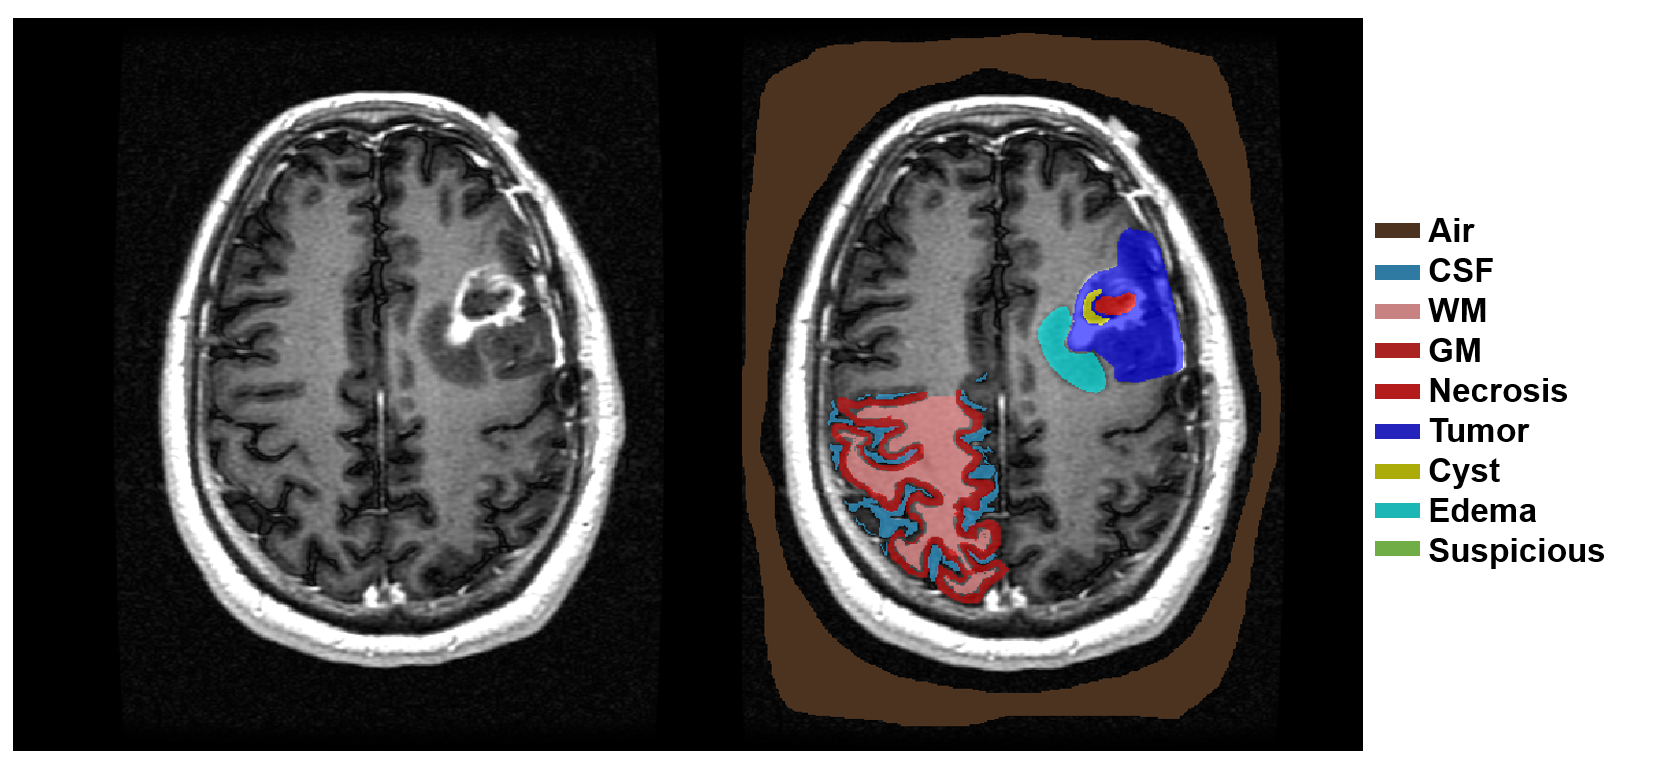
Seventeen (17) glioma patient datasets (WHO grade II-IV) containing T1, T1+gad, T2, FLAIR, and ADC were downloaded from The Cancer Imaging Archive and segmented by a neurosurgeon into five tumor tissue compartments: 1) suspicious, 2) edema, 3) active tumor, 4) cyst, 5) necrosis (Figure 1). Additionally, each image was segmented to include normal appearing regions of gray matter (GM), white matter (WM), cerebrospinal fluid (CSF), and air. After labeling, a total of 830,310 voxels were combined into a single feature vector composed of the 5 different image contrasts and a classification flag indicating which of the 9 possible classes the voxel represented. A one-way MANOVA was performed to compare the multivariate image intensity means across the 8 tissue types, holding WM as a reference variable. Individual ANOVA’s were performed for each of the 5 image contrasts across the 9 classes. Multinomial logistic regression was used to build a table of linear fit parameter estimates that quantified the predictive power of each of the image contrasts relative to WM for each of the tissue types. Once calculated, the parameter estimates were used for classification from the 5 image contrasts and to create nosologic maps of the tumor tissue compartments. Classification accuracy of the 5 contrasts were calculated individually and collectively. Finally, the ability of the nosologic maps to differentiate glioblastoma (GBM; WHO IV) from lower grade gliomas (LGG; WHO II-III) was investigated using a MANOVA operating on the total probability of each tumor tissue compartment. Individual ANOVA’s were then used to determine whether significant differences occurred in the total tumor tissue signal between the two patient groups for each tissue type.Results
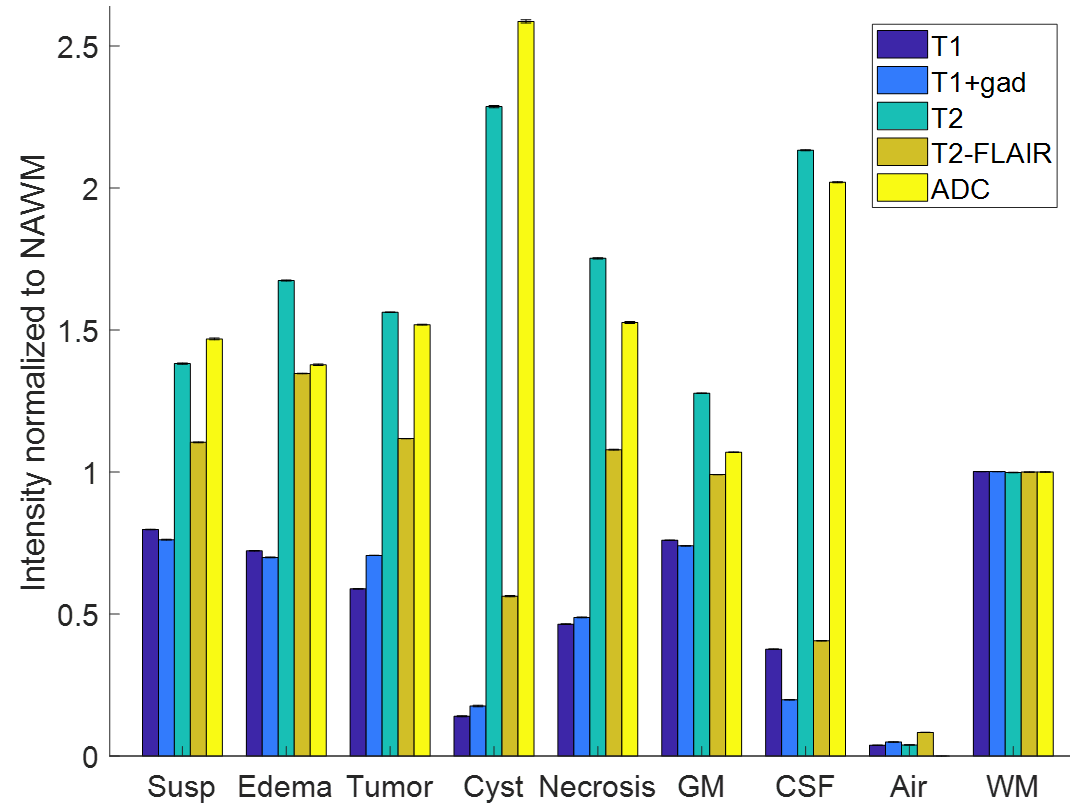
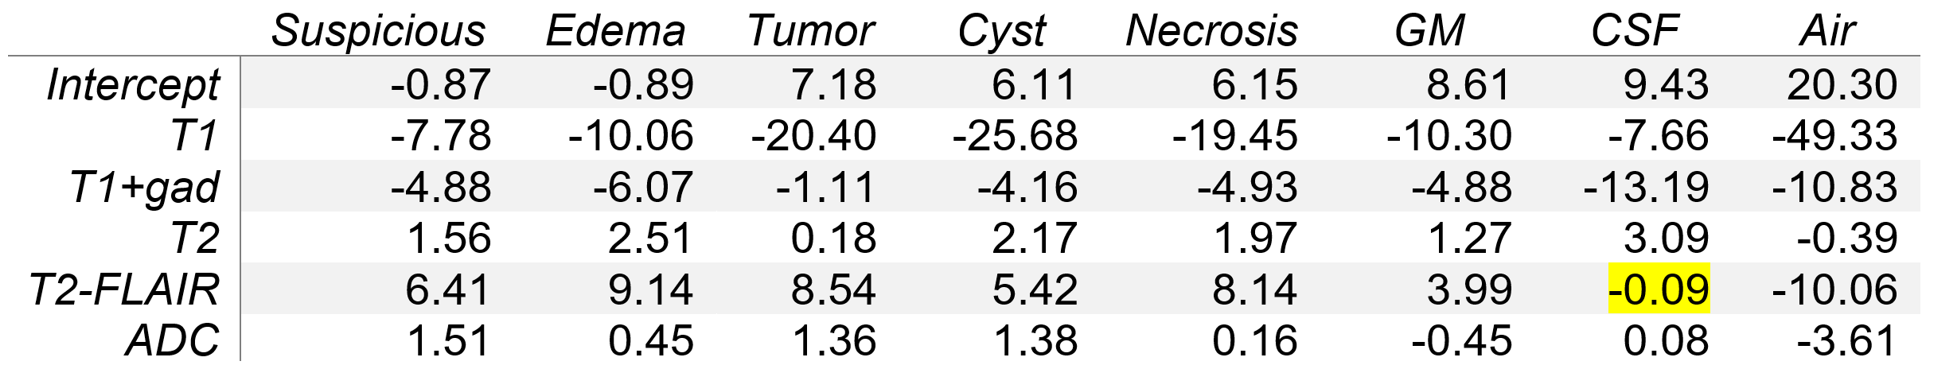
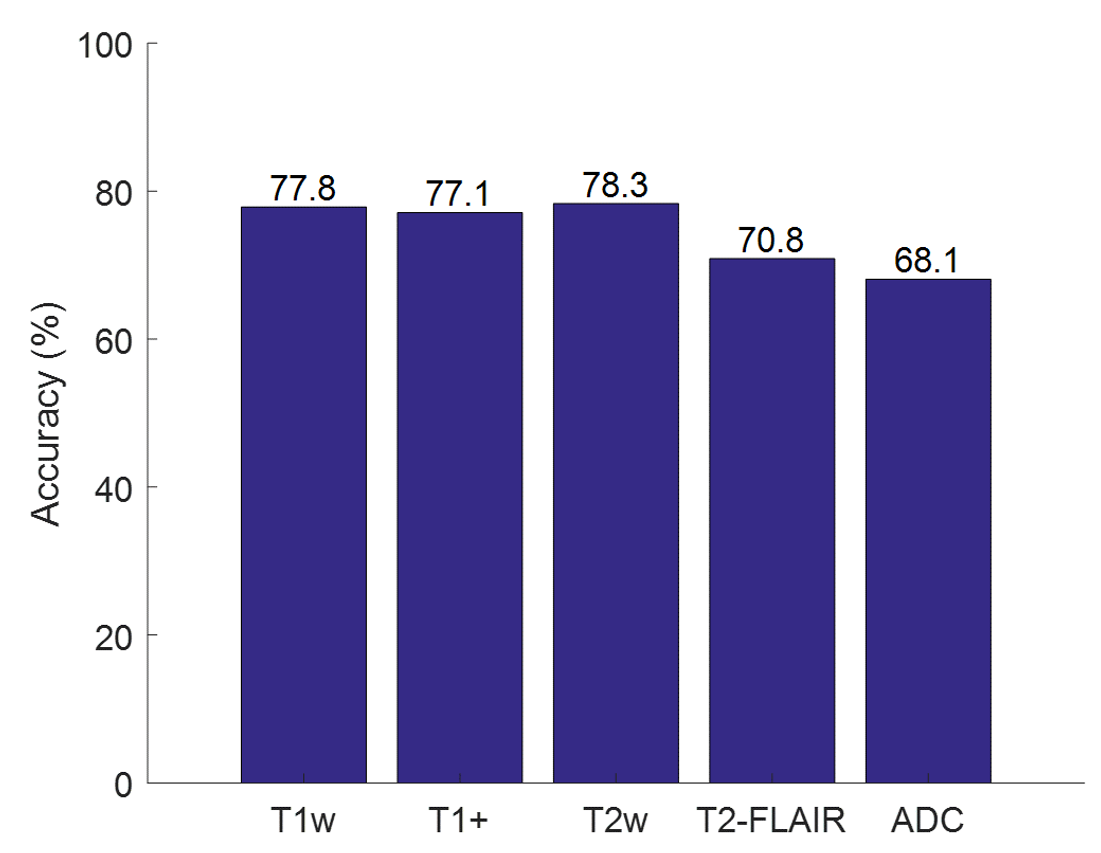
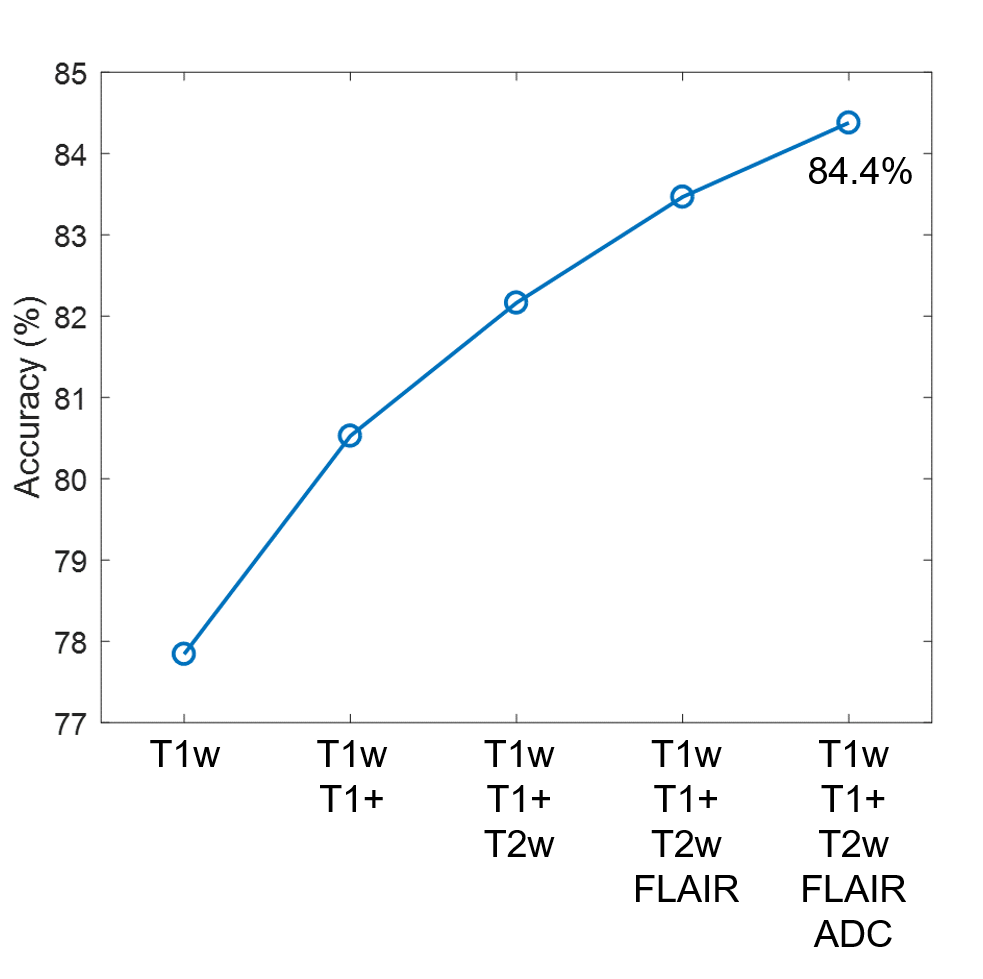
The mean and standard deviation (error bars) of the normalized image contrasts for each of the 9 classes is shown in Figure 2. The MANOVA applied to the raw feature vector returned p-values < .0001 for all 5 image contrasts, indicating that the multivariate means of the 5 contrasts were significantly different across the 8 classes (normalized to WM). Each of the 5 ANOVA tests returned a p-value < .0001, indicating that all 5 contrasts are independently different across the 8 classes. The multinomial logistic regression parameter estimates are shown in Table I. All parameter estimates except for the T2-FLAIR signal of CSF were found to be significant (p<.01). T2 images had the highest individual classification accuracy (78.1%) (Figure 3). Classification accuracy improved with each additional contrast, leading to an overall accuracy of 84.1% for all 5 contrasts (Figure 4). The MANOVA applied to the nosologic maps returned a p-value = .05, indicating that data associated with the LGG and GBM groups respectively did not come from the same distribution. However, when individual post-hoc ANOVA’s were applied to the nosologic maps, suspicious was the only tissue type which individually predicted overall diagnosis, with LGG demonstrating a greater percentage of suspicious tissue compared to GBM (p<.01).Discussion
Analyses of the raw label data showed that there are statistically significant differences at the group and individual levels in the 5 image contrasts across all tissue classes. The multinomial logistic regression showed that together the 5 contrasts had greater tumor tissue classification accuracy than individually, but that the improvement in accuracy was not linear and decreased as additional contrasts were included. LGG and GBM could be predicted by the percentage of voxels classified as suspicious by the regression model, but not by any other class. We hypothesize that the 5x17 data matrix was underpowered and that this contributed to the other 4 tumor compartments not being significant, warranting further studies.Conclusion
We have quantified the tumor tissue classification properties of 5 MR contrasts used in routine neuro-oncology, and shown that classification accuracy is non-linear with respect to increasing MR data. We have also demonstrated the ability to classify LGG from GBM using nosologic images estimated by machine learning techniques. These results may aid in clinical protocol development and optimization for neuro-oncologic imaging, especially in situations where overall scan time is limited.Acknowledgements
No acknowledgement found.References
- J. N. Sarkaria, G. J. Kitange, C. D. James, R. Plummer, H. Calvert, M. Weller and W. Wick, "Mechanisms of Chemoresistance in Malignant Glioma," Clin Cancer Res, vol. 14, no. 10, pp. 2900-8, 2009.
- S. Yachida, S. Jones and I. Bozic, "Distant metastasis occurs late during the genetic evolution of pancreatic cancer," Nature, vol. 467, pp. 1114-1117, 2010.
- M. Gerlinger, A. J. Rowan and S. Horswell, "Intratumor Heterogeneity and Branched Evolution Revealed by Multiregion Sequencing," N Engl J Med, vol. 366, pp. 883-892, 2012.
- Sottoriva, I. Spiteri and S. G. Piccirillo, "Intratumor heterogeneity in human glioblastoma reflects cancer evolutionary dynamics," Proc Natl Acad Sci USA, vol. 110, no. 10, pp. 4009-14, 2013.
- Swanton, "Intratumor heterogeneity: evolution through space and time," Cancer Res, vol. 72, no. 19, pp. 4875-82, 2012.
- L. V. Sequist, B. A. Waltman, D. Dias-Santagata, et al., "Genotypic and Histological Evolution of Lung Cancers Acquiring Resistance to EGFR Inhibitors," Science Translational Medicine, vol. 3, no. 75, p. 75ra26, 2011.
- R. A. Burrell, N. McGranahan, J. Bartek and C. Swanton, "The causes and consequences of genetic heterogeneity in cancer evolution," Nature, vol. 501, pp. 338-345, 2013.
- M. Jamal-Hanjani, S. A. Quezada, J. Larkin and C. Swanton, "Translational implications of tumor heterogeneity," Clin Cancer Res, vol. 21, no. 6, pp. 1258-66, 2015.
- Rehemtulla, "Overcoming Intratumor Heterogeneity of Polygenic Cancer Drug Resistance with Improved Biomarker Integration," Neoplasia, vol. 14, no. 12, pp. 1278-89, 2012.
- K. Uludag and A. Roebroeck,
"General overview on the merits of multimodal neuroimaging data
fusion," NeuroImage, vol. 102, no. 1, pp. 3-10, 2014.
Figures