2132
Quantifying tumour oxygenation using streamlined-qBOLD1Wellcome Centre for Integrative Neuroimaging, FMRIB, Nuffield Department of Clinical Neurosciences, University of Oxford, Oxford, United Kingdom, 2Department of Radiology & Nuclear Medicine, Erasmus MC, Rotterdam, Netherlands, 3Department of Neurosurgery, John Radcliffe Hospital, Oxford University Hospitals NHS Foundation Trust, Oxford, United Kingdom, 4Nuffield Department of Clinical Neurosciences, University of Oxford, Oxford, United Kingdom
Synopsis
Hypoxia and high metabolic demand are important identifying features of high-grade gliomas. Imaging methods capable of mapping tissue oxygenation therefore have the potential to provide non-invasive information about the metabolic environment of tumour tissue and may produce useful markers for stage grading and monitoring treatment efficacy. Here we demonstrate the use of streamlined-qBOLD for mapping tumour oxygenation.
Introduction
High-grade gliomas (WHO grade III-IV) are quick growing tumours that are highly vascularised, contain regions of hypoxia and are often accompanied by a regional breakdown in the blood-brain barrier (BBB)1,2. These malignant tumours have poor prognostic outcome and require aggressive treatment. In contrast, low-grade gliomas (WHO grade II) are slower to grow and can be monitored without treatment. However, these low-grade tumours require constant observation as most develop into higher grade tumours over time.
As such, hypoxia and high metabolic demand are important identifying features of high-grade gliomas3. Imaging methods capable of mapping tissue oxygenation therefore have the potential to provide non-invasive information about the metabolic environment of tumour tissue and may produce useful markers for stage grading and monitoring treatment efficacy4.
In this study, streamlined-qBOLD (sqBOLD)5, an MR-relaxometry based approach, is used to map the metabolic profile of both high- and low-grade gliomas. This technique is based on the qBOLD framework that models the transverse MR-signal decay in the presence of a vascular network6. The method maps oxygenation related parameters: reversible transverse relaxation rate (R2′), deoxygenated blood volume (DBV) and oxygen extraction fraction (OEF). Changes in these oxygenation parameters are quantified in tumour tissues and categorised using contrast-enhanced imaging that is clinically used to infer BBB breakdown and progression towards malignancy.
Methods
Recruitment and scanning
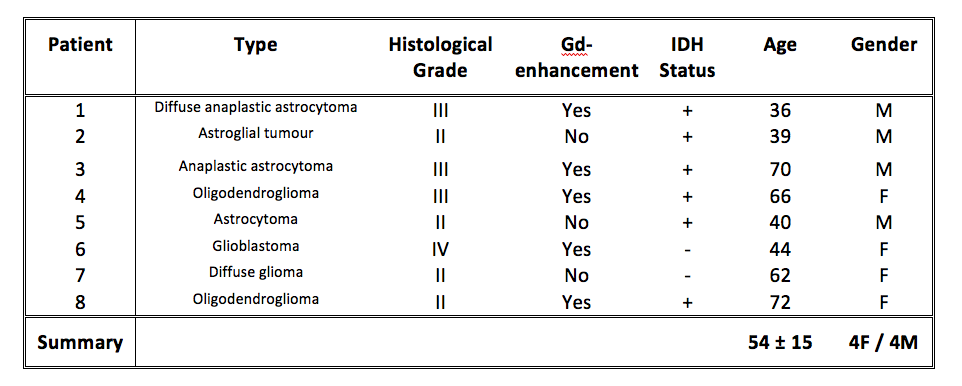
Eight patients with brain gliomas were recruited and scanned using a 3T Siemens Prisma. As part of a larger MRI research protocol, sqBOLD (FOV=220mm2, 96x96 matrix, nine 5mm slabs, 2.5mm gap, TR/TE=3s/80ms, BW=2004Hz/px, TIFLAIR=1210ms, ASE-sampling scheme τstart:Δτ:τfinish=-16:8:64ms, scan duration 4.5mins) and T1-weighted MPRAGE images were acquired in each patient. On a separate day, prior to research scanning, contrast-enhanced imaging (Gadolinium (Gd) contrast agent + T1-weighted imaging) was performed as part of a clinical protocol. Full details of Gd-enhancement and histological grading are provided in Table 1.
Image processing and analysis
Parameter maps of R2′, DBV and OEF were produced from the sqBOLD acquisition as previously detailed5. Tumour ROIs were manually delineated on the T1-weighted anatomical image by an independent observer. For comparison, individual contralateral cortical grey matter (contra-CGM) masks were produced by tissue segmenting7 the T1-weighted anatomical images, removing deep grey matter structures using MNI cortical masks8 and masking to include only the remaining CGM tissue from the unaffected hemisphere. The tumour and contra-CGM ROIs were registered into the native space of the sqBOLD oxygenation parameter maps, thresholded and binarised. Median values of R2′, DBV and OEF were extracted for each patient.
Results
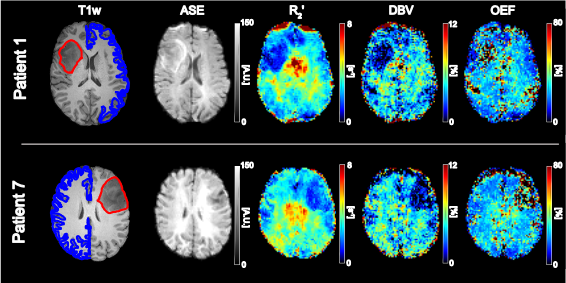
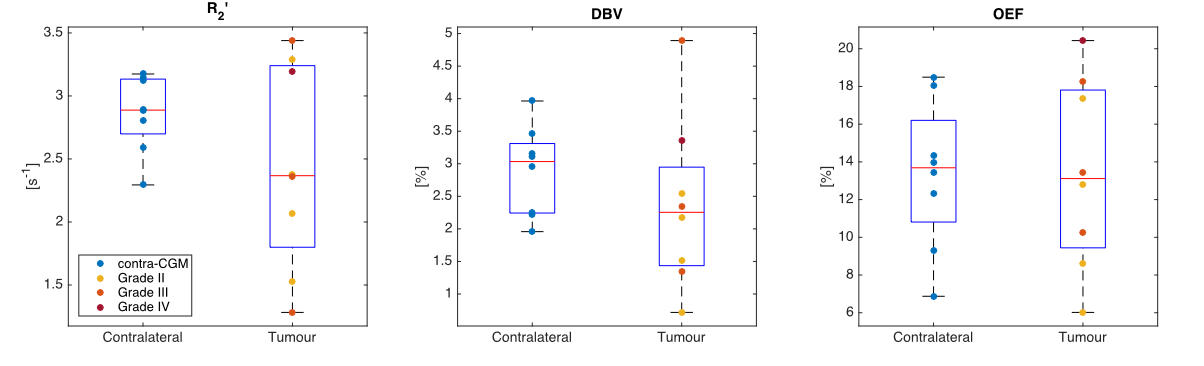
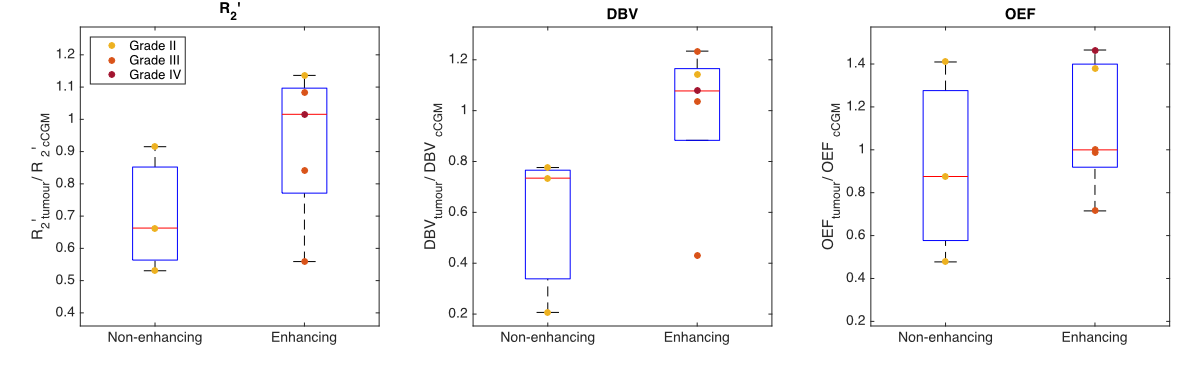
Figure 1 demonstrates contrast between tumour and unaffected tissue on the sqBOLD parameter maps in example patients. The heterogeneity of the scanned tumours (as detailed in Table 1) is reflected in Figure 2, both increases and decreases in tumour oxygenation parameters compared to contra-CGM are evident across the group. Figure 3 shows tumour oxygenation parameters normalised to contra-CGM within patient. Each normalised tumour value was categorised as either “Gd enhancing” (n=5) or “Gd non-enhancing” (n=3) on the contrast-enhanced T1-weighted scan. The median values of R2′, DBV and OEF across these groups were greater than the values in contra-CGM for Gd enhancing tumours and less than contra-CGM for Gd non-enhancing tumours. However, these differences were not significant compared to contra-CGM Gd enhancing tumours (R2′ (p=0.22), DBV (p=0.13) and OEF (p=0.51)).Discussion
sqBOLD derived parameter maps of R2' and DBV demonstrate contrast between tumour and healthy tissue (Figure 1). Regional analysis exhibits some evidence of sensitivity to tumour oxygenation in a small, heterogeneous cohort of patients (Figure 2 and 3). Most notably, a consistent elevation in all parameters is demonstrated in a GBM tumour (grade IV) and a Gd-enhancing tumour (grade II). An elevation in R2′, DBV and OEF suggests an increase in the amount of deoxyhaemoglobin present and therefore a decrease in tumour oxygenation. This description is consistent with the classic profile of GBM being a highly malignant tumour with large regions of hypoxia despite being highly vascularised. In the grade II tumour, the appearance of decreased oxygenation accompanied by Gd enhancement may suggest the beginnings of malignant transformation.
Due to the small sample size of this study, it has low power for detecting significant relationships present in the data. However, the data acquired so far are promising, warranting further investigation in a larger cohort.
Conclusion
Streamlined-qBOLD has demonstrated promising results for imaging tumour oxygenation in a small, heterogeneous cohort of glioma patients.Acknowledgements
The Wellcome Centre for Integrative Neuroimaging is supported by core funding from the Wellcome Trust (203139/Z/16/Z). This work was also funded by EPSRC grant EP/K025716/1.References
1 Vaupel, P. (1994). Blood-Flow and Metabolic Microenvironment of Brain-Tumors. Journal of Neuro-Oncology, 22(3), 261–267.
2 Upadhyay, N., & Waldman, A. D. (2011). Conventional MRI evaluation of gliomas. The British Journal of Radiology, 84(special_issue_2), S107–S111.
3 Mendichovszky, I., & Jackson, A. (2011). Imaging hypoxia in gliomas. The British Journal of Radiology, 84(special_issue_2), S145–S158.
4 Preibisch, C., Shi, K., Kluge, A., Lukas, M., Wiestler, B., Göttler, J., et al. (2017). Characterizing hypoxia in human glioma: A simultaneous multimodal MRI and PET study. NMR in Biomedicine, 21(2), e3775–13.
5 Stone, A. J., & Blockley, N. P. (2017). A streamlined acquisition for mapping baseline brain oxygenation using quantitative BOLD. NeuroImage, 147, 79–88.
6 Yablonskiy, D. A., & Haacke, E. M. (1994). Theory of NMR signal behavior in magnetically inhomogeneous tissues: the static dephasing regime. Magnetic Resonance in Medicine, 32(6), 749–763.
7 Zhang, Y. Y., Brady, M., & Smith, S. (2001). Segmentation of brain MR images through a hidden Markov random field model and the expectation-maximization algorithm. Ieee Transactions on Medical Imaging, 20(1), 45–57.
8 Mazziotta, J., Toga, A., Evans, A., FOX, P., Lancaster, J., Zilles, K., et al. (2001). A probabilistic atlas and reference system for the human brain: International Consortium for Brain Mapping (ICBM). Philosophical Transactions of the Royal Society of London. Series B, Biological Sciences, 356(1412), 1293–1322.
Figures