2130
An optimized DCE-technique detects weak contrast agent accumulation undetectable on post-contrast T2*-weighted acquisitions: application to a model of neuroinflammation1Aix-Marseille Université, CRMBM UMR CNRS 7339, Marseille, France
Synopsis
No dynamic contrast-enhanced (DCE) study has been published so far in Experimental Allergic Encephalomyelitis (EAE), although DCE-MRI is used in human Multiple Sclerosis. This study reports a DCE protocol optimized for mouse brain imaging of subtle and delayed contrast agent accumulation and applies it to the study of EAE with moderate neurological signs. Two-fold signal increase with respect to the vascular volume fraction can be detected while even moderately enhancing lesions remain visually undetectable on pre and post-contrast T2w and T2*w acquisitions. Ventricles, midbrain and ventral olfactory bulb are first to be affected in moderate EAE.
INTRODUCTION
Although gadolinium enhanced T1-weighted imaging reflecting vascular leakage has been used since 1987 1, no dynamic contrast-enhanced (DCE) study has been published so far in experimental allergic encephalomyelitis (EAE), a preclinical model of Multiple Sclerosis. DCE-MRI is increasingly used to estimate vascular permeability in patients, but optimized acquisition and analysis protocols are required for detection of subtle vascular leakage 2,3. Prolonged DCE acquisitions are recommended and further benefit from high and constant vascular contrast agent (CA) concentration. In mice, the intravenously injectable volume is small and elimination is rapid. This study reports a DCE protocol 5 suited for mouse brain imaging of subtle and delayed CA accumulation and applies it to the study of EAE with moderate neurological signs.
METHODS
C57Bl6 mice induced for EAE with MOG33-55 peptide and developing hindlimb paresis (score 1.5-2.5 of 6) (n = 7), sham mice treated with immunostimulating complete Freund adjuvant without injection of the MOG peptide (n = 6) and age-matched controls (n = 3) underwent MRI three weeks after EAE induction. Images were acquired on a PharmaScan 70/16 US equipped with a 72 mm volume resonator for emission and a 2x2 elements phased array surface cryoprobe. DCE-MRI was performed with a 3D inversion recovery prepared fast gradient echo sequence (TR/TI/TRecho/TE/α = 750/295/5/1.5 ms/10°, 160 repetitions, matrix 64x64x33, resolution 230x230x500 mm3). These parameters suppress the signal from brain parenchyma and blood to maximize the contrast to noise ratio during gadolinium accumulation. After 5 min baseline, 10 mmol/kg Gd-DOTA was administered via an intraperitoneal line in the magnet and acquisitions were continued for 60 minutes. Additional mice (n = 2) underwent the DCE-MRI protocol without Gd-DOTA injection to evaluate signal stability in three rostral and caudal brain regions. T2-weighted (T2w) (TR/TE/duration=3000ms/20ms/10 min) and T2*w (TR/TE/duration=1000ms/8.5ms/3.5 min) high resolution (75x75x250 mm3) images were acquired before and T2*w acquisitions were repeated 1h after CA administration.RESULTS
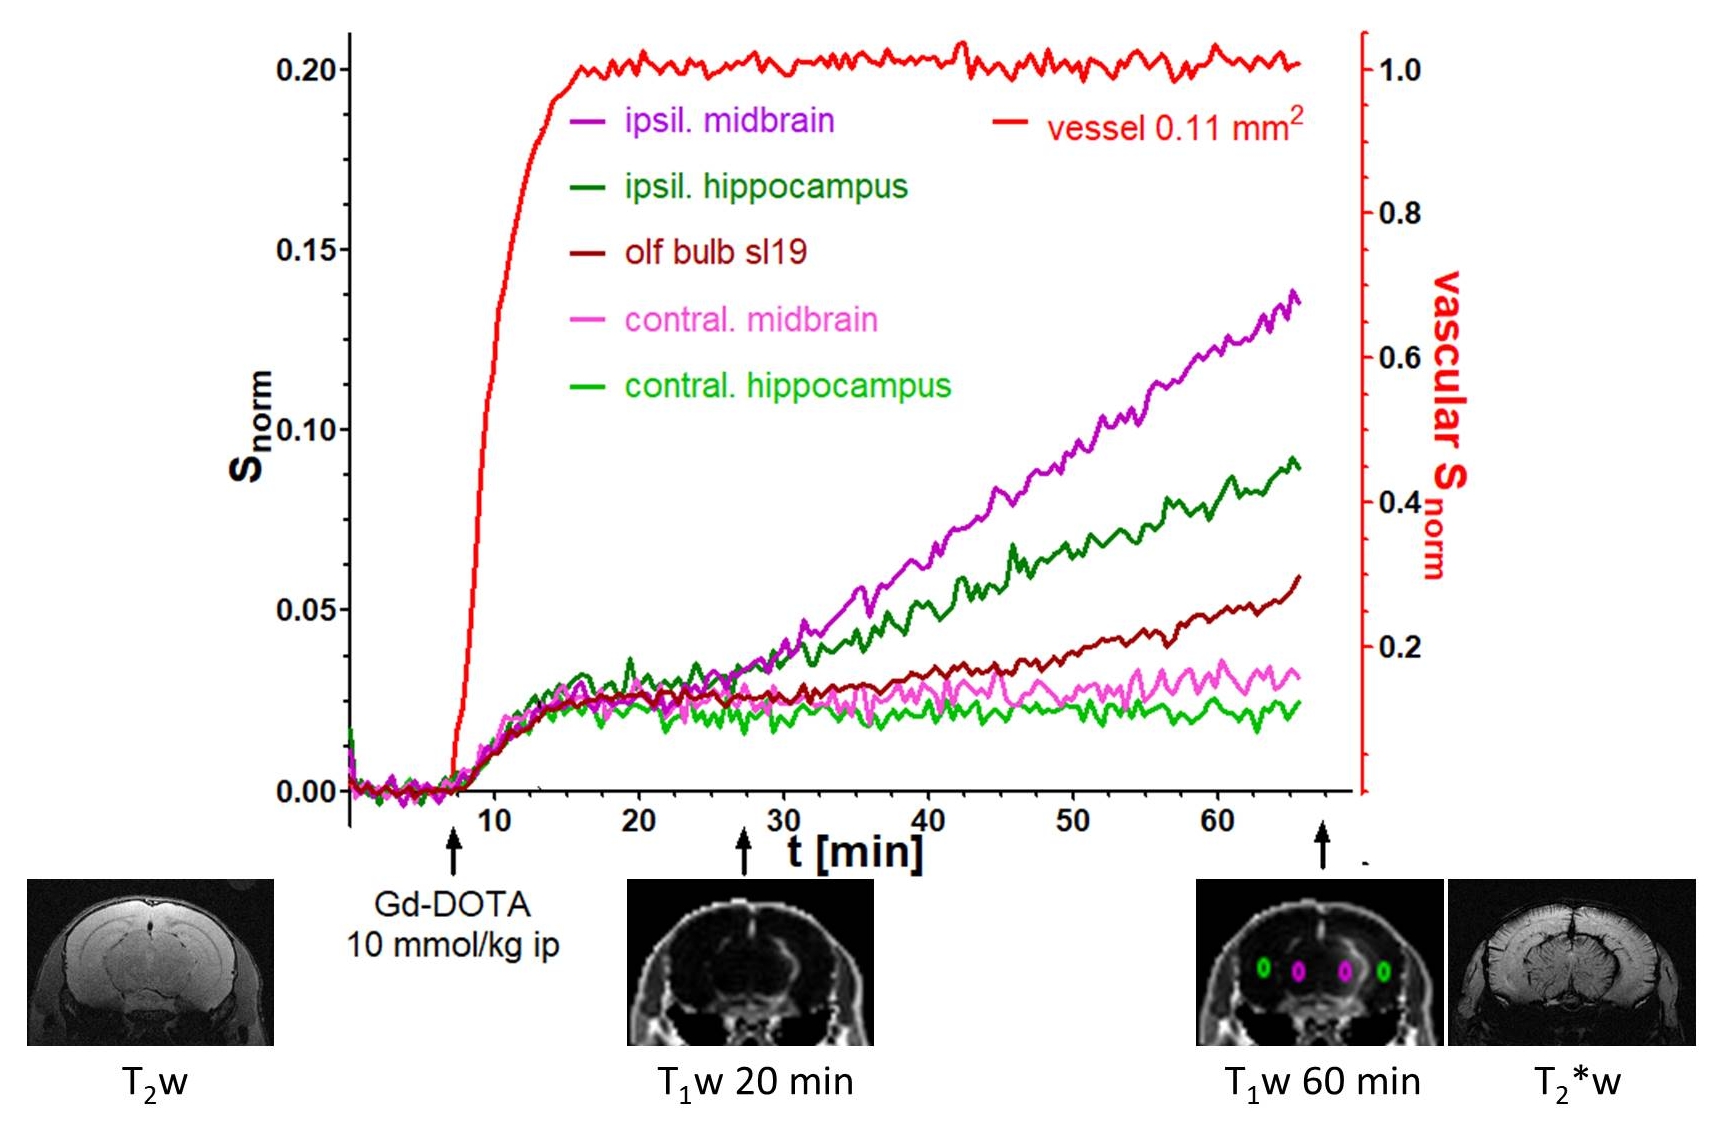
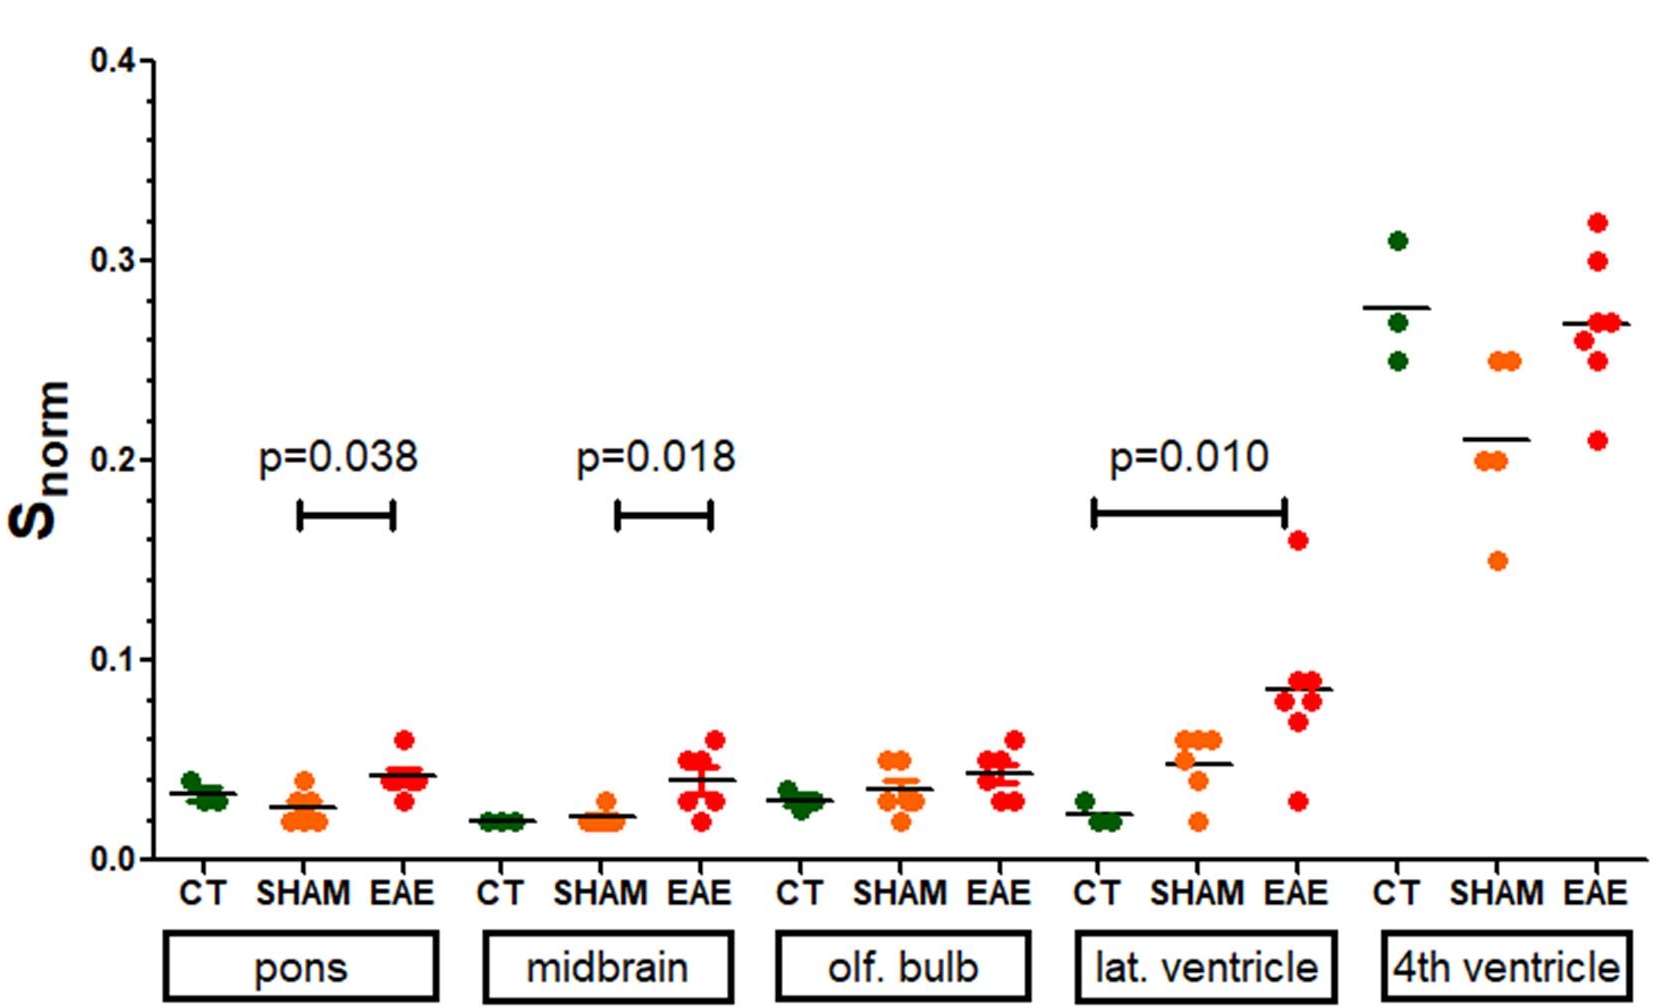
Signal drift was below the temporal standard deviation of the signal over 1h. The vascular signal reached its maximum within 5 minutes after intraperitoneal Gd-DOTA injection and remained constant for 5 - 10 min in 9 mice, for 10 - 20 min in 3 mice, and for >20 min in 4 mice. Signal increase in parenchyma is the result of a combination of intravascular enhancement (blood volume fraction of 0.01 to 0.02 in mouse brain) and interstitial enhancement with distinguishable kinetics (Figure 1). Control mice did not show any signal increase due to gadolinium accumulation in brain parenchyma, nor in ventricles except in the lower part of the 4th ventricle. EAE mice with hindlimb paresis (scores 1.5 – 2.5) showed weak diffuse gadolinium accumulation in pons (p=0.038), midbrain (p=0.018) and also in olfactory bulbs (not significant) (Figure 2) as well as increased extravasation in the lateral ventricles (p=0.01) compared to controls (Figure 2). Three EAE mice had isolated lesions with more pronounced vascular leakage localized in the olfactory bulb, cerebellum and midbrain + hippocampus around the ambient cistern (Figure 1). However these lesions could not be distinguished on pre-contrast T2w and T2*w acquisitions and CA accumulation was still too weak to be seen on post-contrast T2*w acquisitions (Figure 1).DISCUSSION
In contrast to a previous report where CA accumulation was observed concomitant with severe neurological signs (paralysis, score 3 - 3.5) 4, this study showed that more subtle accumulation can be detected in EAE mice with moderate clinical signs. Ventricles, midbrain and ventral olfactory bulb are first to be affected, confirming the existence of specific pathways for cerebrospinal fluid flow 5. This DCE-technique is able to detect weak (40% change above blood volume fraction), diffuse and delayed (>20 min post CA administration) accumulation, as occurs in beginning neuroinflammation in EAE, and shows its benefit over conventional T2w and T2*w imaging in EAE at a moderate disease stage. Limitations of this DCE-technique are the currently low spatial resolution, the difficulty to correct for motion during the DCE-acquisition due to low signal in brain parenchyma, and the signal saturation in the vascular compartment, which complicates the quantitative determination of the vascular input function. Also, although vascular arrival of Gd-DOTA in the brain is highly reproducible, vascular blood half-life varies between mice.CONCLUSION
This sensitive and minimally invasive DCE-MRI protocol facilitates longitudinal studies and allows the detection of lesions with low and/or delayed gadolinium uptake kinetics that remain visually undetectable on pre and post-contrast T2w and T2*w acquisitions. Analysis of gadolinium uptake kinetics may aid in understanding the vascular changes that occur during disease progression and therapy.Acknowledgements
No acknowledgement found.References
1. O'Brien JT1, Noseworthy JH, Gilbert JJ, Karlik SJ. NMR changes in experimental allergic encephalomyelitis: NMR changes precede clinical and pathological events. Magn Reson Med. 1987 Aug;5(2):109-17
2. Cramer SP1, Larsson HB2. Accurate determination of blood-brain barrier permeability using dynamic contrast-enhanced T1-weighted MRI: a simulation and in vivo study on healthy subjects and multiple sclerosis patients. J Cereb Blood Flow Metab. 2014 Oct;34(10):1655-65
3. Ingrisch M1, Sourbron S, Herberich S, Schneider MJ, Kümpfel T, Hohlfeld R, Reiser MF, Ertl-Wagner B. Dynamic Contrast-Enhanced Magnetic Resonance Imaging Suggests Normal Perfusion in Normal-Appearing White Matter in Multiple Sclerosis. Invest Radiol. 2017 Mar;52(3):135-141
4. Perles-Barbacaru AT, Tracz J, Pecchi E, Bernard M, Viola A (Oct 2015). Brain Gd-DOTA mapping in a mouse model of chronic EAE induced with the MOG33-55 peptide. 32nd Annual Scientific Meeting of the European Society for Magnetic Resonance in Medicine and Biology, Volume 28, Issue 1 Supplement, October 2015, Book of Abstracts ESMRMB 2015
5. Schmitt C, Strazielle N, Ghersi-Egea JF: Brain leukocyte infiltration initiated by peripheral inflammation or experimental autoimmune encephalomyelitis occurs through pathways connected to the CSF-filled compartments of the forebrain and midbrain. J Neuroinflammation 2012, 9:187.
Figures