2129
In-Vivo Analysis of the Superficial White Matter in the Macaque Brain Using High-resolution Diffusion MRI: preliminary results1CNRS, Bron, France, 2CERMEP, Bron, France, 3Siemens-Healthineers, Saint-Denis, France, 4Université de Sherbrooke, Sherbrooke, QC, Canada
Synopsis
This study was focused on the U-fibers located on the Superficial White Matter (SWM) of the Rhesus macaque brain.
A diffusion MRI (dMRI) pulse-sequence with a 3D multi-shot-EPI module was used to achieve a 0.5 mm isotropic dMRI data in 4 macaques.
The organization of white matter in the region of arcuate sulcus (AS) was analyzed using diffusion tensor and fiber orientation distribution data, the U-fiber over all the AS was tracked and its water diffusion metrics were quantitatively assessed.
The results, obtained using high-resolution dMRI, pave the way for quantitative analyses of SWM for clinical and neuroscientific applications.
Introduction
The Superficial White Matter (SWM) is located between the Deep White Matter (DWM) and the Cortex Gray Matter (CGM). SWM is mainly composed of short association fibers, also called U-fibers, which connect two adjacent gyri1. The number and role of these anatomical structures are not perfectly known. Recent studies have shown the interest and the challenge for reconstructing them2,3. The main objective of this work is to analyze the connectivity and microstructure of U-fibers thanks to high-resolution in-vivo diffusion Magnetic Resonance Imaging (dMRI) .Material and Methods
The dMRI acquisition was performed on 4 anesthetized Rhesus macaques head restrained thanks to an MRI-compatible stereotaxic frame. The anesthesia was induced used an intramuscular injection of ketamine (10mg\kg) and maintained with 1.5% isoflurane gaz.
A dMRI pulse sequence with a 3D multi-shot-EPI module for the Fourier space sampling was implemented on a 3T MRI scanner (Siemens Prisma ) in order to increase the acquisition sensitivity as well as the spatial-resolution of diffusion-weighted(DW)-images4. The dMRI acquisition parameters were: TR=750 ms, TE=72 ms, field of view =125×105×56 mm3 and matrix size =248×210×112 voxels leading to an isotropic spatial-resolution of 0.5 mm. 30 directions of diffusion were encoded with a b-value of 1000 s/mm2 and with 2 non-DW-images (b=0) per scan. The final acquisition time was 130 minutes.
Images were reconstructed with the Gadgetron5 and were corrected for susceptibility and eddy current artifacts with the Topup and Eddy tools6,7. Tensor derived metrics (Fractional anisotropy (FA), mean diffusivity (MD), radial diffusivity (RD), eigenvalues ᴧ1, ᴧ2 and ᴧ3, and linearity coefficient (CL)), and tractography were computed using MRtrix38,9. Tractography was generated with a spherical harmonic order of 6, a step size of 0.25 mm, an angle threshold of 40 and a fiber orientation distribution (FOD) cutoff of 0.2. Regions of interest (ROI) were manually drawn on the SWM surrounding and following the Arcuate Sulcus (AS).
Results
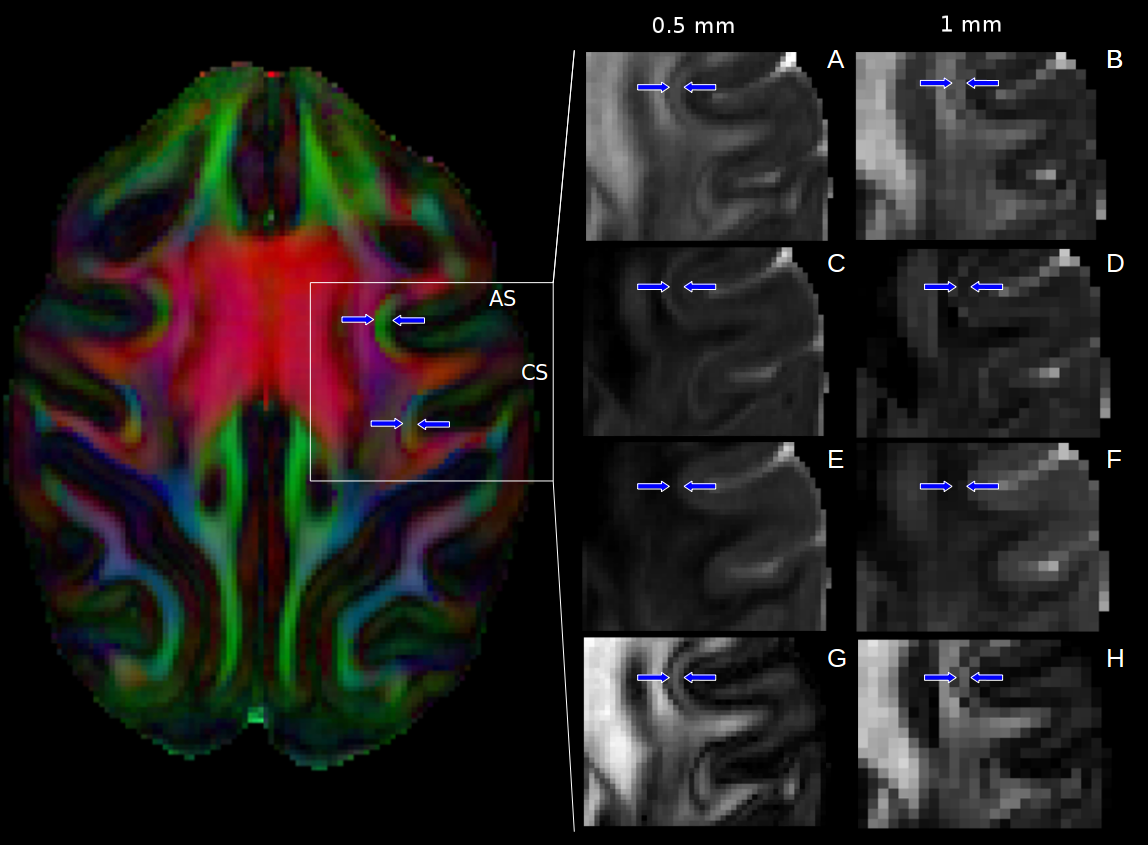
The high-resolution dMRI data achieved in this study allowed the detection of the U-fibers in the macaque brain similarly to what was done ex-vivo by Reveley et al.3. Fig.1 focuses on the AS and Central Sulcus (CS). U-fibers appear with high values on FA, ᴧ1 and CL. The resolution of 0.5 mm enables to visualize U-fibers with a thickness of 2-3 voxels surrounded by two one-voxel-thick interfaces (DWM/SWM and SWM/CGM). These interfaces could correspond to partial volume effects introduced by the change of axon orientations at the boundaries of the U-fibers.
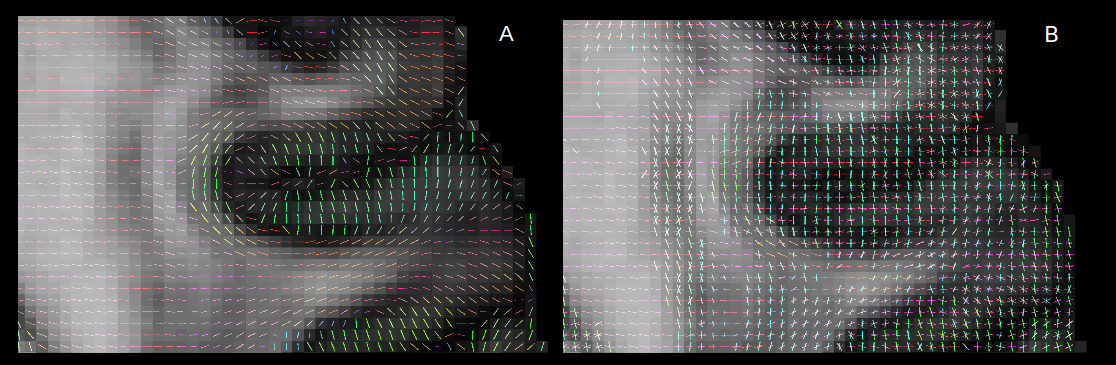
Fig.2 illustrates the orientation of SWM and DWM fibers around AS. In the fundus of the AS, the main diffusion tensor orientation of SWM is perpendicular to the cortical thickness (Fig.2A). The peaks extracted from the Fiber Orientation Distribution (FOD) (fig.2B) indicate that some streamlines going from the DWM travel through U-fibers to enter CGM. This peak component was not detected by Reveley3 in ex-vivo data. On the fundus of the gyri, the penetration of fibers originating from DWM and from U-fibers into CGM is clearly detectable using both the diffusion tensor orientation and FOD peaks.
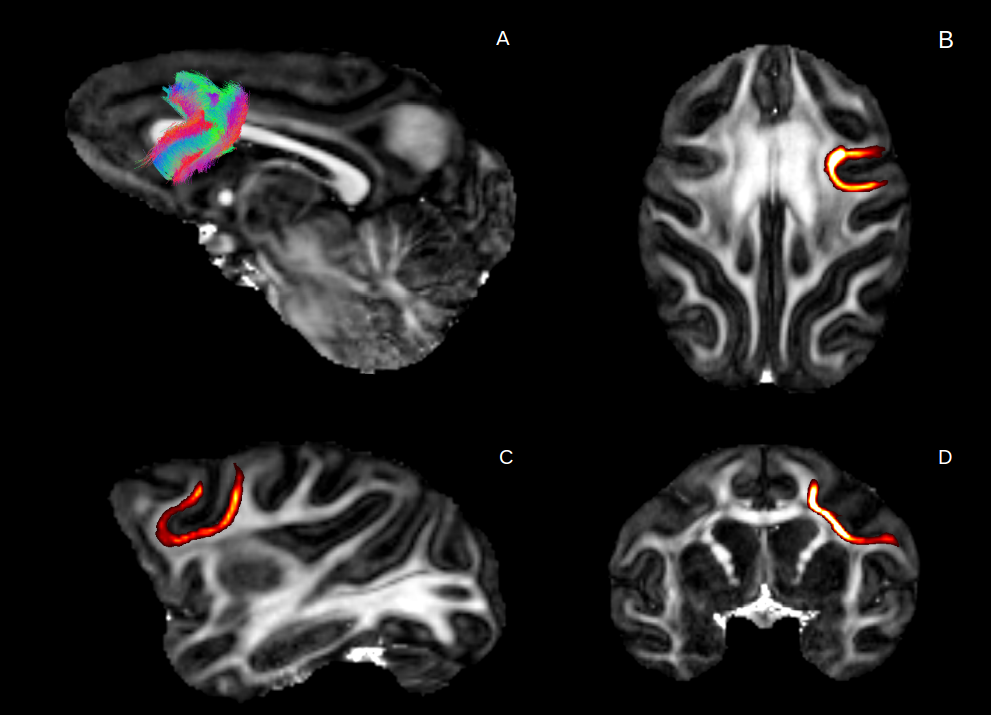
The tractogram of U-fibers over all the AS, connecting both the superior frontal gyri with the middle frontal gyri and the inferior frontal gyri with the precentral gyri, is shown on fig.3. The obtained bundles were used to perform a tractography-based segmentation of U-fiber structures and to define the ROIs used for the quantitative characterization of U-fibers. Table 1 summarizes the values of diffusion metrics assessed in AS U-fibers for 4 macaques. The obtained values indicate a high level of organization of SWM fibers.
Discussion
It is known that the SWM structure impairs tractography results because U-fibers prevent streamlines to penetrate from the DWM into the CGM. High-resolution in-vivo dMRI methods could open the door to overcome this limitation. Multi-shells acquisition is expected to further enhance the quality of the FOD data and better resolve the fibers crossing in SWM.
This study demonstrates in-vivo characterization of water diffusivity metrics in one individual U-fiber of the macaque brain. This methodological achievement is highly relevant to clinical work when transferred to humans as it could help define non-invasive biomarkers of the microstructure of U-fibers. Such biomarkers could be very useful to monitor microstructural changes of U-fibers induced by pharmacological or physiological or pathological conditions.
Conclusion
This study demonstrated that, in comparison with the spatial-resolution of 1mm commonly applied for macaque brain, high-resolution dMRI allows revealing and characterizing U-fibers, which could overcome what has been thought of as a strong limitation of tractography. The obtained results paves the way for quantitative analyses of SWM for clinical and neuroscientific applications.Acknowledgements
No acknowledgement found.References
1. Schmahmann, Jeremy, and Deepak Pandya. Fiber pathways of the brain. OUP USA, 2009.
2. Oishi, Kenichi, et al. Superficially located white matter structures commonly seen in the human and the macaque brain with diffusion tensor imaging. Brain connectivity. 2011;1(1): 37-47.
3. Reveley, Colin, et al. Superficial white matter fiber systems impede detection of long-range cortical connections in diffusion MR tractography. Proceedings of the National Academy of Sciences. 2015;112(21):E2820-E2828.
4. S. Tounekti, T. Troalen, Y. Bihan-Poudec, J. Clery, M. Froesel , F. Lamberton, S. Ben Hamed , B. Hiba. In-Vivo Very High-Resolution Diffusion MRI of Macaque Monkey Brain at 3T. European Society for Magnetic Resonance in Medicine and Biology. 2017.
5. Hansen, Michael Schacht, and Thomas Sangild Sørensen. Gadgetron: an open source framework for medical image reconstruction. Magnetic resonance in medicine.2013;69(6) : 1768-1776.
6. Smith, Stephen M., et al. Advances in functional and structural MR image analysis and implementation as FSL.Neuroimage.2004;23:S208-S219
7. Andersson, Jesper LR, Stefan Skare, and John Ashburner. How to correct susceptibility distortions in spin-echo echo-planar images: application to diffusion tensor imaging. Neuroimage. 2003;20(2):870-888.
8. Tournier, J-Donald, et al. Direct estimation of the fiber orientation density function from diffusion-weighted MRI data using spherical deconvolution. NeuroImage. 2004;23(3):1176-1185.
9. Tournier, J., Fernando Calamante, and Alan Connelly. "MRtrix: diffusion tractography in crossing fiber regions. International Journal of Imaging Systems and Technology. 2012;22(1): 53-66.
Figures