2126
Dynamic Structural-Functional Relationship between Left and Right Somatosensory Cortex in Rats across the Lifespan1Biomedical MR Imaging and Spectroscopy Group, Center for Image Sciences, University Medical Center Utrecht / Utrecht University, Utrecht, Netherlands, 2Department of Pediatric Neurology, Brain Center Rudolf Magnus, University Medical Center Utrecht / Utrecht University, Utrecht, Netherlands
Synopsis
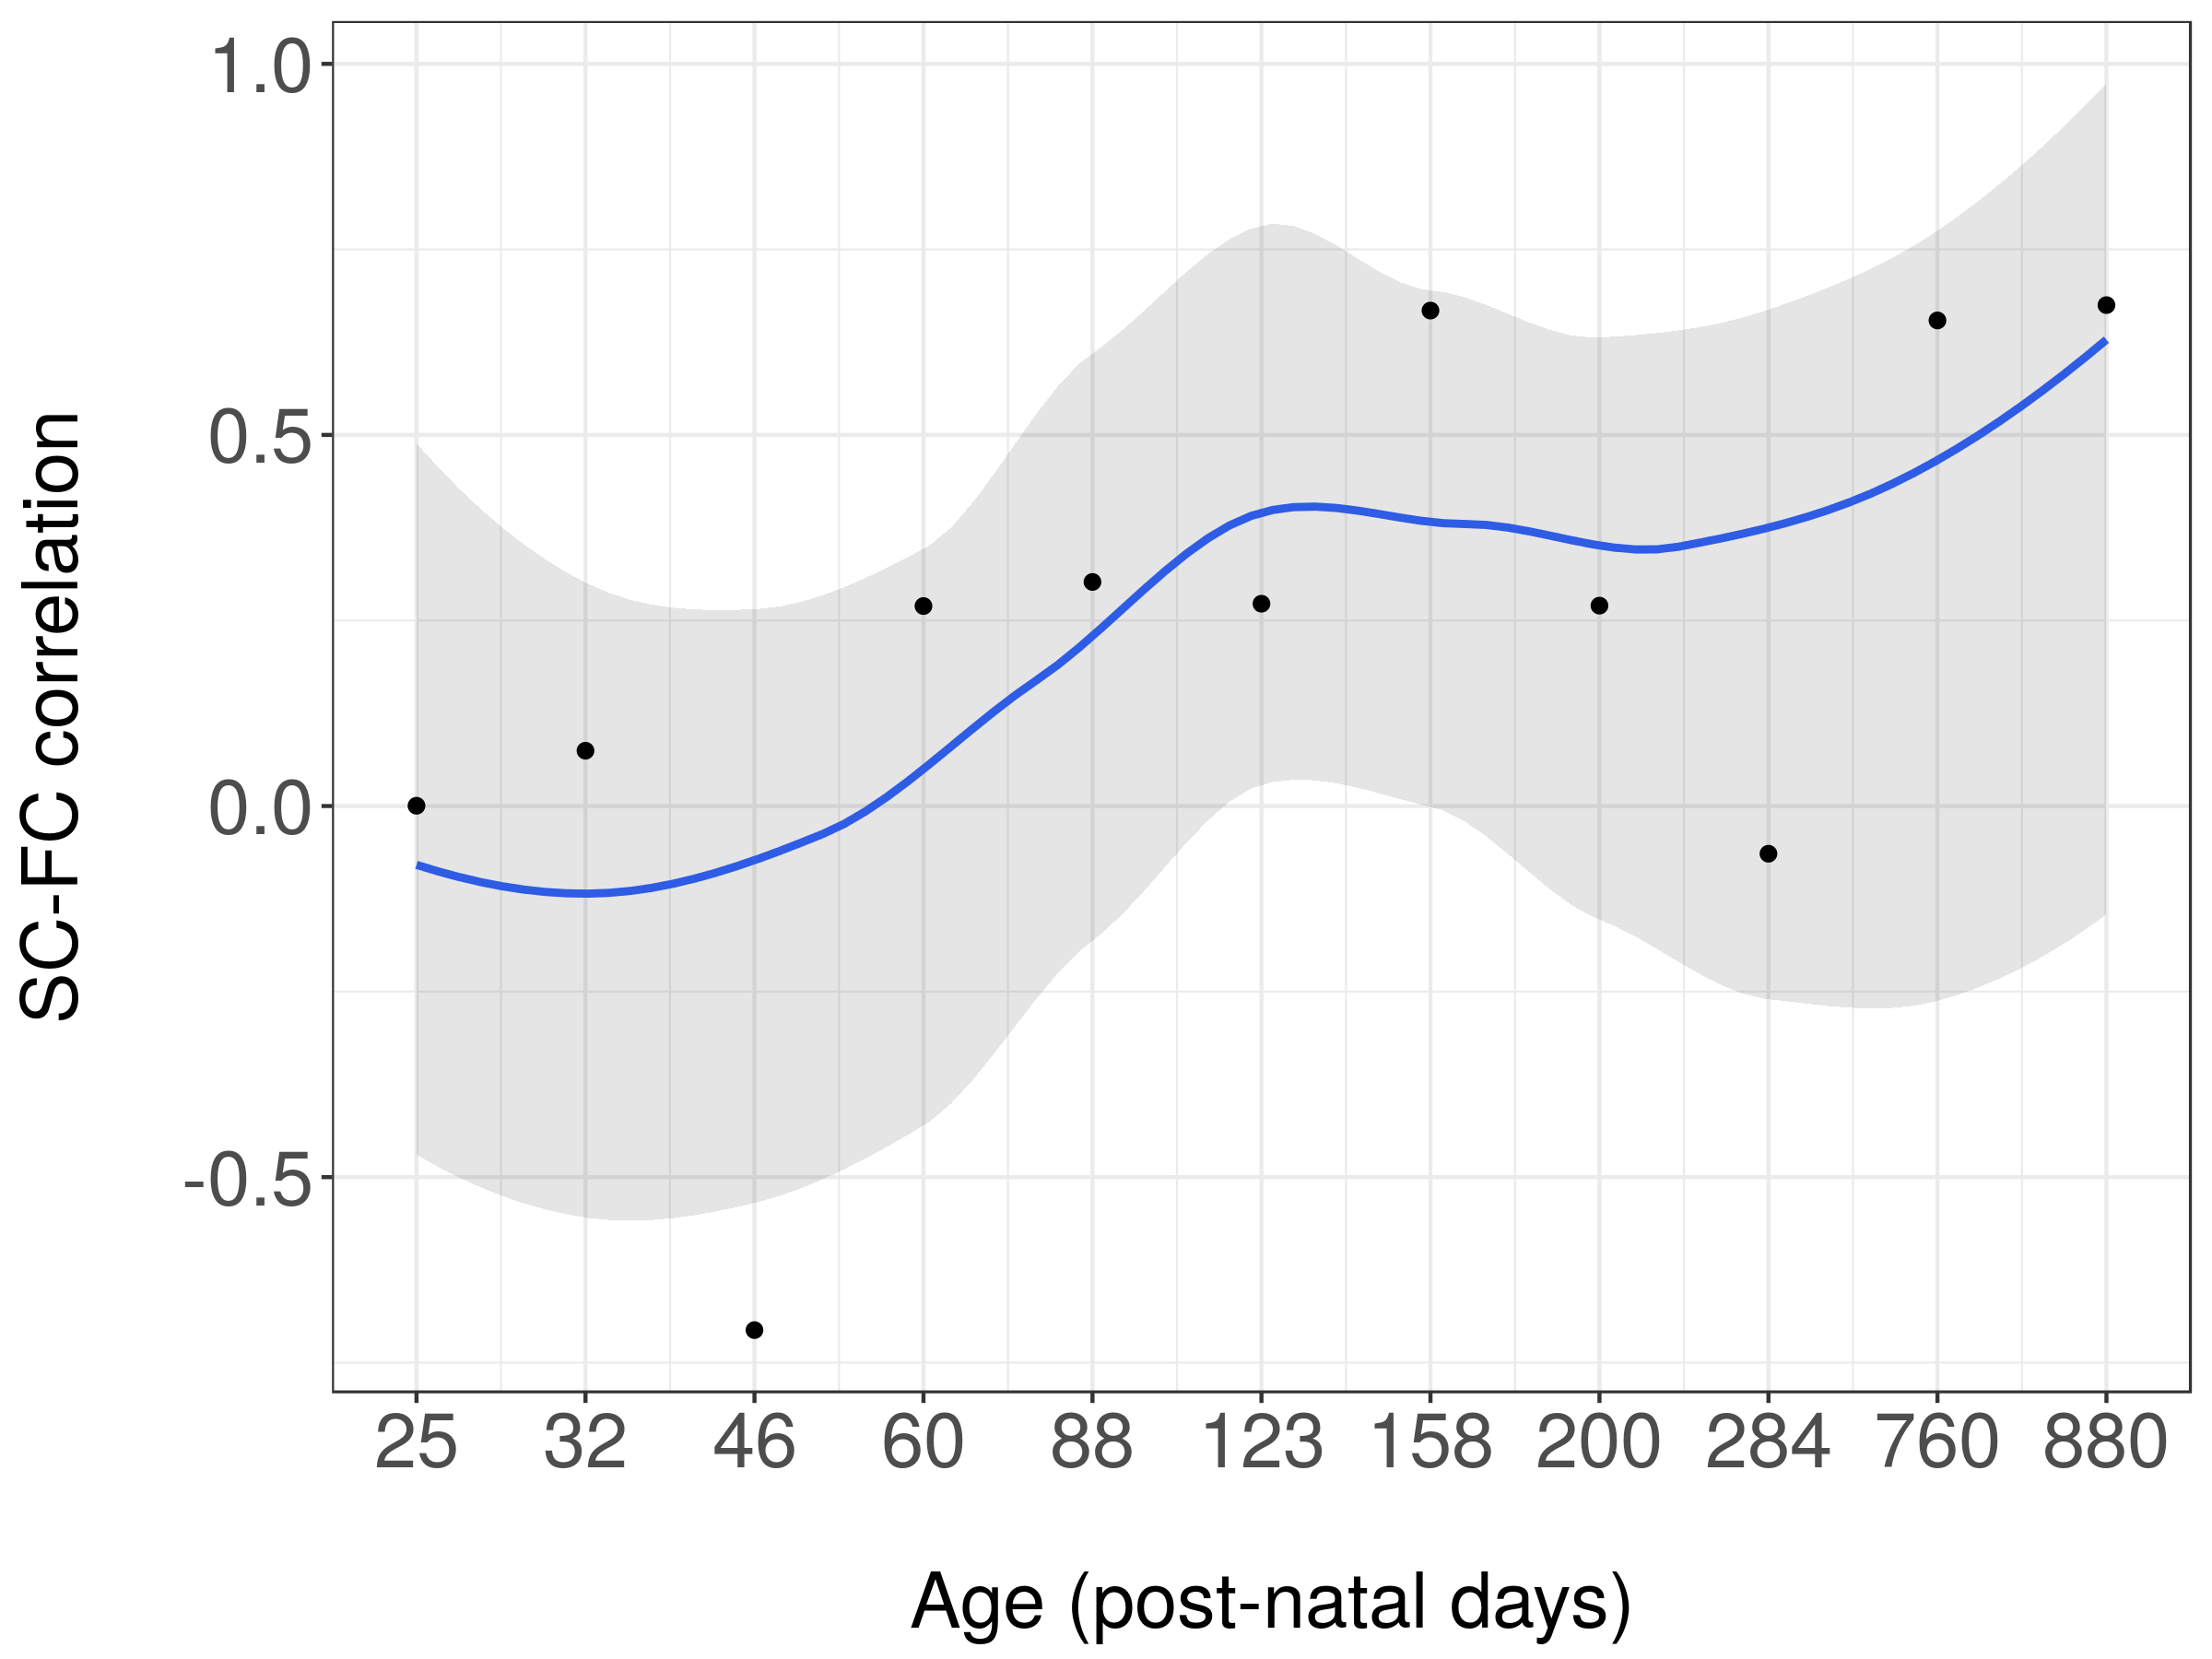
The relationship between structural and functional brain connectivity across the mammalian lifespan is largely unknown. To elucidate the temporal characteristics of this relationship we longitudinally acquired high-field resting-state fMRI and diffusion-MRI in rats, from early infancy to old age. We specifically examined the interhemispheric connectivity between homologous primary somatosensory cortices, a major part of the sensorimotor system. The structure-function correlation increased from about 0 during infancy to 0.4 around adulthood, followed by a further gradual increase towards old age. This reflects dynamic patterns of lifelong brain remodeling, which may underlie variations in brain disease etiology during development and ageing.
Introduction
The brain is a complex system consisting of many structural and functional network connections that alter during development and aging. Functional and behavioural phenotypes in health and disease are associated with changes in structural (SC) and functional connectivity (FC)1–4, and characterization thereof may improve our understanding of the etiology and consequences of brain disorders in humans and animal models. However, there is limited knowledge of possible temporal patterns of interaction between SC and FC across the lifespan. Therefore we performed a longitudinal study in rats from juvenile until old age to characterize the temporal relationship between structure and function for a well-defined connection within the sensorimotor network.Methods
Serial MRI measurements were conducted on a 4.7T horizontal bore Varian MR System. Wistar rats (N=20) were scanned at post-natal days (P)25, 32, 46, 88, 123, 158, 200, 284, 760 and 880. MRI was performed under 1.0-1.5% isoflurane anesthesia in a 2/1 O2/air mixture. During MRI, body temperature was maintained at 37.0 ± 0.5 °C, and blood oxygen saturation, heart rate and expired CO2 were continuously monitored. Anatomical images were acquired with a 3D gradient-echo sequence (TR/TE=6/2.5 ms; 40° flip angle; 100x80x160 matrix; FOV=25x20x40 mm3). Resting-state fMRI (rs-fMRI) was performed using a T2*-weighted 1-shot 3D gradient-echo EPI sequence (TR/TE=32/19 ms; 12° flip angle; 48x32x64 matrix; 0.5x0.5x0.5 mm3 voxels; 600 BOLD images). Diffusion-weighted MRI was performed with a 5-shot EPI-2D sequence (TR/TE=1750/28.52 ms, 19 slices; 4 b0 images, 4 b-values (650, 1285, 1919, 2518 s/mm2; δ/Δ = 5/10 ms), 30 directions per b-value, three averages; 128x128x19 matrix; 0.195x0.195x1.0 mm3 voxels). Brain extraction, data quality checking and registration to a 3D model of the Paxinos & Watson rat brain atlas were all performed in FSL.
Functional connectivity: rs-fMRI pre-processing included motion correction, subsequent regression of motion parameters and band-pass filtering (0.01 < f < 0.1 Hz). The FC strength between the left and right forelimb regions of S1 (S1FL) was calculated as the Fisher’s Z-transformed correlation coefficient.
Structural connectivity: motion and eddy current correction of diffusion-weighted images and tractograms were performed in MRtrix3. Diffusion parameters, fractional anisotropy (FA), mean diffusivity (MD), axial diffusivity (AD) and radial diffusivity (RD) were determined with DTIFIT in FSL. Conventional diffusion tensor-based tractography was applied to generate 250.000 streamlines at whole-brain level (step-size: 25 µm, angle threshold: 45°, FA threshold: 0.25). White matter tracts connecting the left and right S1FL were extracted based on atlas coordinates and a white matter mask. Subsequently, along-tract analysis was performed to calculate the average FA, MD, AD and RD across streamlines. SIFT2 was used to determine the structural connectivity strength.
Results
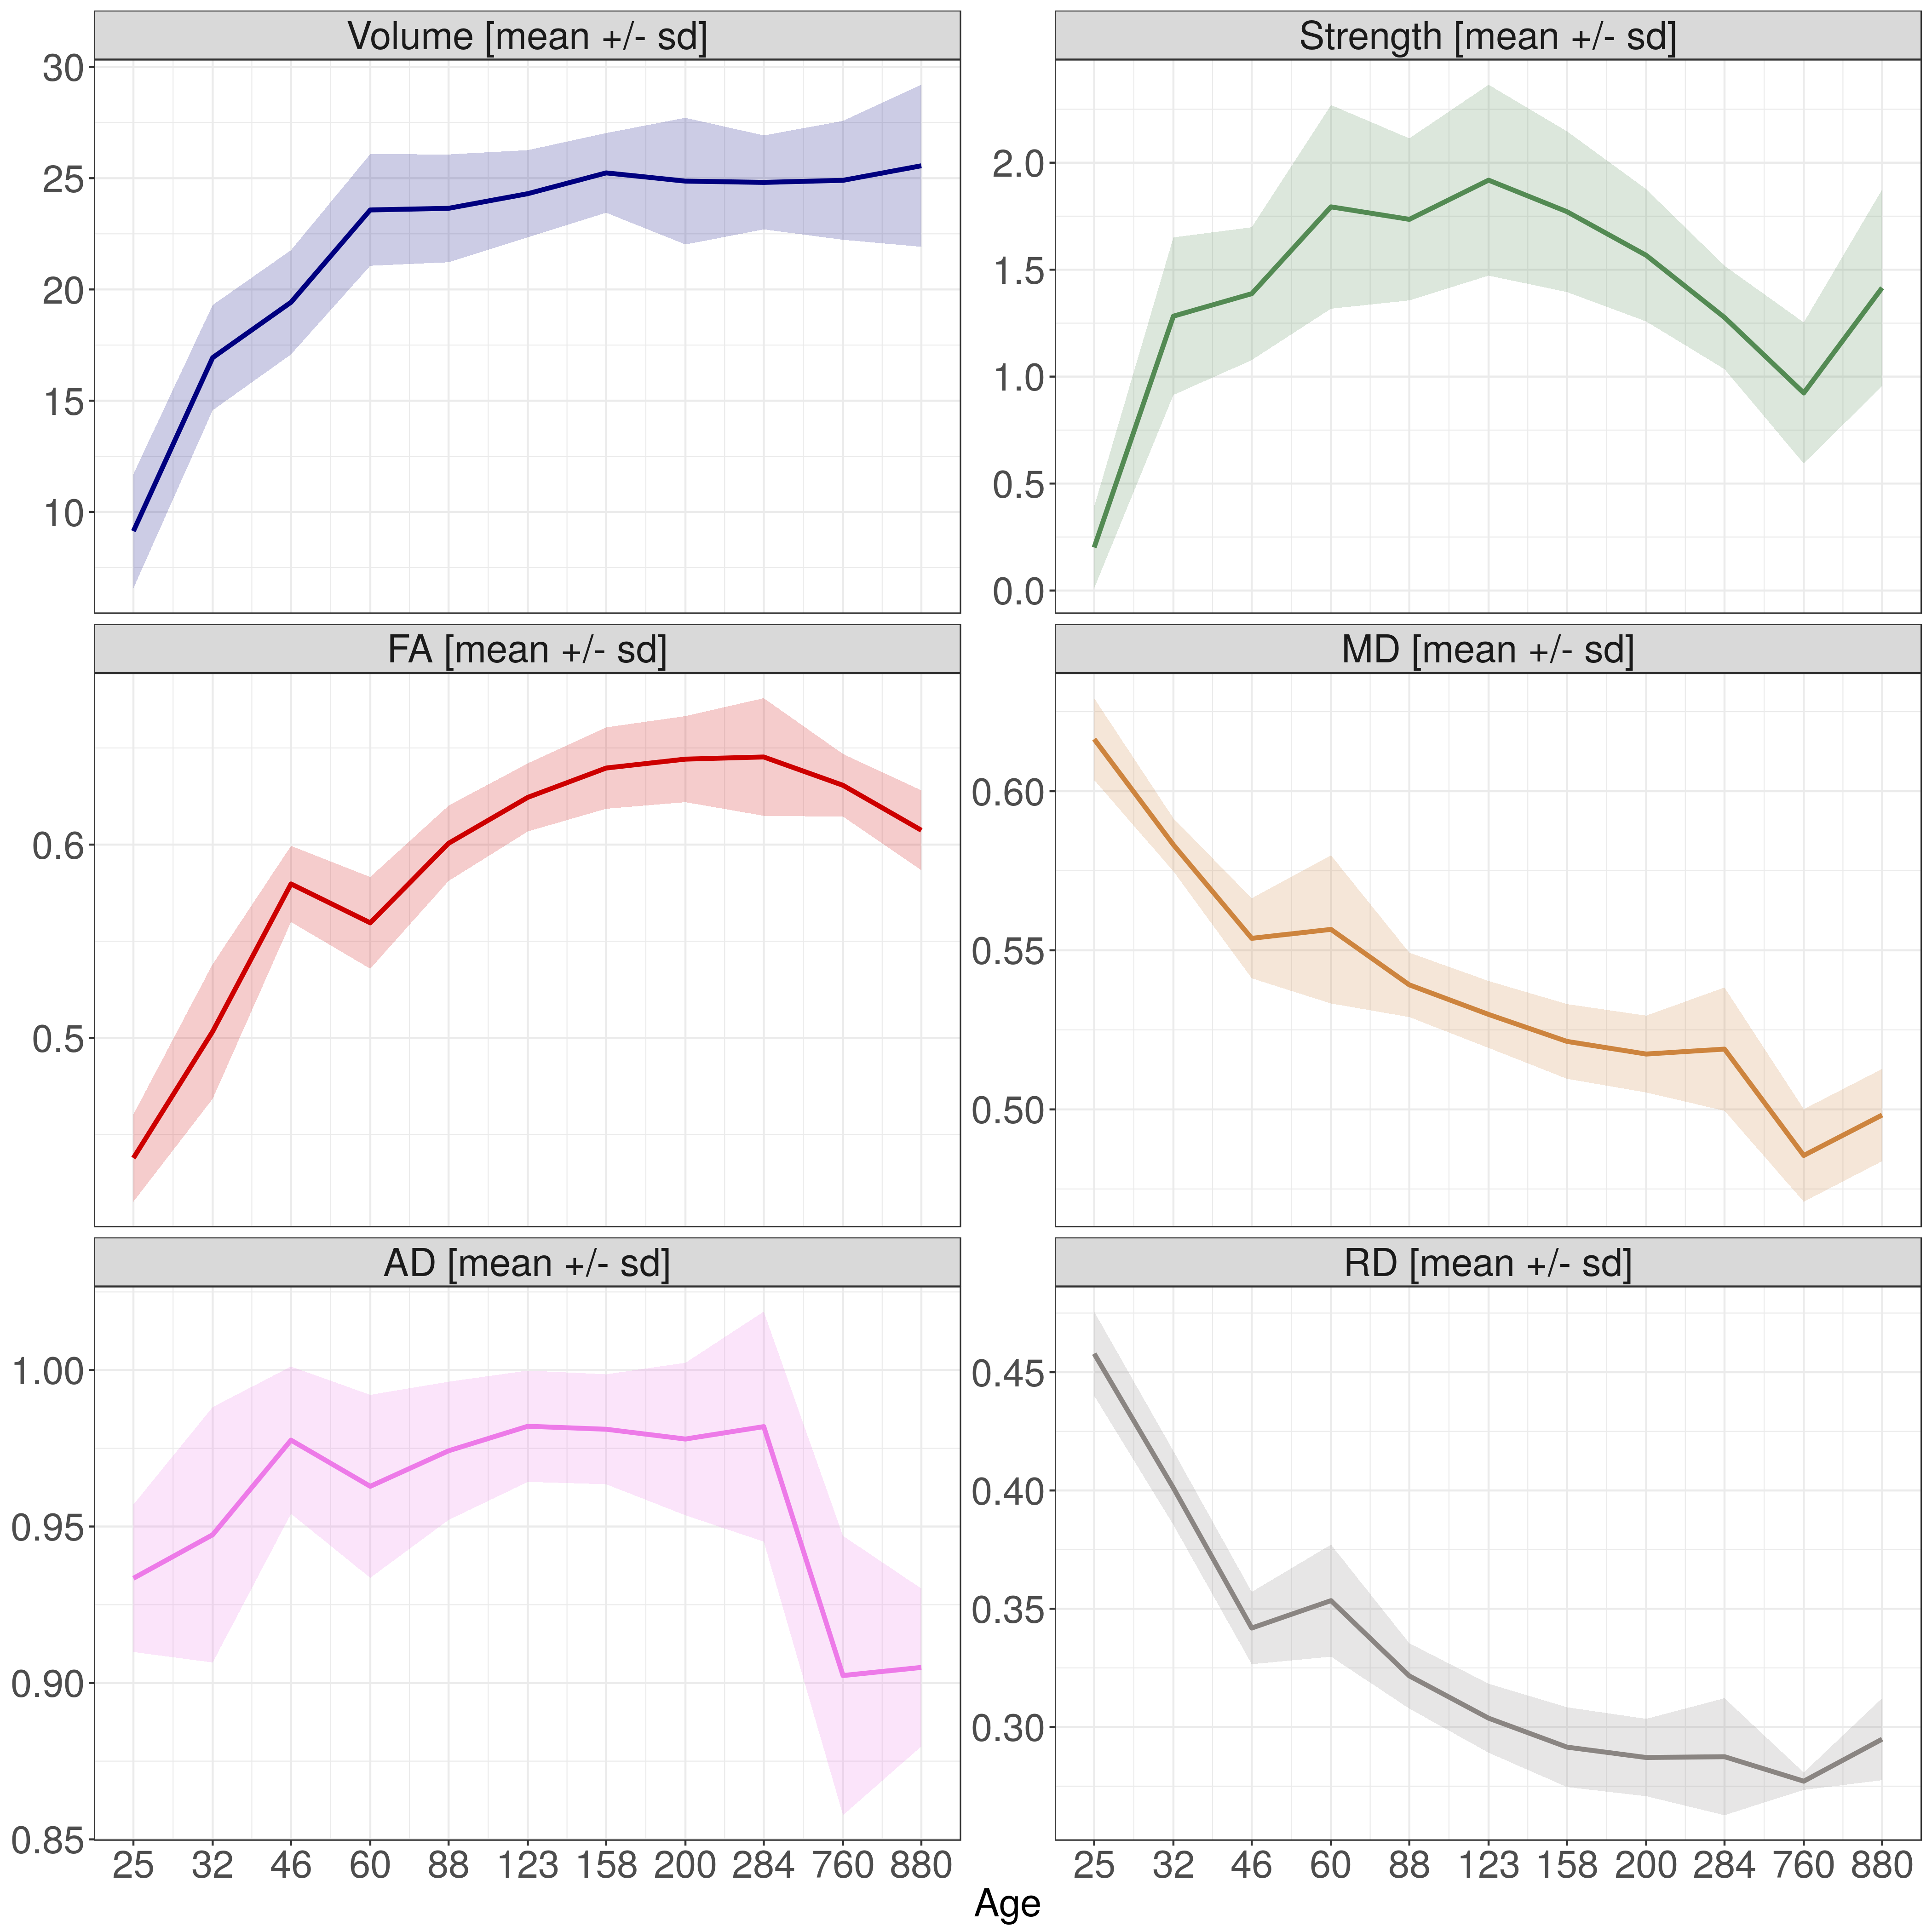
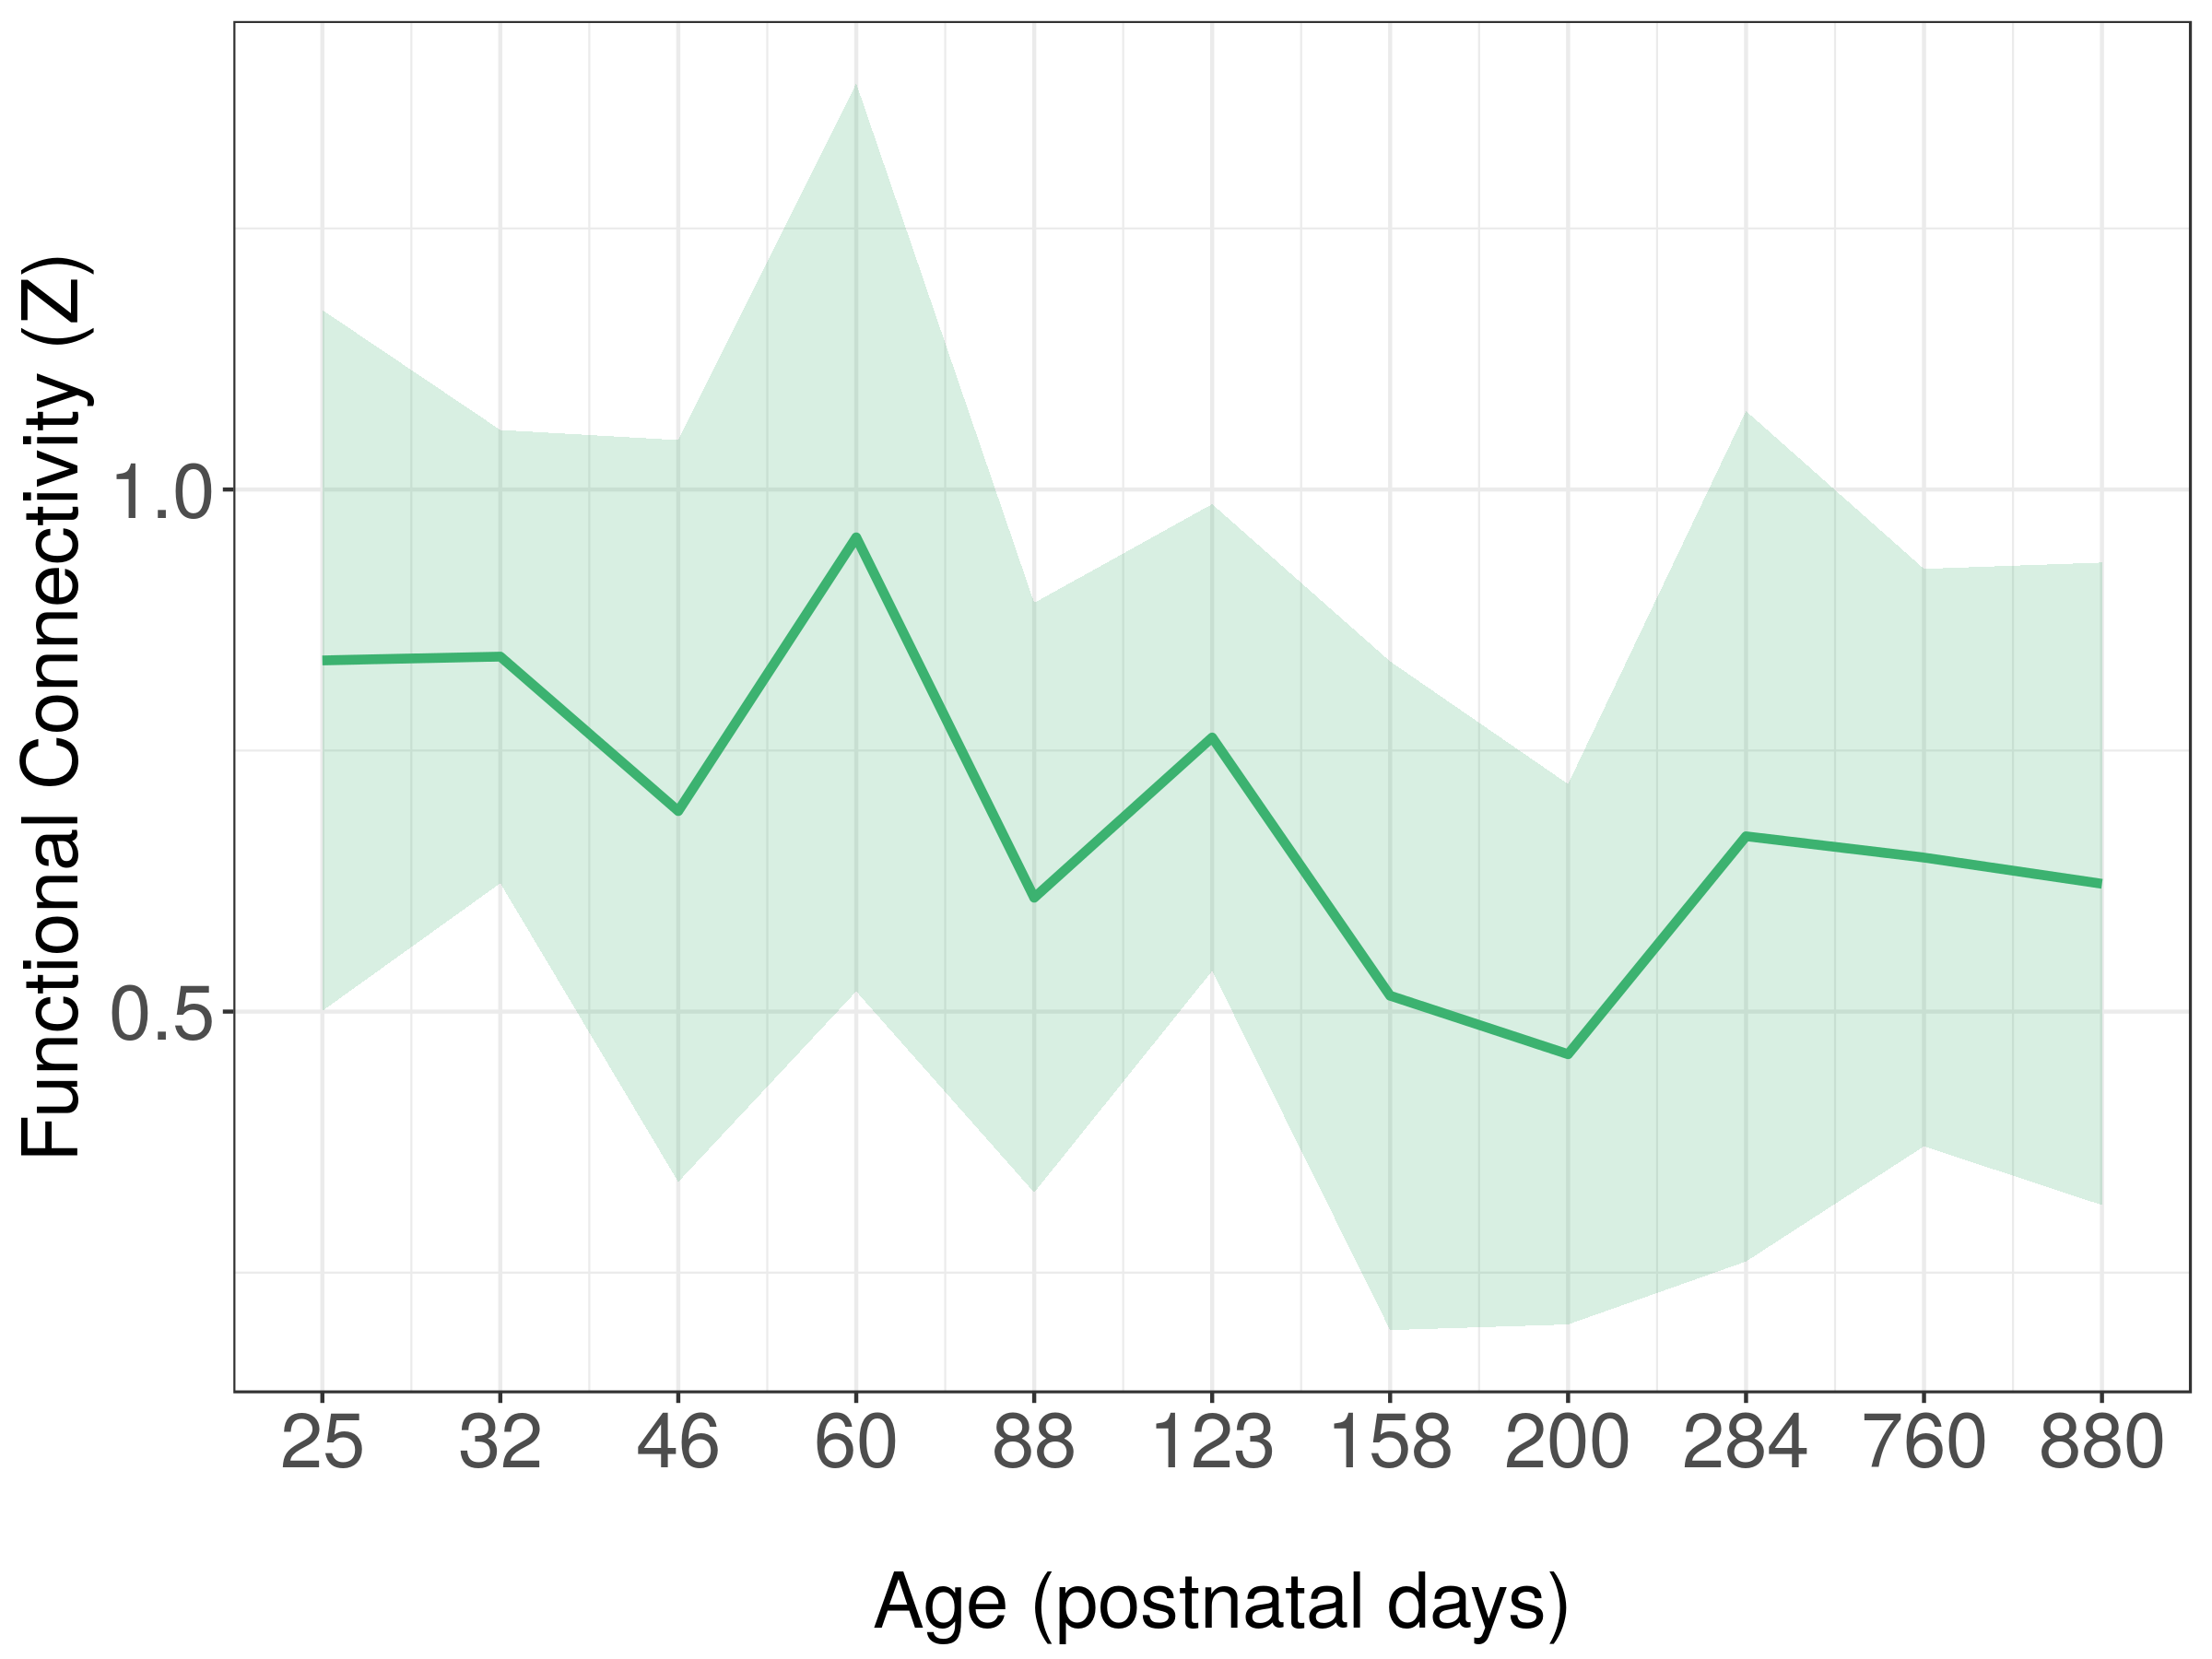
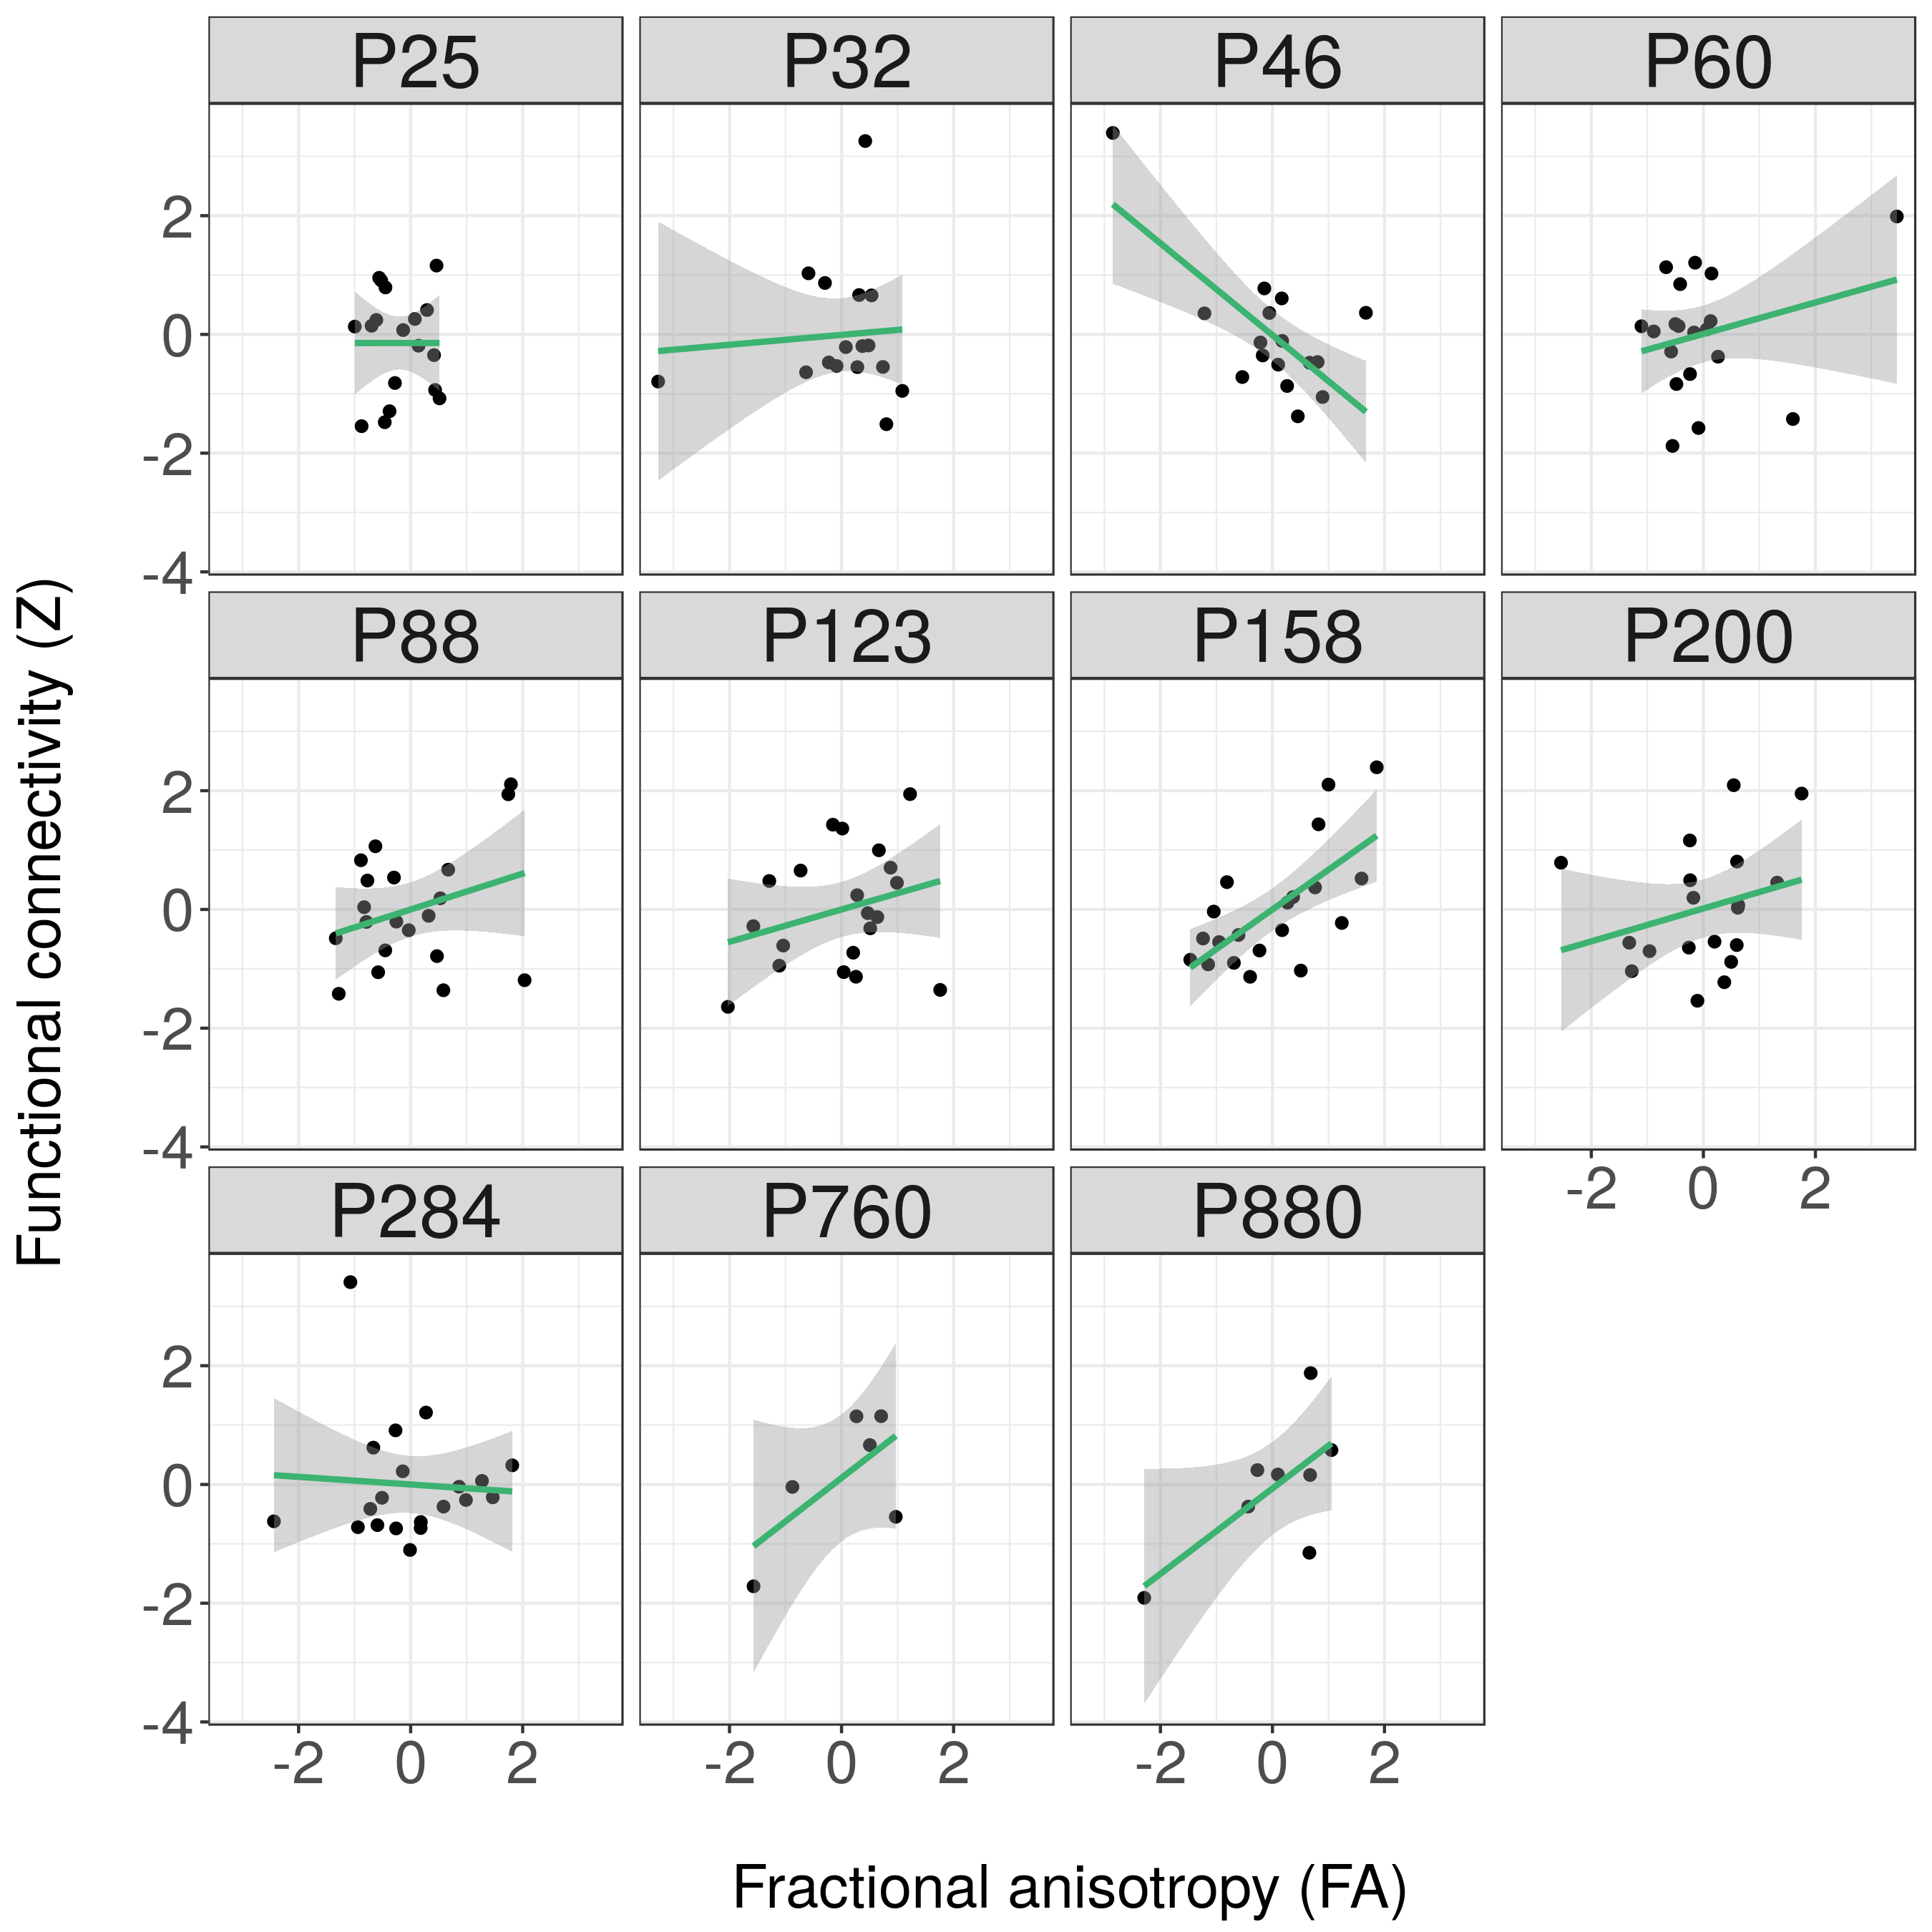
Over the lifespan, the total volume of white matter connections between right and left S1FL, running through the corpus callosum, increased according to a logarithmic pattern, together with the mean FA value, reaching plateau values around P60 (Figure 1). Structural connectivity strength and tract AD showed a similar pattern towards adulthood, but subsequently declined towards old age. Tract MD and RD decreased according to a logarithmic pattern over the lifespan. Functional connectivity showed a fluctuating pattern with a generally decreasing trend (Figure 2). Overall, there was a positive structure-function relationship (r=0.18, 95% C.I.=0.04-0.32, p<0.05) across the lifespan. However, structure-function correlation varied between developmental stages (Figure 3): no correlation at P25 and P32, a negative correlation at P46, and positive correlations from P60 until P880 (with exception of P284). Figure 4 shows that this translated to a general trend, be it with temporal fluctuations, of an increasing relationship between structural and functional interhemispheric connectivity.Discussion
SC and FC parameters, as well as the structure-function relationship, show characteristic patterns over the lifespan in the rat brain, as we identified in a major sensorimotor pathway. The overall positive relationship between SC and FC is in line with previous studies5,6. We show that this relationship is distinctly dependent on age, displaying a gradual increase, with characteristic fluctuations, between infancy and old age. The observed variations over time, particularly for FC, are suggestive of ongoing network reorganization7,8, which might be associated with age-dependent vulnerability or resilience to brain pathologies ranging from neurodevelopmental to neurodegenerative disorders.Acknowledgements
No acknowledgement found.References
1. Bassett, D. S. & Bullmore, E. T. Human brain networks in health and disease. Curr Opin Neurol. 22, 340–347 (2009).
2. Biswal, B. B. et al. Toward discovery science of human brain function. Proc. Natl. Acad. Sci. 107, 4734–4739 (2010).
3. Bullmore, E. & Sporns, O. Complex brain networks: graph theoretical analysis of structural and functional systems. Nat Rev Neurosci 10, 186–198 (2009).
4. Van Meer, M. P. A. et al. Recovery of sensorimotor function after experimental stroke correlates with restoration of resting-state interhemispheric functional connectivity. J. Neurosci. 30, 3964–3972 (2010).
5. Wang, Z., Dai, Z., Gong, G., Zhou, C. & He, Y. Understanding structural-functional relationships in the human brain. Neurosci. 21, 290–305 (2015).
6. Fjell, A. M. et al. Relationship between structural and functional connectivity change across the adult lifespan: A longitudinal investigation. Hum. Brain Mapp. 38, 561–573 (2017).
7. Meunier, D., Achard, S., Morcom, A. & Bullmore, E. Age-related changes in modular organization of human brain functional networks. Neuroimage 44, 715–723 (2009).
8. Westlye, L. T. et al. Life-span changes of the human brain white matter: Diffusion tensor imaging (DTI) and volumetry. Cereb. Cortex 20, 2055–2068 (2010).
Figures